. 2017 May 1;93(5):fix059.
doi: 10.1093/femsec/fix059.

Non-Redfield, nutrient synergy and flexible internal elemental stoichiometry in a marine bacterium

Affiliations

Non-Redfield, nutrient synergy and flexible internal elemental stoichiometry in a marine bacterium

Kathleen Trautwein et al. FEMS Microbiol Ecol. .

Abstract

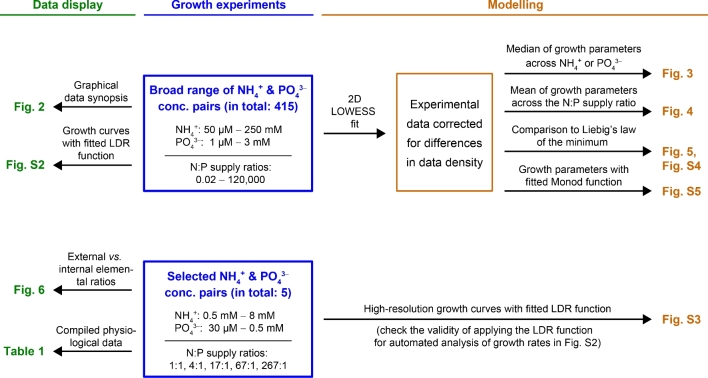
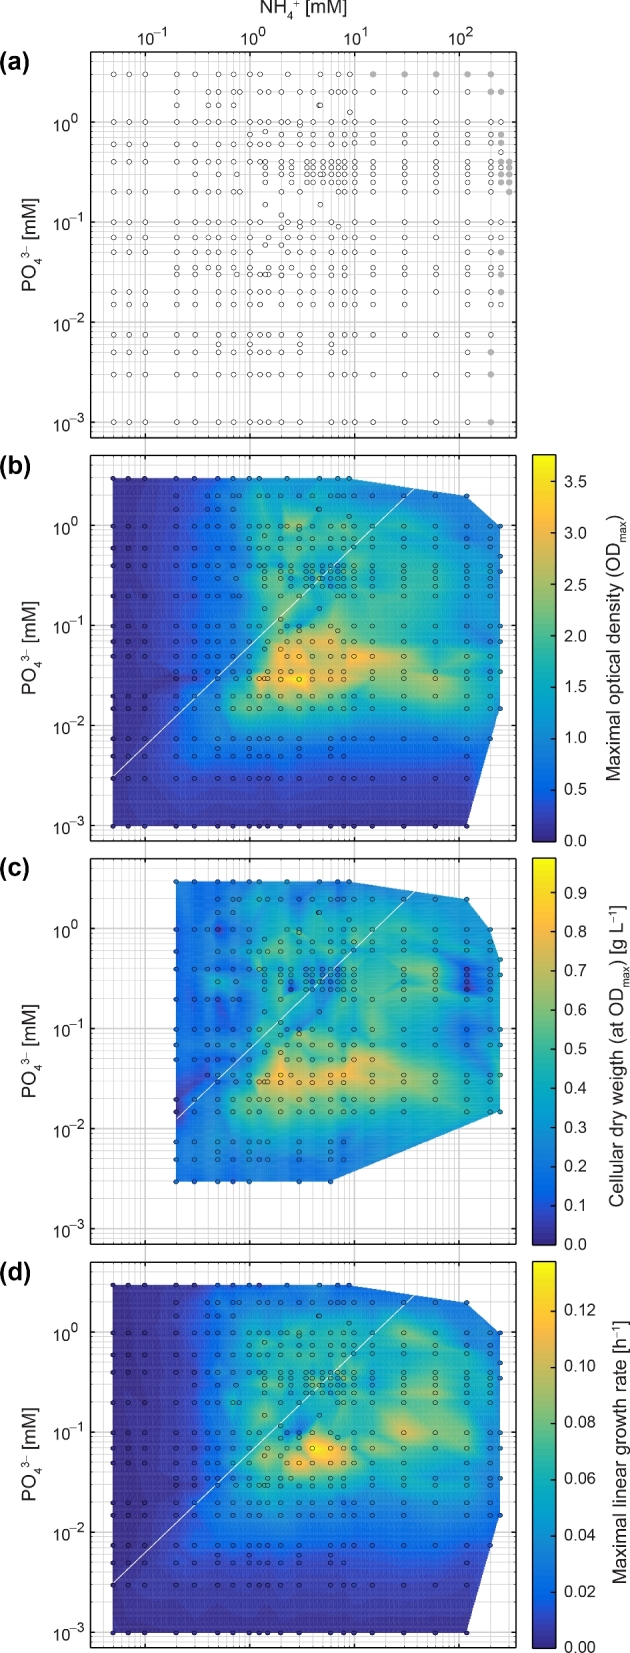
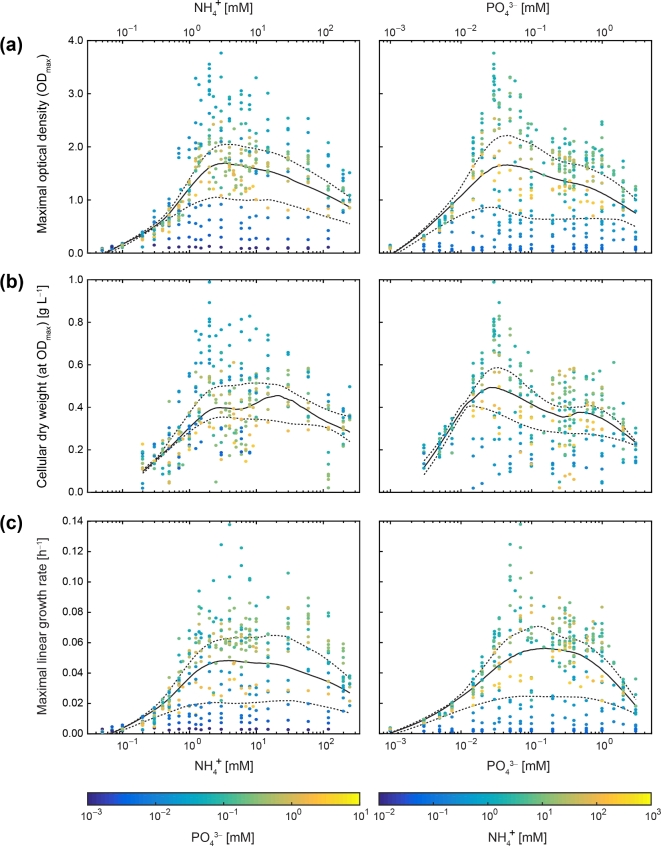
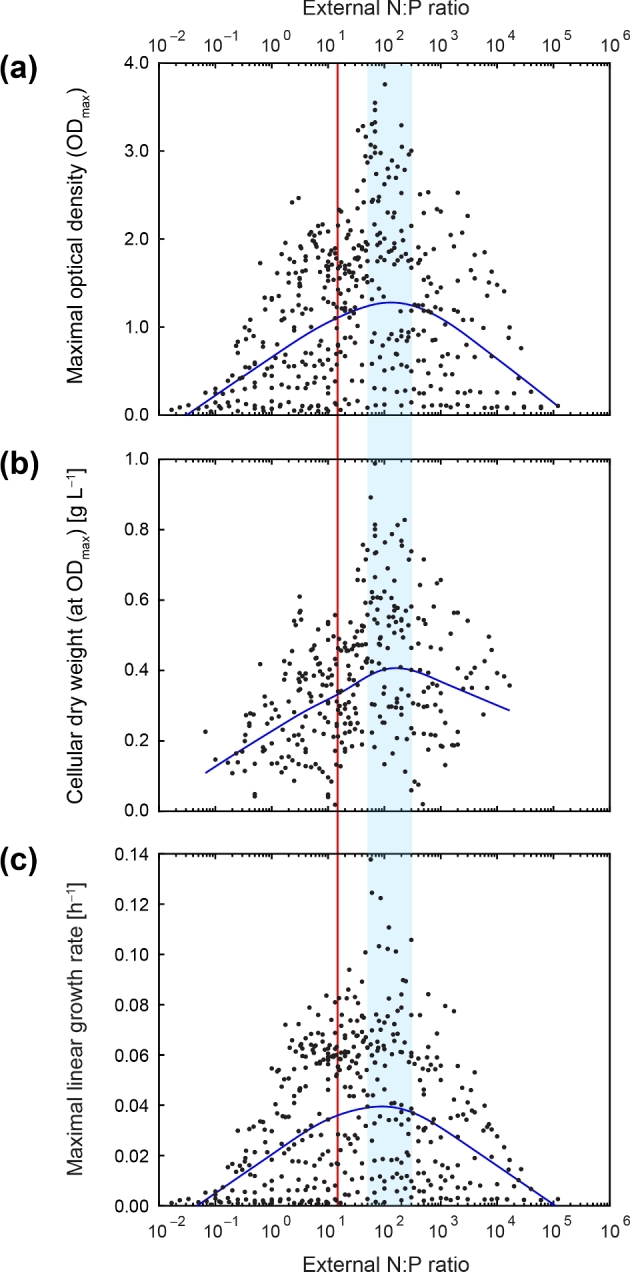
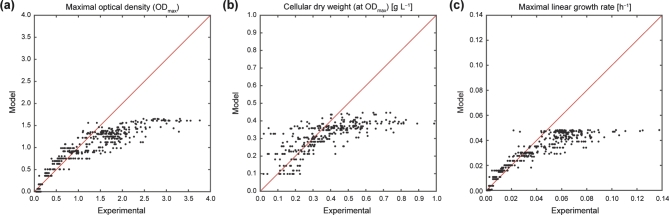
The stoichiometric constraints of algal growth are well understood, whereas there is less knowledge for heterotrophic bacterioplankton. Growth of the marine bacterium Phaeobacter inhibens DSM 17395, belonging to the globally distributed Roseobacter group, was studied across a wide concentration range of NH4+ and PO43-. The unique dataset covers 415 different concentration pairs, corresponding to 207 different molar N:P ratios (from 10-2 to 105). Maximal growth (by growth rate and biomass yield) was observed within a restricted concentration range at N:P ratios (∼50-120) markedly above Redfield. Experimentally determined growth parameters deviated to a large part from model predictions based on Liebig's law of the minimum, thus implicating synergistic co-limitation due to biochemical dependence of resources. Internal elemental ratios of P. inhibens varied with external nutrient supply within physiological constraints, thus adding to the growing evidence that aquatic bacteria can be flexible in their internal elemental composition. Taken together, the findings reported here revealed that P. inhibens is well adapted to fluctuating availability of inorganic N and P, expected to occur in its natural habitat (e.g. colonized algae, coastal areas). Moreover, this study suggests that elemental variability in bacterioplankton needs to be considered in the ecological stoichiometry of the oceans.

Keywords: Liebig limitation; N:P ratio; Phaeobacter inhibens DSM 17395; Redfield; ecological stoichiometry; growth physiology.


Figures

Figure 1.
Figure 1.
Conceptual design highlighting the interconnections of physiological and modeling approaches, as applied in this study.
Figure 2.
Figure 2.
Growth of P. inhibens with varying concentrations of NH4+ (50 μM to 250 mM) and PO43− (1 μM to 3 mM). Glucose (sole source of carbon and energy) was in each case provided at the same initial concentration (11 mM). NH4+ and PO43− concentrations are plotted in logarithmic scale, growth parameters in colored linear scales. (a) Grid display of the analyzed 415 different concentration pairs of NH4+ and PO43− that correspond to 207 different N:P supply ratios ranging from 10–2 to 105. Filled gray circles indicate concentrations where growth was not observed. Colored data maps display the (b) maximal optical density (ODmax) reached upon entry into stationary growth phase, (c) the attained cellular dry weight at ODmax and (d) the calculated maximal growth rate (μlin) during linear growth (representing the major active growth phase) for each concentration pair of NH4+ and PO43−. The diagonal white line represents the canonical Redfield N:P ratio of 16:1. The circles in subfigures b–d represent experimentally determined values and colored areas between these data points were retrieved by linear interpolation. See Fig. 3 for analyzed growth parameters as a function of NH4+ or PO43− concentration. Corresponding growth curves with fitted logistic dose–response (LDR) function are compiled in Fig. S2 (Supporting Information).
Figure 3.
Figure 3.
Median of growth parameters across NH4+ and PO43− concentrations. Semilogarithmic profiles of (a) maximal optical density (ODmax), (b) cellular dry weight at ODmax and (c) maximal linear growth rate (μlin) for P. inhibens as a function of NH4+ or PO43− concentration (see Fig. 2b–d for joint display in color maps). Colors of data points indicate the corresponding NH4+ or PO43− concentration, respectively. The black solid line displays the calculated median and the dashed ones the 25% and 75% quantiles (based on 2D LOWESS fit to experimental data). A complementary fitting of a Monod function to the experimental data is shown in Fig. S5 (Supporting Information).
Figure 4.
Figure 4.
Mean of growth parameters across the N:P supply ratios. Semilogarithmic profiles of (a) maximal optical density (ODmax), (b) cellular dry weight at ODmax and (c) maximal linear growth rate (μlin) for P. inhibens as a function of the external N:P ratio. The blue line displays the calculated mean (based on 2D LOWESS fit) for the experimental data (black dots). The vertical red line marks the Redfield N:P ratio of 16:1. The blue shaded area delimits the approximate range of N:P supply ratios (∼50–120), at which the mean of the studied growth parameters was maximal.
Figure 5.
Figure 5.
Comparison of growth parameters to Liebig's law of the minimum. Experimental values for P. inhibens were compared to modeled ones for (a) maximal optical density (ODmax), (b) cellular dry weight at ODmax and (c) maximal linear growth rate (μlin) across the studied concentration range of NH4+ and PO43−. The diagonal red line represents the exact match of measured values to model prediction for single nutrient-limited growth based on Liebig's law of the minimum. For data points above this line, predicted values were higher than measured, whereas measured values exceeded the model prediction below this line. A more detailed comparison of experimental values with those predicted by Liebig's law of the minimum is shown in Fig. S4 (Supporting Information).
Figure 6.
Figure 6.
Imprint of external NH4+ and PO43− supply ratios on internal elemental stoichiometry of P. inhibens. (a) Internal elemental ratios for C, N, and P as a function of the consumption ratio of glucose, NH4+ and PO43− (both at ODmax). (b) Relation of maximal linear growth rate (μlin) to internal elemental ratios (both at ∼0.5 ODmax). Linear growth represented the major active growth phase, whereas exponential growth was mostly very short and confined to early growth. Values for μlin were largest during P-limitation, whereas the exponential growth rate (μexp; Table 1) was higher under P-excess (as to be expected from the growth rate hypothesis; Elser et al.2000). (c) Internal N:P ratios of P. inhibens (blue) and phytoplankton (gray) as a function of external N:P ratios. Phytoplankton data (from marine and freshwater species) were compiled from a meta-analysis of phytoplankton stoichiometry and growth rate (Hillebrand et al.2013). The gray line displays the median across the phytoplankton data. LN represents the natural logarithm.

References

    1. Adam B, Klawonn I, Svedén JB et al. . N2-fixation, ammonium release and N-transfer to the microbial and classical food web within a plankton community. ISME J 2016;10:450–9. - PMC - PubMed
    1. Allen MM. Cyanobacterial cell inclusions. Ann Rev Microbiol 1984;38:1–25. - PubMed
    1. Azam F, Malfatti F. Microbial structuring of marine ecosystems. Nat Rev Microbiol 2007;5:782–91. - PubMed
    1. Beckon WN, Parkins C, Maximovich A et al. . A general approach to modeling biphasic relationships. Environ Sci Technol 2008;42:1308–14. - PubMed
    1. Bidle KD, Azam F. Accelerated dissolution of diatom silica by marine bacterial assemblages. Nature 1999;397:508–12.

LinkOut - more resources