

Atheroma Susceptible to Thrombosis Exhibit Impaired Endothelial Permeability In Vivo as Assessed by Nanoparticle-Based Fluorescence Molecular Imaging
- PMID: 28487316
- PMCID: PMC5509162
- DOI: 10.1161/CIRCIMAGING.116.005813
Atheroma Susceptible to Thrombosis Exhibit Impaired Endothelial Permeability In Vivo as Assessed by Nanoparticle-Based Fluorescence Molecular Imaging
Abstract
Background: The role of local alterations in endothelial functional integrity in atherosclerosis remains incompletely understood. This study used nanoparticle-enhanced optical molecular imaging to probe in vivo mechanisms involving impaired endothelial barrier function in experimental atherothrombosis.
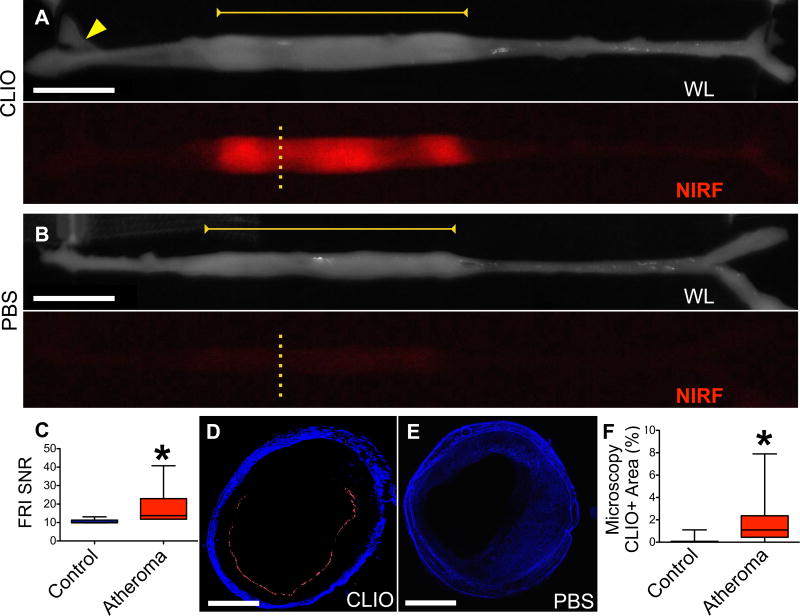
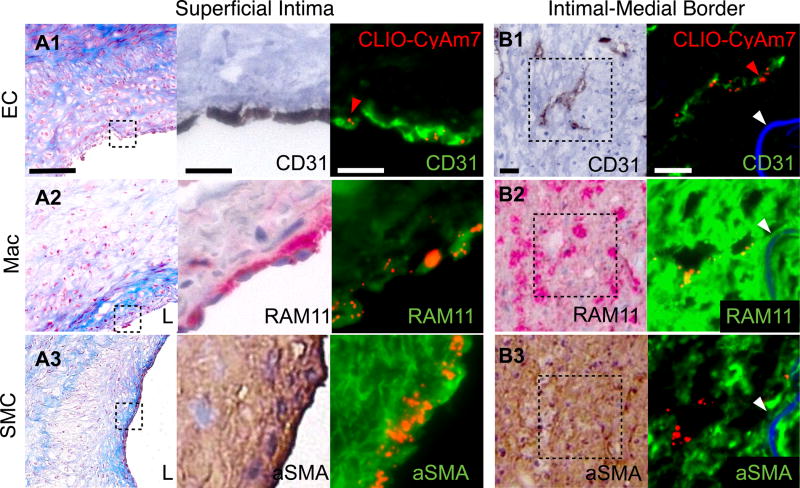
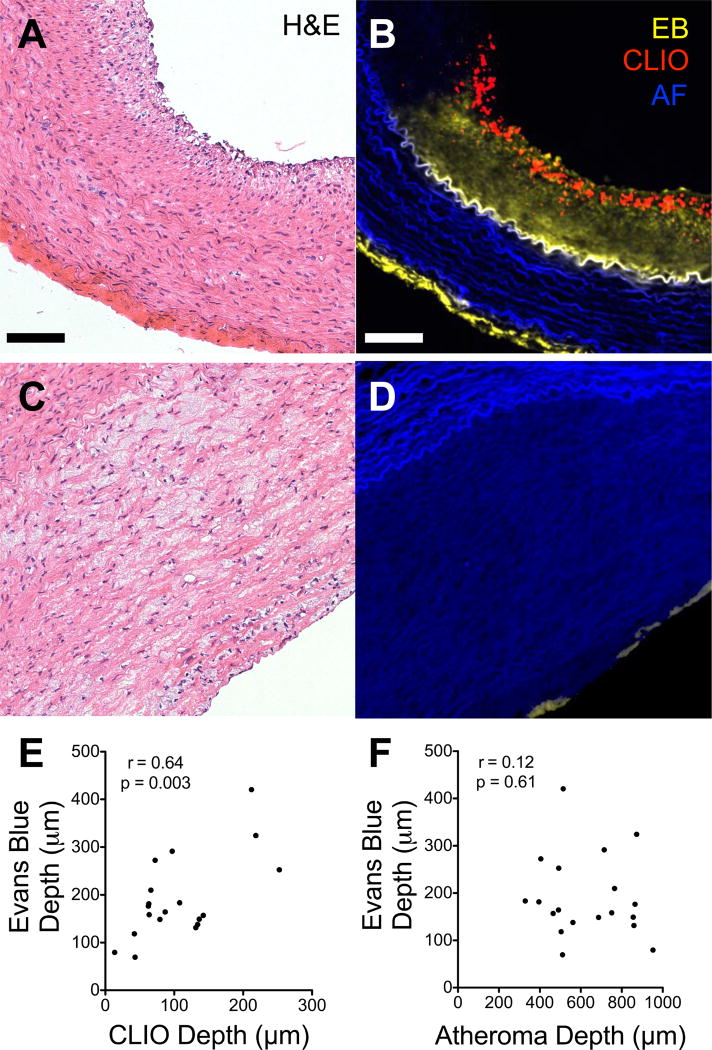
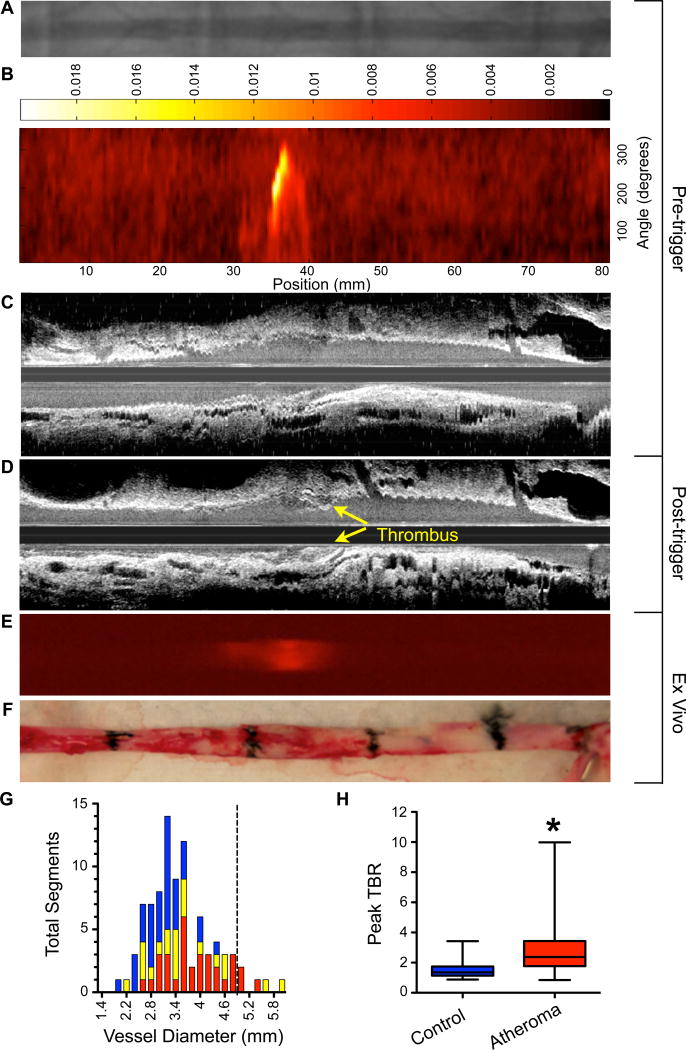
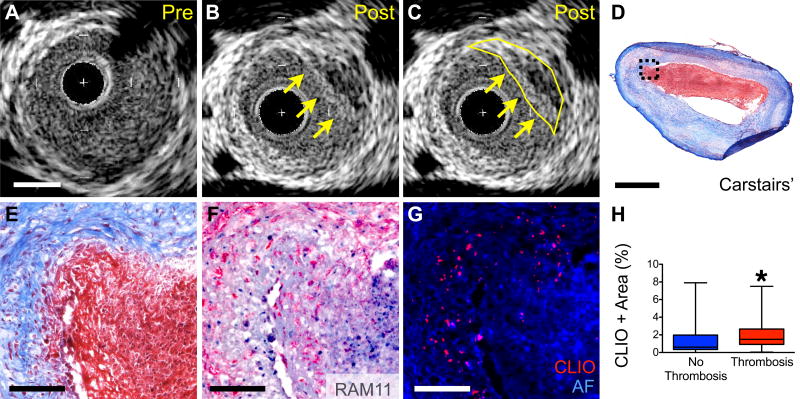
Methods and results: Atherosclerosis was induced in rabbits (n=31) using aortic balloon injury and high-cholesterol diet. Rabbits received ultrasmall superparamagnetic iron oxide nanoparticles (CLIO) derivatized with a near-infrared fluorophore (CyAm7) 24 hours before near-infrared fluorescence imaging. Rabbits were then either euthanized (n=9) or underwent a pharmacological triggering protocol to induce thrombosis (n=22). CLIO-CyAm7 nanoparticles accumulated in areas of atheroma (P<0.05 versus reference areas). On near-infrared fluorescence microscopy, CLIO-CyAm7 primarily deposited in the superficial intima within plaque macrophages, endothelial cells, and smooth muscle cells. Nanoparticle-positive areas further exhibited impaired endothelial barrier function as illuminated by Evans blue leakage. Deeper nanoparticle deposition occurred in areas of plaque neovascularization. In rabbits subject to pharmacological triggering, plaques that thrombosed exhibited significantly higher CLIO-CyAm7 accumulation compared with nonthrombosed plaques (P<0.05). In thrombosed plaques, nanoparticles accumulated preferentially at the plaque-thrombus interface. Intravascular 2-dimensional near-infrared fluorescence imaging detected nanoparticles in human coronary artery-sized atheroma in vivo (P<0.05 versus reference segments).
Conclusions: Plaques that exhibit impaired in vivo endothelial permeability in cell-rich areas are susceptible to subsequent thrombosis. Molecular imaging of nanoparticle deposition may help to identify biologically high-risk atheroma.
Keywords: atherosclerosis; cholesterol; endothelium; molecular imaging; thrombosis.
© 2017 American Heart Association, Inc.
Figures
Comment in
-
Intraplaque and Cellular Distribution of Dextran-Coated Iron Oxide Fluorescently Labeled Nanoparticles: Insights Into Atherothrombosis and Plaque Rupture.Circ Cardiovasc Imaging. 2017 May;10(5):e006533. doi: 10.1161/CIRCIMAGING.117.006533. Circ Cardiovasc Imaging. 2017. PMID: 28487323 Free PMC article. No abstract available.
Similar articles
-
Targeted Near-Infrared Fluorescence Imaging of Atherosclerosis: Clinical and Intracoronary Evaluation of Indocyanine Green.JACC Cardiovasc Imaging. 2016 Sep;9(9):1087-1095. doi: 10.1016/j.jcmg.2016.01.034. Epub 2016 Aug 17. JACC Cardiovasc Imaging. 2016. PMID: 27544892 Free PMC article. Clinical Trial.
-
64Cu-DTPA-CLIO-VT680.2008 Feb 8 [updated 2008 Mar 11]. In: Molecular Imaging and Contrast Agent Database (MICAD) [Internet]. Bethesda (MD): National Center for Biotechnology Information (US); 2004–2013. 2008 Feb 8 [updated 2008 Mar 11]. In: Molecular Imaging and Contrast Agent Database (MICAD) [Internet]. Bethesda (MD): National Center for Biotechnology Information (US); 2004–2013. PMID: 20641719 Free Books & Documents. Review.
-
In vivo near infrared fluorescence (NIRF) intravascular molecular imaging of inflammatory plaque, a multimodal approach to imaging of atherosclerosis.J Vis Exp. 2011 Aug 4;(54):2257. doi: 10.3791/2257. J Vis Exp. 2011. PMID: 21847078 Free PMC article.
-
Fully integrated high-speed intravascular optical coherence tomography/near-infrared fluorescence structural/molecular imaging in vivo using a clinically available near-infrared fluorescence-emitting indocyanine green to detect inflamed lipid-rich atheromata in coronary-sized vessels.Circ Cardiovasc Interv. 2014 Aug;7(4):560-9. doi: 10.1161/CIRCINTERVENTIONS.114.001498. Epub 2014 Jul 29. Circ Cardiovasc Interv. 2014. PMID: 25074255
-
Recent Advances in Fluorescent Angioscopy for Molecular Imaging of Human Atherosclerotic Coronary Plaque.J Atheroscler Thromb. 2017 Jun 1;24(6):539-551. doi: 10.5551/jat.40352. Epub 2017 Apr 4. J Atheroscler Thromb. 2017. PMID: 28381766 Free PMC article. Review.
Cited by
-
Endothelial permeability, LDL deposition, and cardiovascular risk factors-a review.Cardiovasc Res. 2018 Jan 1;114(1):35-52. doi: 10.1093/cvr/cvx226. Cardiovasc Res. 2018. PMID: 29228169 Free PMC article. Review.
-
Salvianolic acid A prevented cerebrovascular endothelial injury caused by acute ischemic stroke through inhibiting the Src signaling pathway.Acta Pharmacol Sin. 2021 Mar;42(3):370-381. doi: 10.1038/s41401-020-00568-2. Epub 2020 Dec 10. Acta Pharmacol Sin. 2021. PMID: 33303991 Free PMC article.
-
Diagnostic and therapeutic optical imaging in cardiovascular diseases.iScience. 2024 Oct 22;27(11):111216. doi: 10.1016/j.isci.2024.111216. eCollection 2024 Nov 15. iScience. 2024. PMID: 39569375 Free PMC article. Review.
-
Paclitaxel Drug-Coated Balloon Angioplasty Suppresses Progression and Inflammation of Experimental Atherosclerosis in Rabbits.JACC Basic Transl Sci. 2020 Jun 10;5(7):685-695. doi: 10.1016/j.jacbts.2020.04.007. eCollection 2020 Jul. JACC Basic Transl Sci. 2020. PMID: 32760856 Free PMC article.
-
Peroxisome proliferator‑activated receptor γ alleviates human umbilical vein endothelial cell injury in deep vein thrombosis by blocking endoplasmic reticulum stress.Exp Ther Med. 2024 Aug 1;28(4):385. doi: 10.3892/etm.2024.12674. eCollection 2024 Oct. Exp Ther Med. 2024. PMID: 39161618 Free PMC article.
References
-
- Libby P. Mechanisms of acute coronary syndromes and their implications for therapy. The New England journal of medicine. 2013;368:2004–13. - PubMed
-
- Virmani R, Burke AP, Farb A, Kolodgie FD. Pathology of the vulnerable plaque. J Am Coll Cardiol. 2006;47:C13–8. - PubMed
-
- Libby P, Pasterkamp G. Requiem for the 'vulnerable plaque'. European heart journal. 2015;36:2984–7. - PubMed
MeSH terms
Grants and funding
LinkOut - more resources
Full Text Sources
Other Literature Sources
Medical
