

In vivo structures of an intact type VI secretion system revealed by electron cryotomography
- PMID: 28487352
- PMCID: PMC5494534
- DOI: 10.15252/embr.201744072
In vivo structures of an intact type VI secretion system revealed by electron cryotomography
Abstract
The type VI secretion system (T6SS) is a versatile molecular weapon used by many bacteria against eukaryotic hosts or prokaryotic competitors. It consists of a cytoplasmic bacteriophage tail-like structure anchored in the bacterial cell envelope via a cytoplasmic baseplate and a periplasmic membrane complex. Rapid contraction of the sheath in the bacteriophage tail-like structure propels an inner tube/spike complex through the target cell envelope to deliver effectors. While structures of purified contracted sheath and purified membrane complex have been solved, because sheaths contract upon cell lysis and purification, no structure is available for the extended sheath. Structural information about the baseplate is also lacking. Here, we use electron cryotomography to directly visualize intact T6SS structures inside Myxococcus xanthus cells. Using sub-tomogram averaging, we resolve the structure of the extended sheath and membrane-associated components including the baseplate. Moreover, we identify novel extracellular bacteriophage tail fiber-like antennae. These results provide new structural insights into how the extended sheath prevents premature disassembly and how this sophisticated machine may recognize targets.
Keywords: bacterial molecular weapon; contractile bacteriophage tail; electron cryotomography; sub‐tomogram averaging; type VI secretion system.
© 2017 The Authors.
Figures
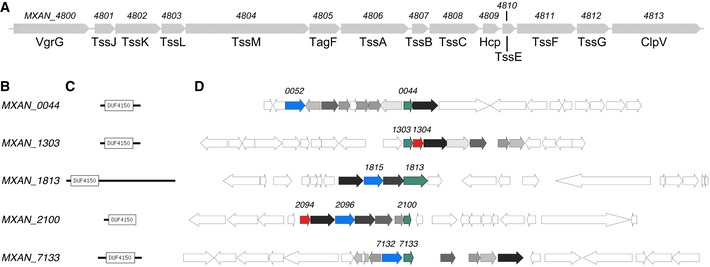
The cluster of conserved T6SS genes (MXAN_4800–MXAN_4813) in the genome of M. xanthus.
Locus number of putative PAAR‐repeat proteins.
Domain architecture as predicted with PFAM 30.
Gene neighborhood of putative PAAR‐repeat proteins (green). Distant homologs to proteins known to have a role in the function of T6SS in other organisms are highlighted: VgrG (red) and DUF2169‐containing proteins (blue). All gene clusters share similar set of homologs of less known proteins (shades of gray).
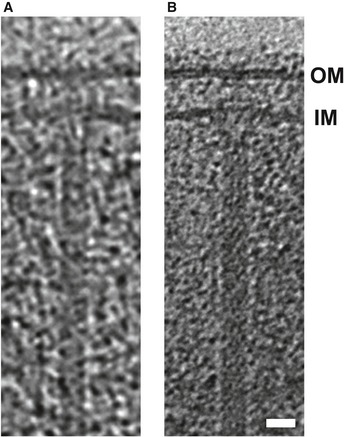
A T6SS structure captured by correlated cryo‐PALM/ECT in our previous study 15 using a defocus of −10 μm during data collection.
A similar structure captured in a cryotomogram of an M. xanthus cell with a defocus of −6 μm. Tomography slices through full 3D reconstructions of intact cells are shown in both cases.
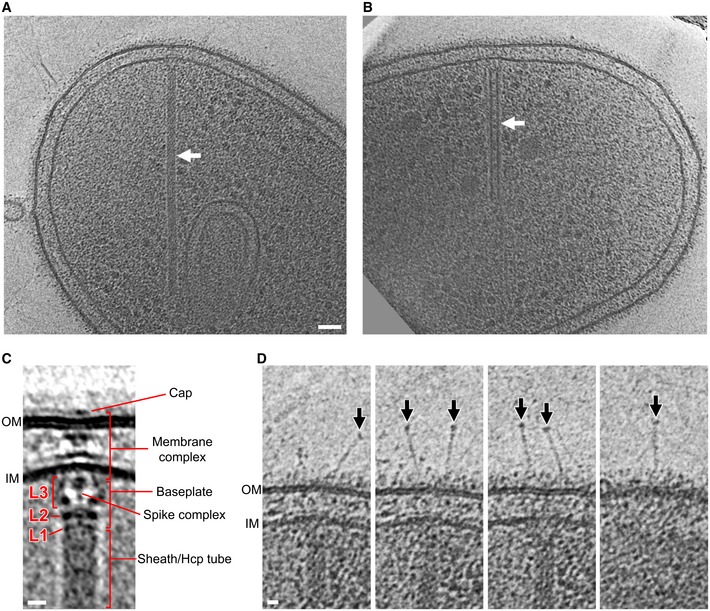
- A, B
Tomographic slices through an extended T6SS (A) and a contracted T6SS (B) (arrows) in frozen‐hydrated M. xanthus cells.
- C
Central slice of the sub‐tomogram average of the extended T6SS. L1–L3: different layers of densities in between the sheath and the IM.
- D
Extracellular bacteriophage tail fiber‐like antennae (arrows) captured in different slices of the tomogram shown in (A).
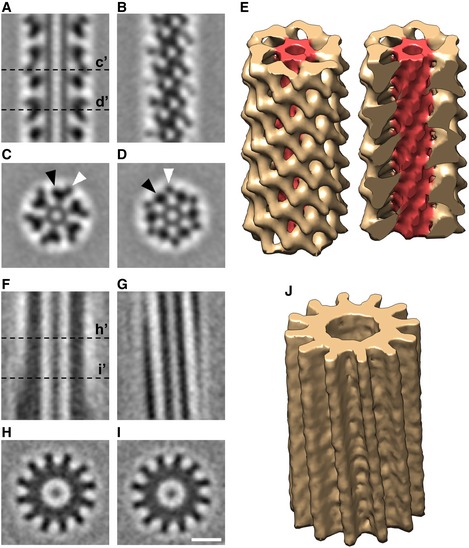
- A, B
Slices through the center (A) and surface (B) of the sub‐tomogram average of the extended T6SS sheath.
- C, D
Slices of cross sections C’ and D’ of the sub‐tomogram average shown in (A). Black and white arrowheads indicate the large and small domains of the sheath subunit, respectively.
- E
3D envelope of the extended T6SS sheath sub‐tomogram average. The sheath is colored in yellow and the Hcp inner tube in red. Left: the full molecule is displayed; right: a clipping plane is used to display the Hcp inner tube.
- F–J
The same representations as in (A–E) for the contracted T6SS.
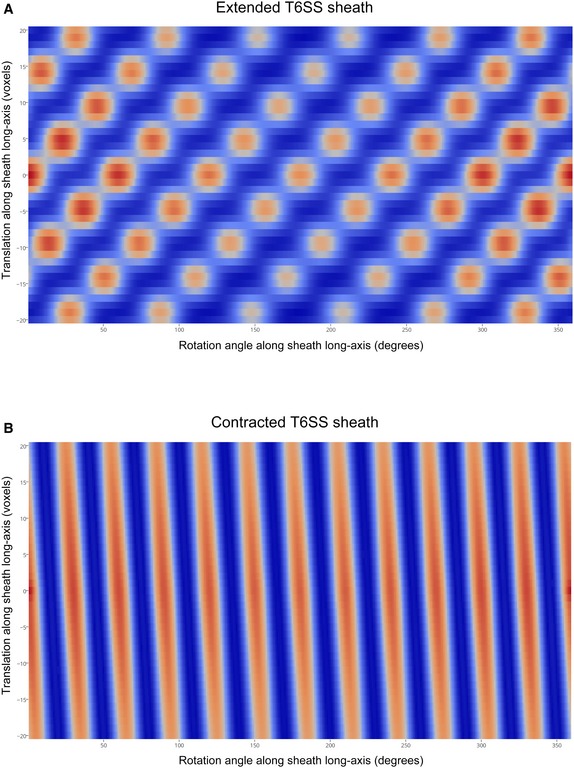
- A, B
Autocorrelation plots of the sub‐tomogram average of extended (A) and contracted (B) sheaths, respectively. Translational search: −20 to +20 voxels, with increments of 1 voxel (voxel dimensions: 7.8 Å × 7.8 Å × 7.8 Å); rotational search: 360°, with increments of 1°. Blue to red colors indicate low to high correlation.
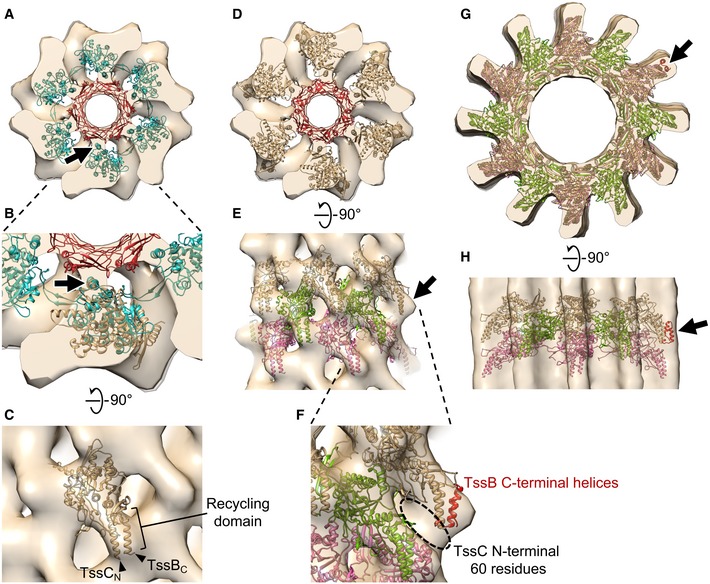
An atomic model of the extended R‐type pyocin (PDB 3J9Q) placed in the envelope of the extended T6SS sheath sub‐tomogram average, fitting the Hcp inner tube (red) and the attachment α‐helix (arrow) in the sheath (cyan) to corresponding densities. The envelope shown here contains two layers of the extended sheath.
Enlarged view of part of (A), with an MxTssBC model superposed on one sheath subunit of the R‐type pyocin structure. Arrow: the conserved attachment α‐helix in T6SS and R‐type pyocin sheath subunits.
Side view of (B) after the MxTssBC model was rotated to best fit the density. TssCN and TssBC indicate the N‐terminus of TssC and C‐terminus of TssB, respectively.
The model of hexameric MxTssBC‐MxHcp (one layer of the extended T6SS sheath) placed in the envelope of the extended M. xanthus T6SS sheath sub‐tomogram average. The envelope shown here contains two layers of the extended sheath.
Side view of (D) after fitting three consecutive layers of the hexameric MxTssBC‐MxHcp model (shown in different colors) into the envelope. Arrow: density not fully occupied by the model.
Enlarged view of part of (E), with the model of TssB C‐terminal helices (red; generated using PDB 4PS2) concatenated to the model in (E). Dashed circle: densities likely occupied by the TssC N‐terminal 60 amino acid residues, whose structure was absent in the MxTssBC model.
The homology model of the contracted M. xanthus T6SS sheath (generated using PDB 3J9G) placed into the envelope of the contracted T6SS sheath sub‐tomogram average. Three consecutive layers of the hexameric MxTssBC model are shown in different colors.
Side view of (G).
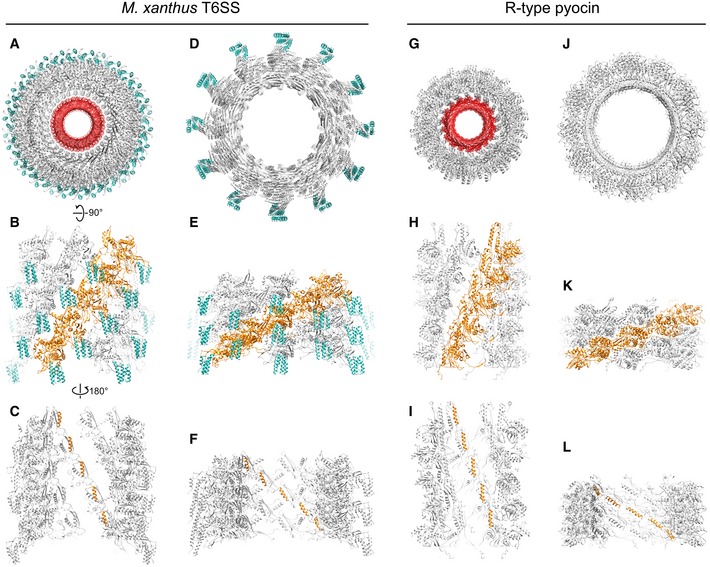
- A
Top view of the extended M. xanthus T6SS sheath model containing five layers of MxTssBC‐MxHcp hexamers. The sheath is colored gray, with the recycling domain colored cyan. The Hcp inner tube is colored red.
- B
Side view of the model in (A), with only the front half shown for clarity. One protofilament of the sheath is colored orange.
- C
Back view (from inside the tube) of model shown in (B). Here, only the attachment α‐helices in one protofilament of the sheath are colored orange.
- D–F
The same representations as in (A–C) but for the contracted M. xanthus T6SS sheath.
- G–L
The same representations as in (A–F) but for the R‐type pyocin.
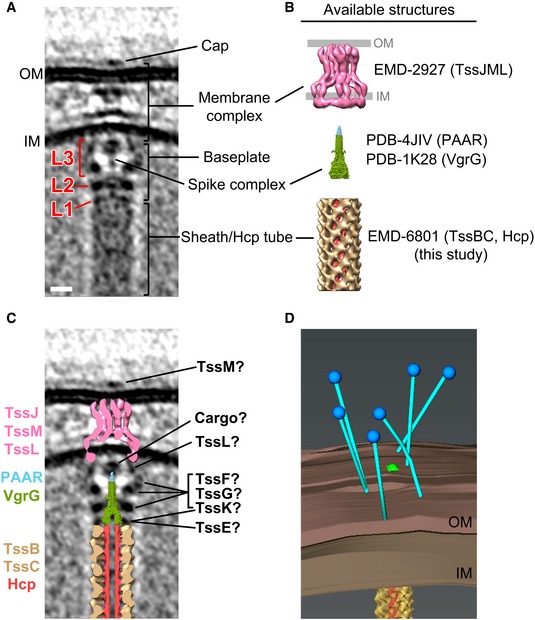
Central slice of the sub‐tomogram average of M. xanthus T6SS membrane‐associated region.
Available structures and models of individual components. The membrane complex structure (EMD‐2927) is shown with the OM and IM locations defined by previous work 17. The spike complex model was generated by concatenating the structure of VgrG from bacteriophage T4 (PDB 1K28) with non‐homologous parts removed with the crystal structure of the T6SS PAAR‐repeat protein (PDB 4JIV). The extended sheath/Hcp tube structure was generated in this study (EMD‐8601).
Placing the central slices of available structures into the average shown in (A).
3D segmentation of the bacteriophage tail fiber‐like antennae shown in Fig 1D (blue: bacteriophage tail fiber‐like antennae; brown: inner and outer membranes; yellow: sheath; red: Hcp inner tube).
References
-
- Cianfanelli FR, Monlezun L, Coulthurst SJ (2016) Aim, load, fire: the type VI secretion system, a bacterial nanoweapon. Trends Microbiol 24: 51–62 - PubMed
-
- Zoued A, Brunet YR, Durand E, Aschtgen MS, Logger L, Douzi B, Journet L, Cambillau C, Cascales E (2014) Architecture and assembly of the Type VI secretion system. Biochim Biophys Acta 1843: 1664–1673 - PubMed
Publication types
MeSH terms
Substances
Grants and funding
LinkOut - more resources
Full Text Sources
Other Literature Sources
