

The chromatin remodelling factor ATRX suppresses R-loops in transcribed telomeric repeats
- PMID: 28487353
- PMCID: PMC5452009
- DOI: 10.15252/embr.201643078
The chromatin remodelling factor ATRX suppresses R-loops in transcribed telomeric repeats
Abstract
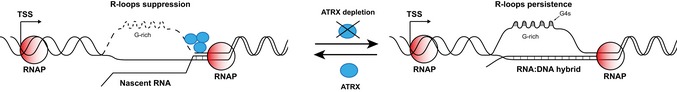
ATRX is a chromatin remodelling factor found at a wide range of tandemly repeated sequences including telomeres (TTAGGG)n ATRX mutations are found in nearly all tumours that maintain their telomeres via the alternative lengthening of telomere (ALT) pathway, and ATRX is known to suppress this pathway. Here, we show that recruitment of ATRX to telomeric repeats depends on repeat number, orientation and, critically, on repeat transcription. Importantly, the transcribed telomeric repeats form RNA-DNA hybrids (R-loops) whose abundance correlates with the recruitment of ATRX Here, we show loss of ATRX is also associated with increased R-loop formation. Our data suggest that the presence of ATRX at telomeres may have a central role in suppressing deleterious DNA secondary structures that form at transcribed telomeric repeats, and this may account for the increased DNA damage, stalling of replication and homology-directed repair previously observed upon loss of ATRX function.
Keywords: ATRX; G‐quadruplex; R‐loops; telomeres.
© 2017 The Authors.
Figures
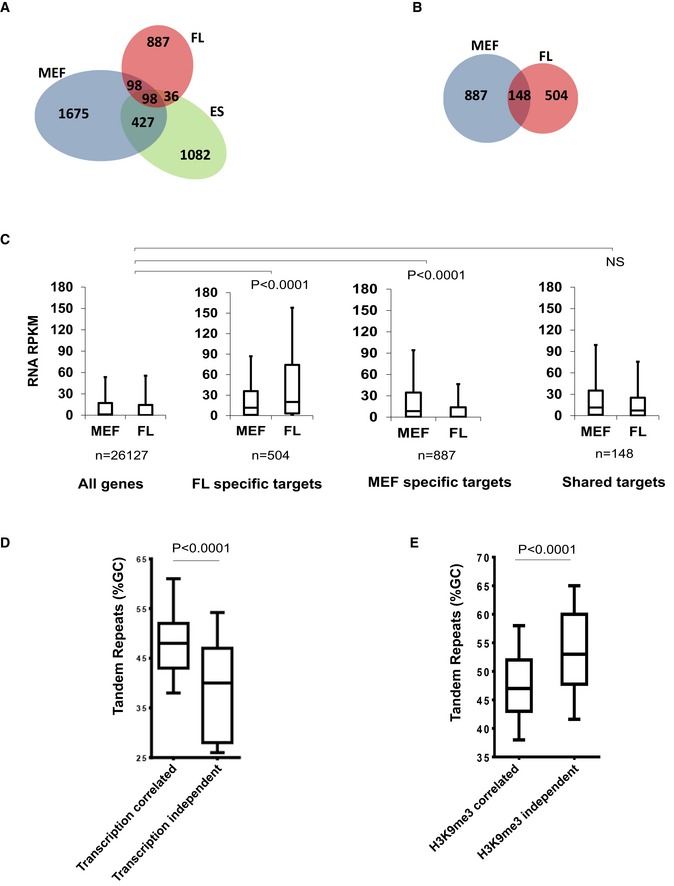
Overlap between ATRX binding sites in mouse embryonic stem cells (ES), embryonic fibroblasts (MEF) and erythroid foetal liver (FL) cells.
Overlap between ATRX binding sites at genes in isogenic MEF and FL cells.
Reads per kilobase of transcript per Million mapped reads (RPKM) of RNA‐seq data in MEF and FL cells at: all genes in the genome; genes which bind ATRX in FL cells but not MEFs; genes which bind ATRX in MEFs but not FL cells; genes which bind ATRX in both MEF and FL cells (shared targets). Boxes represent the 25th, median and 75th percentiles. Whiskers represent the 10th and 90th percentiles. Statistical significance was determined using a Mann–Whitney U‐test on the difference in expression between FL and MEFs (MEF‐FL) in each group compared to (MEF‐FL) values of all genes in the genome.
%GC content of tandem repeats underlying ATRX peaks which were transcription correlated or transcription independent in MEF and FL cells. Transcription‐independent ATRX TRs (n = 35) had average %GC content lower than transcription‐correlated (n = 169) ATRX TRs. Boxes represent the 25th, median and 75th percentile of %GC content. Statistical significance was assessed using a two‐tailed Mann–Whitney test.
%GC content of tandem repeats underlying ATRX peaks which were H3K9me3 correlated or H3K9me3 independent in MEF and ES cells. H3K9me3‐independent ATRX TRs (n = 83) had average %GC content higher than H3K9me3‐correlated (n = 622) ATRX TRs. Boxes represent the 25th, median and 75th percentile of %GC content. Statistical significance was assessed using a two‐tailed Mann–Whitney test (see also Table EV1).
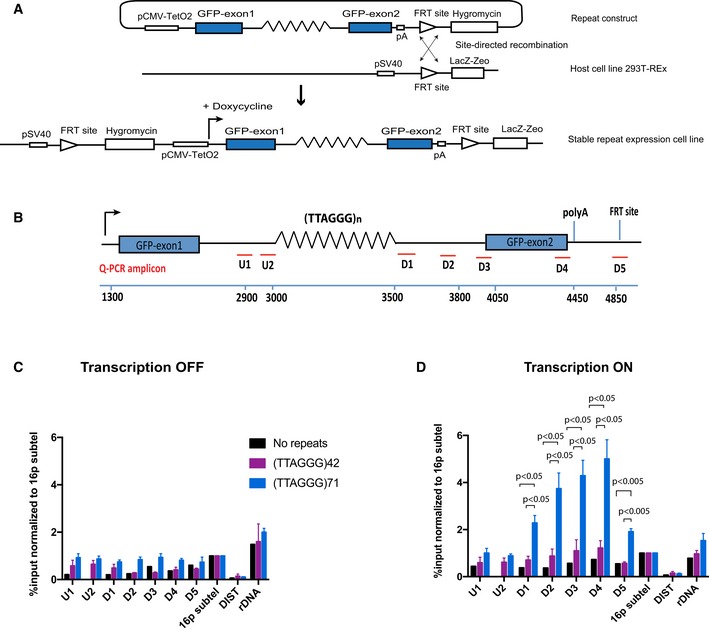
Diagram of the ectopic reporter gene GFP containing a G‐rich repeat, integrated into the genome of 293T‐Rex at a single FRT site by site‐directed recombination. The integration inactivates LacZ‐Zeo and activates hygromycin resistance, which allows selection of stable clones. The expression of the ectopic gene is regulated by a pCMV‐inducible promoter, which is activated by addition of doxycycline. The blue boxes are GFP exons; lines are introns; and zigzag lines are the G‐rich tandem repeat (see also Appendix Fig S1).
Diagram shows locations of the qPCR amplicons used to assess ATRX enrichment at the ectopic telomere repeat region. Numbers indicate distance to the start of the ectopic cassette. The diagram is not drawn to scale.
ATRX ChIP analysis in stable clones containing telomere repeats of indicated sizes and the control without the repeats when the ectopic gene is inactive (transcription off).
ATRX ChIP analysis in stable clones containing telomere repeats of indicated sizes (clones 5, 6 and 7 for (TTAGGG)71 construct and clones 5 and 6 for (TTAGGG)42 construct) and the control without the repeats (clone EV4 and N2S‐9) when the ectopic gene is activated (transcription on) upon addition of 1 μg/ml doxycycline for 24 h. The enrichment of ATRX is represented as % input normalised to that at 16p telomeric region (16ptel). DIST is a negative control, and ribosomal DNA (rDNA) is a positive control.
- A, B
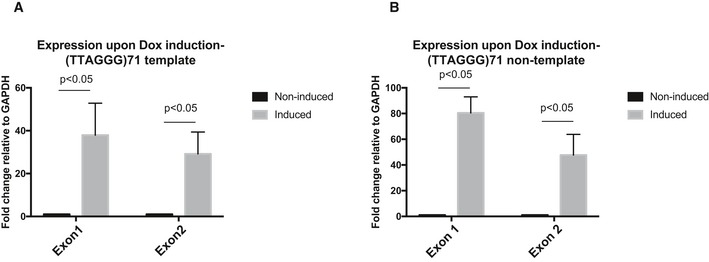
Reverse transcription quantitative PCR showing that both GFP exon 1 and exon 2 in (A) the (TTAGGG)71 clones with G‐rich strand the template and (B) the reverse orientation clones with G‐rich strand the non‐template are expressed upon transcription induction by doxycycline. Data are presented as fold change of expression relative to GAPDH. “No reverse transcriptase” (no RT) controls were included in each experiment. Data bars represent the mean of at least four biological repeats (± SEM). Statistical significance was determined using Student's t‐test.
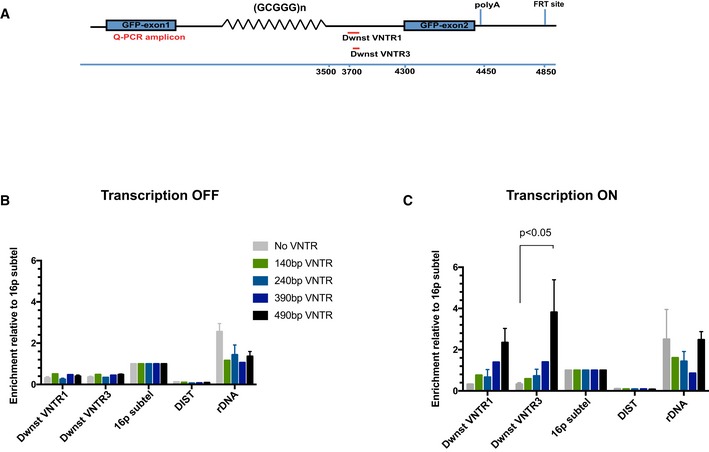
Diagram shows locations of the qPCR amplicons used to assess ATRX enrichment at the ectopic telomere repeat region. Numbers indicate distance to the start of the ectopic cassette.
ATRX ChIP analysis in stable clones containing ψζ VNTR of indicated sizes and the control without the VNTR when the ectopic gene is inactive (transcription off). The enrichment of ATRX is represented as % input normalised to that at 16p telomeric region (16ptel).
ATRX ChIP analysis in stable clones containing ψζ VNTR of indicated sizes when the ectopic gene is switched on (transcription on) by addition of 1 μg/ml doxycycline for 48 h. The enrichment of ATRX is represented as % input normalised to that at 16p telomeric region (16ptel).
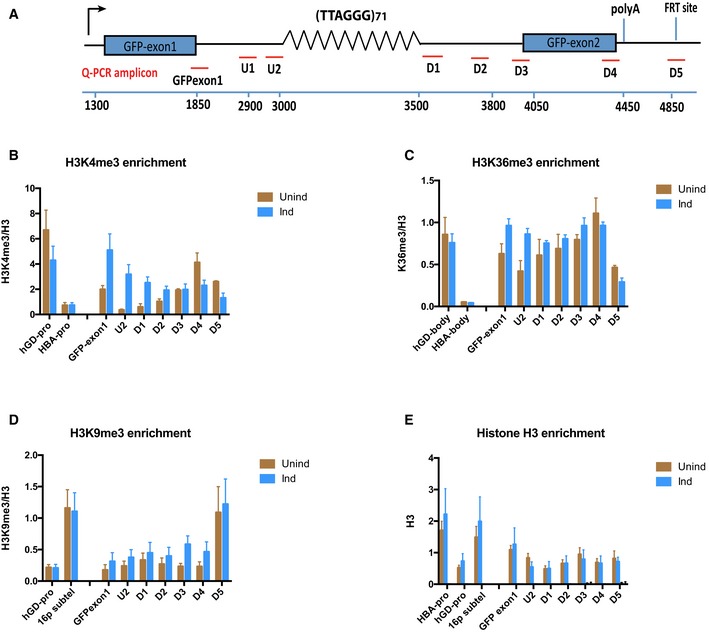
Diagram shows locations of the qPCR probes used to assess enrichment of relevant histone modifications at the ectopic telomere repeat region. Numbers indicate distance to the start of the ectopic cassette. The diagram is not drawn to scale.
H3K4me3 ChIP in (TTAGGG)71 clones when transcription is off (Unind) and on (Ind). GAPDH promoter (hGD‐pro) is a positive control, and HBA promoter (HBA‐pro) is a negative control. n = 3.
H3K36me3 ChIP in (TTAGGG)71 clones when transcription is off (Unind) and on (Ind). hGD‐body (a region in intron 1 of human GAPDH) is a positive control, and HBA body (a region in HBA gene) is a negative control. n = 3.
H3K9me3 ChIP in (TTAGGG)71 clones when transcription is off (Unind) and on (Ind). hGD‐pro is a negative control, and 16ptel is a positive control. n = 4.
Histone H3 ChIP in (TTAGGG)71 clones when transcription is off (Unind) and on (Ind) compared with and IgG antibody control. HBA‐pro and 16ptel are positive controls, and hGD‐pro is a negative control. n = 3.
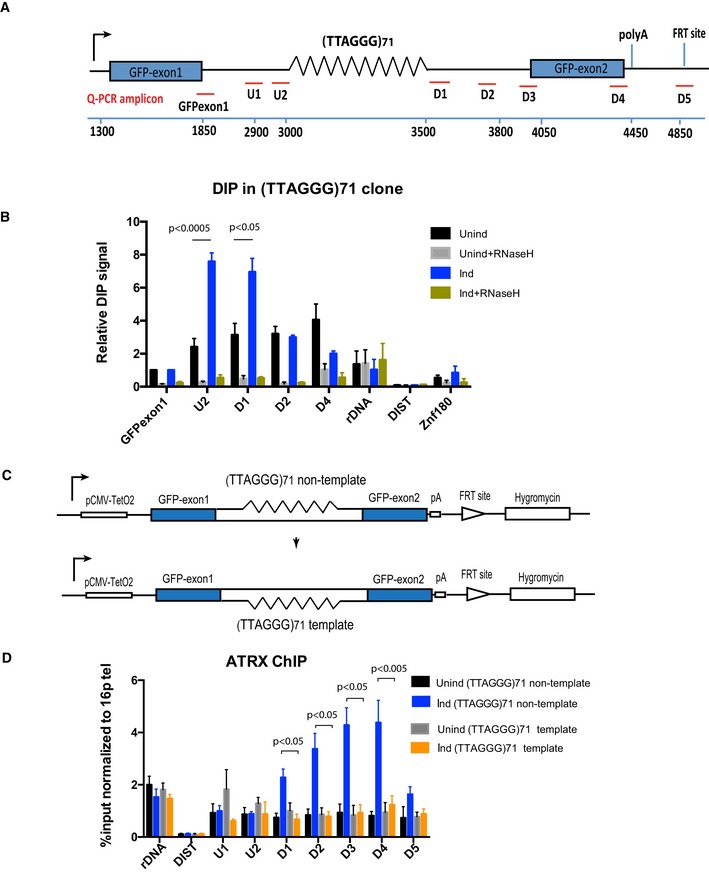
Diagram shows the ectopic locus and locations of the qPCR probes used to assess R‐loop signal and ATRX enrichment at the ectopic telomere repeat region.
DIP analysis in cells containing the (TTAGGG)71 ectopic repeat when transcription is off (Unind) and on (Ind). As a control, DIP samples were also treated with E. coli recombinant RNase H for 5 h at 37°C prior to immunoprecipitation with S9.6 antibody. Ribosomal DNA is a positive control, and DIST and Znf180 are negative controls. DIP signal is expressed as % input normalised to the non‐repetitive region of GFP exon 1. Data bars represent the average value from four independent experiments (± SEM) from three independent clones (5, 6 and 7) for the ectopic repeat (TTAGGG)71. Statistical significance was determined using Student's paired t‐test.
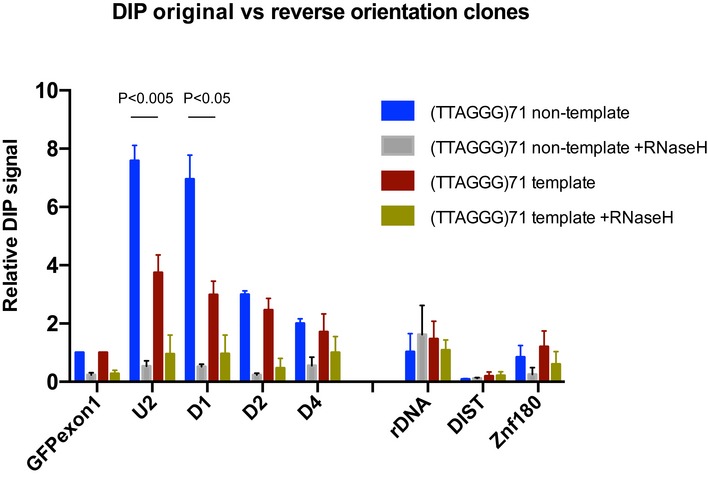
Diagram shows the inversion of the repeat region. The G‐rich strand in the original orientation construct is the non‐template strand, whereas it is the template strand in the reverse orientation construct.
ATRX ChIP analysis in the reverse orientation clone when transcription is inactive (Unind) and active (Ind) upon addition of 1 μg/ml doxycycline for 24 h. ATRX enrichment is presented as % input normalised to that of 16ptel region. Data bars are the average values of at least three independent experiments (± SEM) from two clones (3 and 4) of the reverse orientation and three clones (5, 6 and 7) of the original orientation. rDNA and DIST are a positive and negative control, respectively. Statistical significance was determined using Student's paired t‐test.
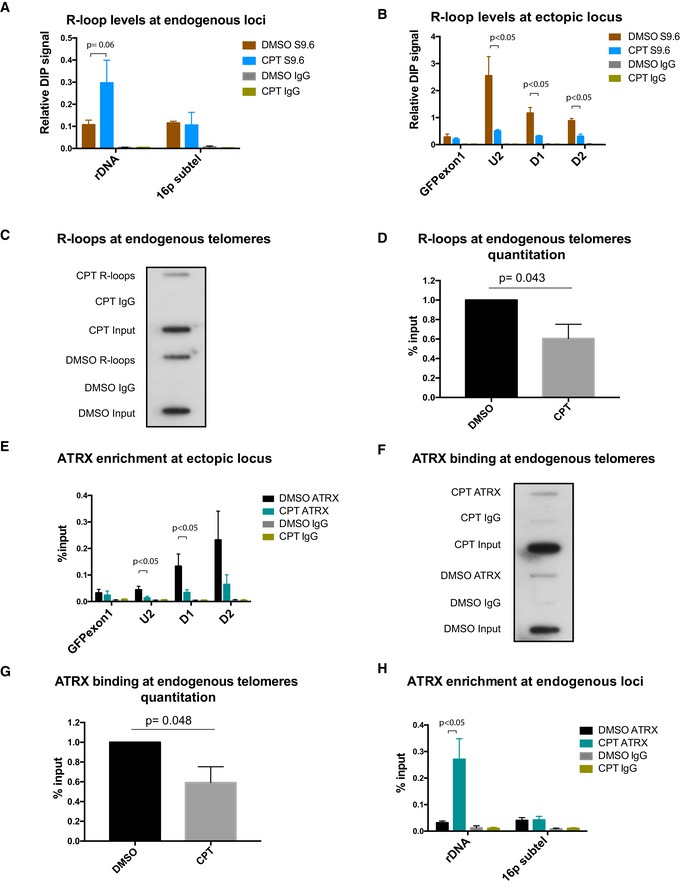
- A
DIP analysis at endogenous regions of ribosomal DNA and 16p subtel. n = 3.
- B
DIP analysis at the ectopic telomeric sequence (TTAGGG)71, treated with 10 μM camptothecin for 30 min or with solvent DMSO, following induction of transcription by 1 μg/ml doxycycline for 24 h. n = 3.
- C, D
Representative blot (C) showing a decrease in R‐loops at endogenous telomeres in the camptothecin (CPT)‐treated cells compared to the control DMSO‐treated cells. Immunoprecipitated DNA, using S9.6 antibody, was slot blotted and probed with telomeric probes. Quantification is shown in (D) for three biological replicates. R‐loop levels are expressed as % input.
- E
ATRX enrichment at the ectopic telomeric sequence (TTAGGG)71, in cells treated with 10 μM camptothecin for 30 min or with solvent DMSO control, following induction of transcription by 1 μg/ml doxycycline for 24 h. n = 3.
- F, G
Representative blot (F) showing a reduction in ATRX binding at endogenous telomeres in the CPT‐treated cells compared to the DMSO control. Immunoprecipitated DNA, using H300 antibody, was slot blotted and probed with telomeric probes. Quantitation is shown in (G) for three biological replicates. ATRX enrichment is normalised to input.
- H
ATRX ChIP analysis at endogenous regions of ribosomal DNA and 16p subtel. n = 3. Enrichment of R‐loops or ATRX is presented as % input.
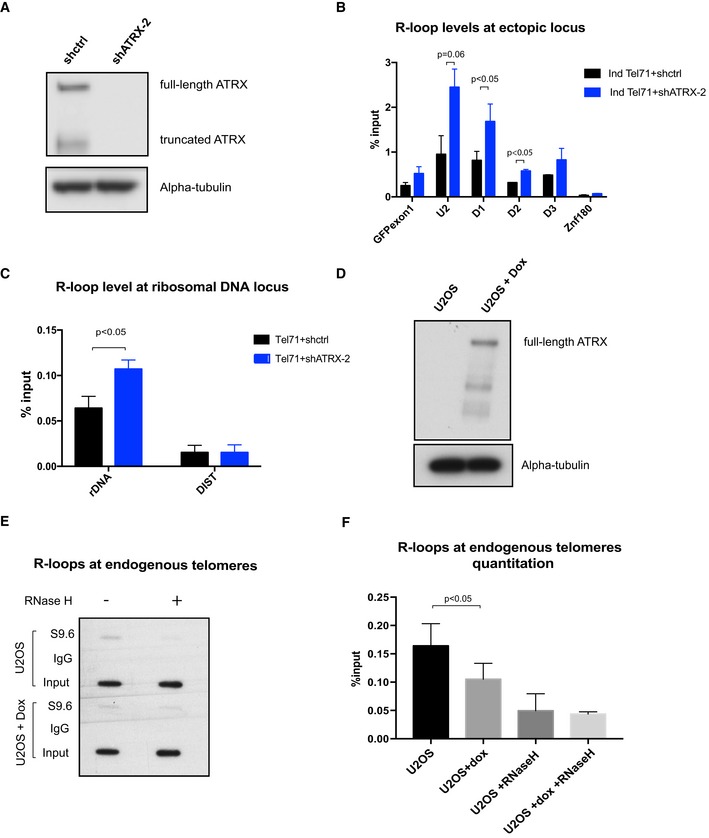
Western blot analysis of whole‐cell extract of cells containing the (TTAGGG)71 ectopic repeat treated with lentiviral shRNA against ATRX (shATRX‐2) or with shRNA control (shctrl). Western blot membrane was probed with anti‐ATRX and anti‐alpha‐tubulin antibody.
DIP analysis in cells containing the (TTAGGG)71 ectopic repeat treated with shRNA against ATRX or shRNA control, followed by transcription induction by addition of 1 μg/ml doxycycline for 24 h. The enrichment of R‐loops at the ectopic repeats was measured by qPCR. n = 3. Znf180 is a negative control.
DIP analysis showing increase in R‐loops at ribosomal DNA region in the ATRX knockdown cells. DIST is a negative control. n = 3 (see also Fig EV5).
Western blot analysis showing re‐expression of ATRX in U‐2 OS 22/3 cell line upon induction by doxycycline for 2 days.
R‐loops at endogenous telomeres in U‐2 OS 22/3 before and after 2 days of doxycycline‐induced ATRX re‐expression. DIP was performed with genomic DNA from these cell lines. As a control, the samples were treated with recombinant RNase H prior to the immunoprecipitation. Recovered DNA was slot blotted on a Zeta‐probe blotting membrane and then hybridised with 32P‐labelled telomeric oligos.
Quantitation of the S9.6 signal relative to the inputs in (E). n = 3.
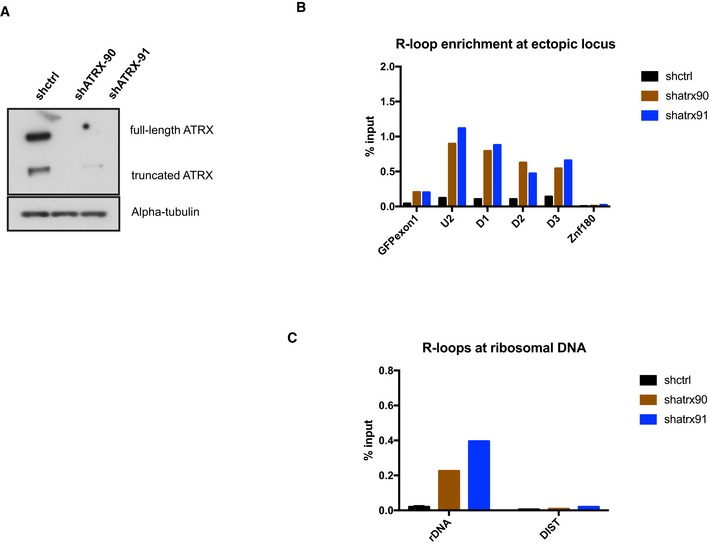
Western blot analysis of whole‐cell extract of cells with the ectopic telomeric sequence (TTAGGG)71 treated with lentiviral shRNAs against ATRX (shATRX‐90 and shATRX‐91) or with shRNA control. The Western blot membrane was probed with anti‐ATRX and anti‐alpha‐tubulin antibody.
DIP analysis in clones treated with shRNA against ATRX or shRNA control, followed by transcription induction by addition of 1 μg/ml doxycycline for 24 h.
DIP analysis showing an increase in R‐loops at ribosomal DNA region in the ATRX knockdown cells. DIST is a negative control.
References
-
- McDowell TL, Gibbons RJ, Sutherland H, O'Rourke DM, Bickmore WA, Pombo A, Turley H, Gatter K, Picketts DJ, Buckle VJ et al (1999) Localization of a putative transcriptional regulator (ATRX) at pericentromeric heterochromatin and the short arms of acrocentric chromosomes. Proc Natl Acad Sci USA 96: 13983–13988 - PMC - PubMed
-
- Gibbons RJ, McDowell TL, Raman S, O'Rourke DM, Garrick D, Ayyub H, Higgs DR (2000) Mutations in ATRX, encoding a SWI/SNF‐like protein, cause diverse changes in the pattern of DNA methylation. Nat Genet 24: 368–371 - PubMed
-
- Law MJ, Lower KM, Voon HP, Hughes JR, Garrick D, Viprakasit V, Mitson M, De Gobbi M, Marra M, Morris A et al (2010) ATR‐X syndrome protein targets tandem repeats and influences allele‐specific expression in a size‐dependent manner. Cell 143: 367–378 - PubMed
Publication types
MeSH terms
Substances
Grants and funding
LinkOut - more resources
Full Text Sources
Other Literature Sources
Molecular Biology Databases
