. 2017 Aug;23(8):1270-1284.
doi: 10.1261/rna.061499.117. Epub 2017 May 9.

NF45 and NF90/NF110 coordinately regulate ESC pluripotency and differentiation

Affiliations

NF45 and NF90/NF110 coordinately regulate ESC pluripotency and differentiation

Julia Ye et al. RNA. 2017 Aug.

Abstract

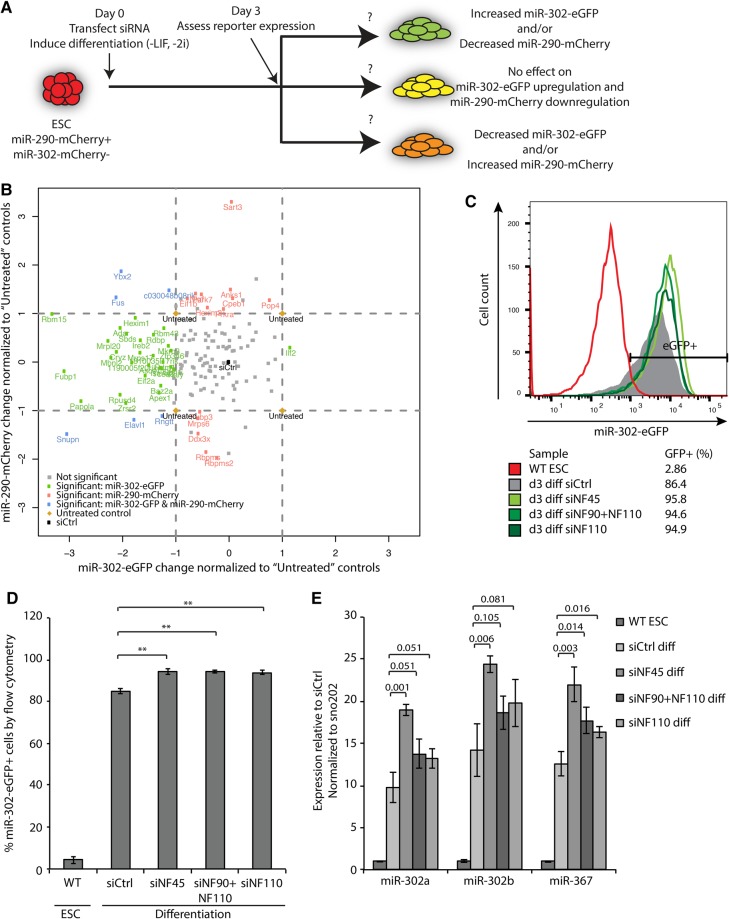
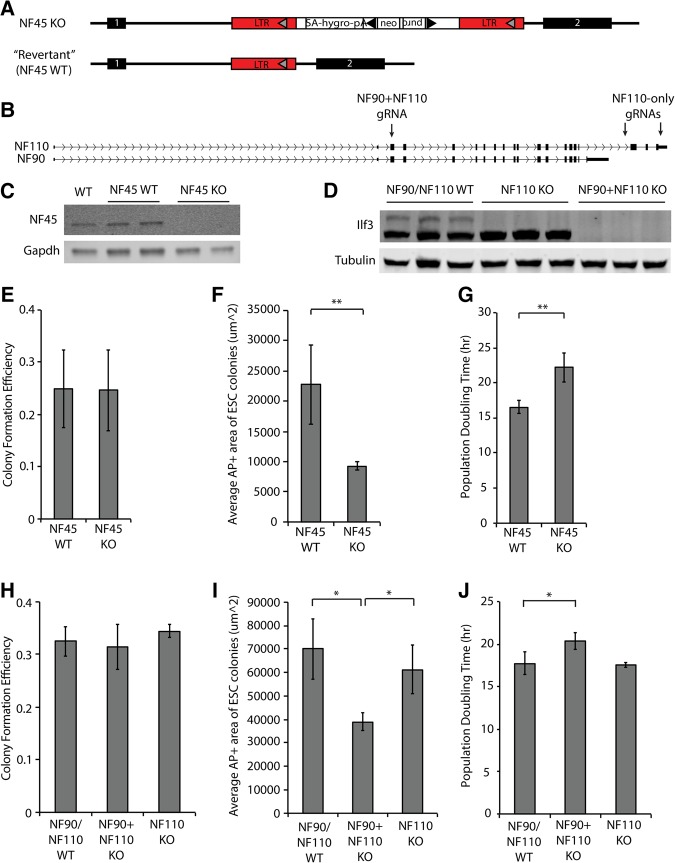
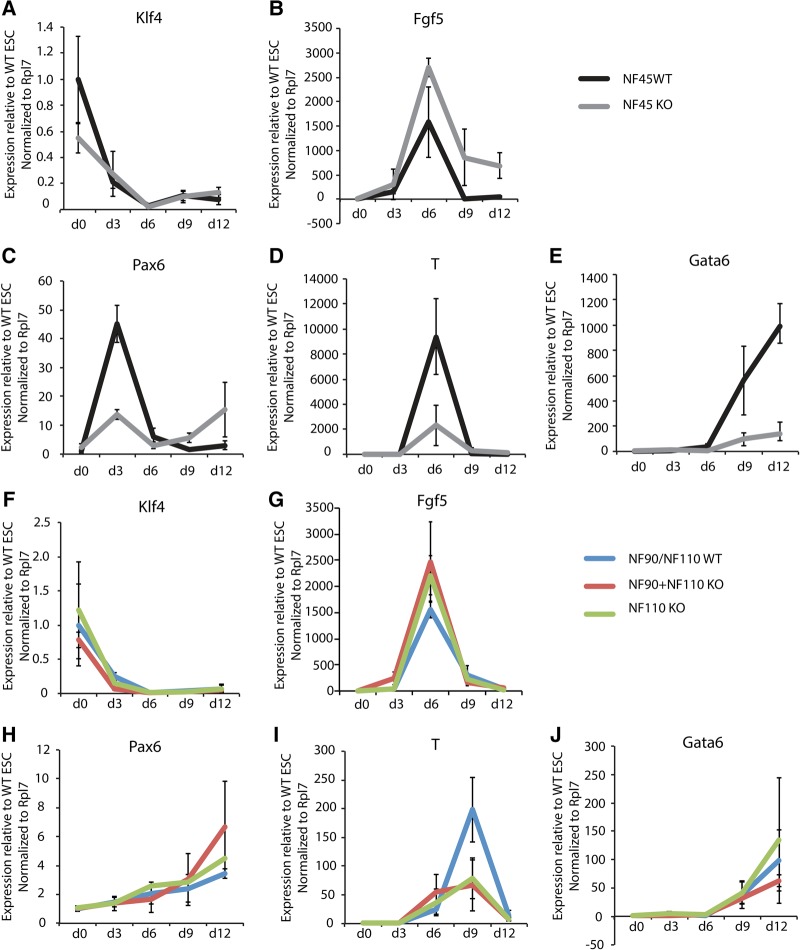
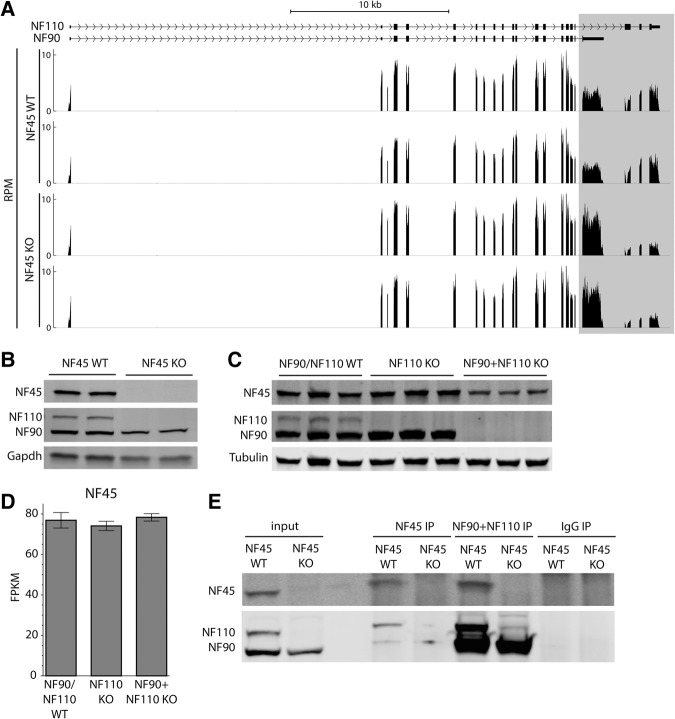
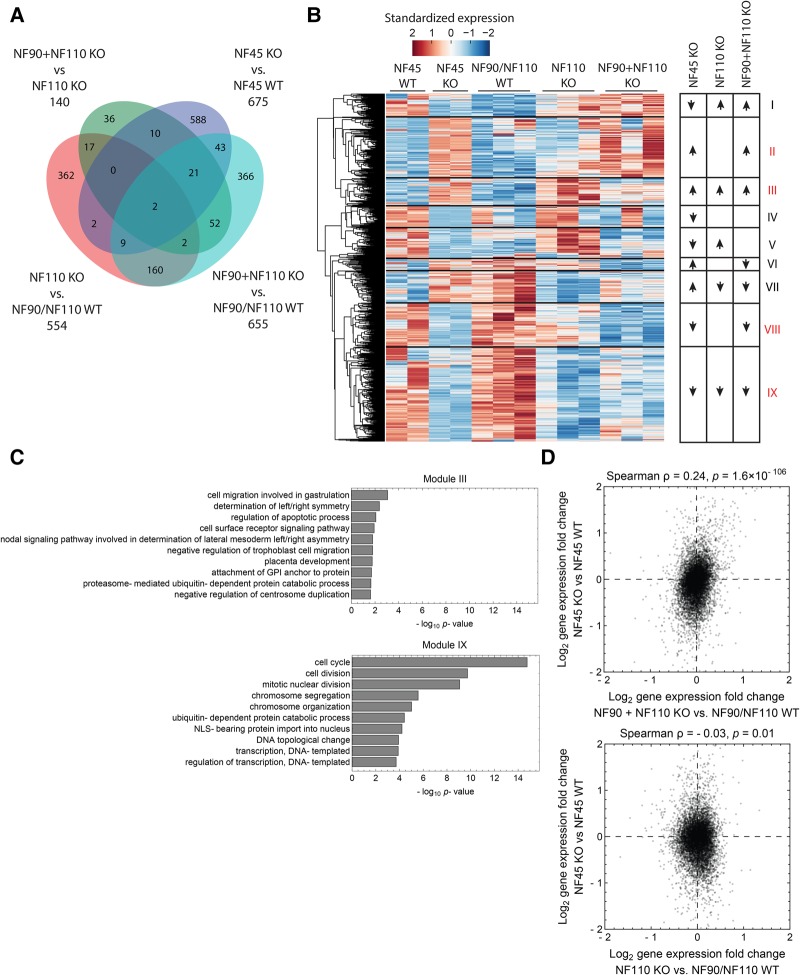
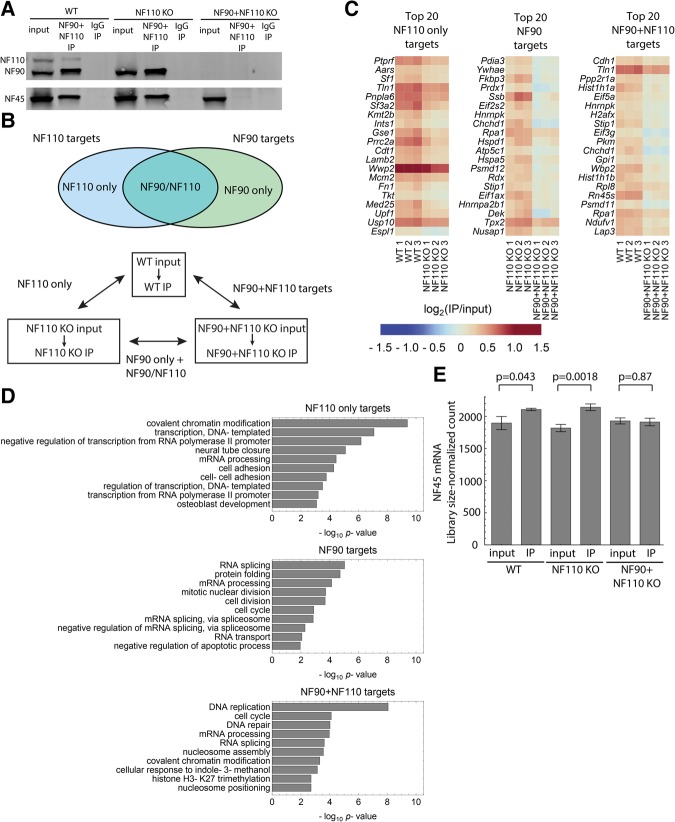
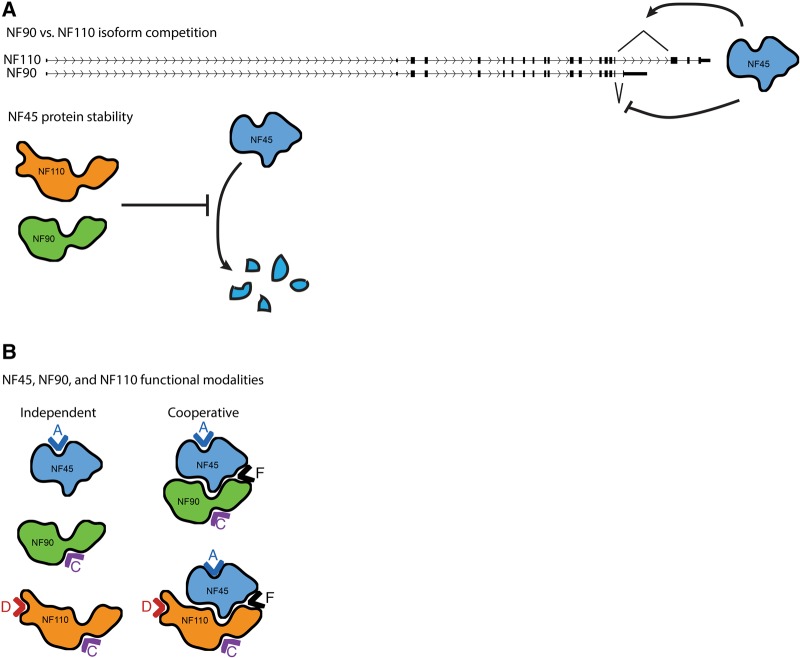
While years of investigation have elucidated many aspects of embryonic stem cell (ESC) regulation, the contributions of post-transcriptional and translational mechanisms to the pluripotency network remain largely unexplored. In particular, little is known in ESCs about the function of RNA binding proteins (RBPs), the protein agents of post-transcriptional regulation. We performed an unbiased RNAi screen of RBPs in an ESC differentiation assay and identified two related genes, NF45 (Ilf2) and NF90/NF110 (Ilf3), whose knockdown promoted differentiation to an epiblast-like state. Characterization of NF45 KO, NF90 + NF110 KO, and NF110 KO ESCs showed that loss of NF45 or NF90 + NF110 impaired ESC proliferation and led to dysregulated differentiation down embryonic lineages. Additionally, we found that NF45 and NF90/NF110 physically interact and influence the expression of each other at different levels of regulation. Globally across the transcriptome, NF45 KO ESCs and NF90 + NF110 KO ESCs show similar expression changes. Moreover, NF90 + NF110 RNA immunoprecipitation (RIP)-seq in ESCs suggested that NF90/NF110 directly regulate proliferation, differentiation, and RNA-processing genes. Our data support a model in which NF45, NF90, and NF110 operate in feedback loops that enable them, through both overlapping and independent targets, to help balance the push and pull of pluripotency and differentiation cues.

Keywords: NF45; NF90/NF110; RNA-binding protein; pluripotency; post-transcriptional regulation.


Figures

FIGURE 1.
FIGURE 1.
An siRNA screen identifies NF45, NF90, and NF110 as promoters of pluripotency. (A) Schematic of siRNA screen design. (B) Scatterplot of siRNA screen hits with normalized t-statistics for miR-302-eGFP and miR-290-mCherry on the x and y axes, respectively. Coloring denotes genes whose knockdown significantly affected levels of miR-302-eGFP, miR-290-mCherry, or both (q < 0.001) after first z-score normalizing from a center of zero as defined by siCtrl-treated samples and then scaling by the t-statistic of the untreated samples. Genes whose knockdown negatively affected cell proliferation and viability (n = 210) were removed from this analysis. Note that some genes with large t-statistics are not called significant due to cutoffs described in the Supplemental Methods. (C) Flow cytometry of miR-302-eGFP expression of ESCs and ESCs differentiated for 3 d in the presence of control siRNA (siCtrl) or siRNAs against Ilf2/NF45 (siNF45), NF90 + NF110 (siNF90 + NF110), or NF110 only (siNF110). (D) Quantification of miR-302-eGFP+ cells from (C). (E) Transcript levels by qRT-PCR of mature miR-302 miRNAs in ESCs treated with the indicated siRNAs and differentiated for 3 d. Error bars represent SD of three biological replicates. (**) P < 0.005. Numbers above the graph in E indicate the P-values of the comparisons marked.
FIGURE 2.
FIGURE 2.
NF45 and NF90 promote ESC proliferation. (A) Schematic showing design of NF45 gene-trap allele. The gene trap construct is located in the intron between exons 1 and 2 of NF45. Transient expression of a Flippase results in removal of the construct in “revertant” cells, which we used as NF45 WT controls. (B) Schematic showing location of gRNAs for generating NF90 + NF110 and NF110 only KO ESCs by CRISPR. Details on CRISPR mutagenesis are in the Supplemental Methods. (C) Western blot showing protein expression of WT (dual reporter ESCs), NF45 WT, and NF45 KO ESCs. (D) Western blot showing protein expression in NF90 + NF110 WT, NF110 KO, and NF90 + NF110 KO ESCs. (E) Colony formation efficiency, (F) area of alkaline phosphatase staining per colony, and (G) population doubling time of NF45 WT and NF45 KO ESCs. (H) Colony formation efficiency, (I) area of alkaline phosphatase staining per colony, and (J) population doubling time of NF90/NF110 WT, NF90 + NF110 KO, and NF110 KO ESCs. Error bars represent SD of 3–4 biological replicates. (*) P < 0.05, (**) P < 0.005.
FIGURE 3.
FIGURE 3.
Loss of NF45 and NF90/NF110 dysregulate differentiation down embryonic lineages. Transcript levels by qRT-PCR of (A,F) Klf4, (B,G) Fgf5, (C,H) Pax6, (D,I) T/Brachyury, and (E,J) Gata6 in NF45 WT, NF45 KO, NF90/NF110 WT, NF90 + NF110 KO, and NF110 KO ESCs (d0) and EBs (d3-d12). Error bars represent SD of 3–4 biological replicates.
FIGURE 4.
FIGURE 4.
NF45 and NF90/NF110 physically interact and influence the expression of each other at different levels of regulation. (A) Read coverage in RPM (reads per million mapped reads) of NF90/NF110 transcript in NF45 WT and NF45 KO ESCs. Differences between the NF90 and NF110 isoforms are highlighted. (B,C) Western blots showing NF45, NF90, and NF110 protein expression levels in the KO ESC lines indicated. (D) Mean FPKM (fragments per kilobase of transcript per million mapped reads) of NF45 transcript in NF90/NF110 WT, NF110 KO, and NF90 + NF110 KO ESCs. Error bars indicate standard error of the mean. (E) Western blots showing co-IP interactions between NF45 and NF90/NF110. Input lanes show 2% input.
FIGURE 5.
FIGURE 5.
Global expression analysis is consistent with functional interactions among NF45, NF90, and NF110. (A) Venn diagram of differentially expressed genes in RNA-seq analysis of NF45 WT, NF45 KO, NF90 + NF110 WT, NF90 + NF110 KO, and NF110 KO ESCs. (B) Heat map of robustly expressed genes that are differentially expressed in at least one comparison considered in A. Genes are categorized through unsupervised clustering into nine modules indicating their pattern of expression in the different lines (Materials and Methods). (C) GO analysis of category III and IX genes as defined in B. (D) Correlation analysis of NF45 KO/NF45 WT versus NF110 KO/NF90 + NF110 WT or NF90 + NF110 KO/NF90 + NF110 WT transcriptomes at the gene level.
FIGURE 6.
FIGURE 6.
Identification of NF90/NF110 RNA targets. (A) Representative RIP–Western blot showing immunoprecipitation of NF90, NF110, and NF45 in NF90/NF110 WT, NF110 KO, and NF90 + NF110 KO ESCs. (B) Identification of NF90, NF110, and NF90 + NF110 RNA binding proteins in ESCs by RIP-seq. Top panel defines NF110 and NF90 targets. Bottom panel defines the comparisons used to call RNA targets. (C) Heatmap of log2(IP/input) RIP-seq expression values of top 20 NF90, NF110 only, and NF90 + NF110 RNA targets as identified by a combination of the Poisson ratio test and the log ratio test (Supplemental Methods). (D) GO analysis of identified NF90, NF110 only, and NF90 + NF110 targets. (E) Mean library-size normalized read count (as calculated by DESeq2) of NF45 in the RIP-seq libraries. Error bar indicates standard error of the mean.
FIGURE 7.
FIGURE 7.
Models of NF45, NF90, and NF110 regulation and function. (A) NF45, NF90, and NF110 expression levels are controlled through a homeostatic regulatory loop. NF45 causes an alternative splicing-driven isoform competition between NF90 and NF110, and NF90 (and possibly NF110) promote NF45 protein stability. (B) NF45, NF90, and NF110 can operate either independently or co-operatively. Carets indicate different functional modes: Modes A, C, and D represent regulatory groups of NF45, NF90 or NF110, and NF110, respectively; Mode F represent regulatory groups of NF45–NF90 or NF45–NF110 complexes (see main text and Supplemental Methods).

Similar articles

Cited by

References

    1. Anders S, Pyl PT, Huber W. 2014. HTSeq—a Python framework to work with high-throughput sequencing data. Bioinformatics 31: 166–169. - PMC - PubMed
    1. Baltz AG, Munschauer M, Schwanhausser B, Vasile A, Murakawa Y, Schueler M, Youngs N, Penfold-Brown D, Drew K, Milek M, et al. 2012. The mRNA-bound proteome and its global occupancy profile on protein-coding transcripts. Mol Cell 46: 674–690. - PubMed
    1. Boroviak T, Loos R, Bertone P, Smith A, Nichols J. 2014. The ability of inner-cell-mass cells to self-renew as embryonic stem cells is acquired following epiblast specification. Nat Cell Biol 16: 516–528. - PMC - PubMed
    1. Bulut-Karslioglu A, Biechele S, Jin H, Macrae TA, Hejna M, Gertsenstein M, Song JS, Ramalho-Santos M. 2016. Inhibition of mTOR induces a paused pluripotent state. Nature 540: 119–123. - PMC - PubMed
    1. Castello A, Fischer B, Eichelbaum K, Horos R, Beckmann BM, Strein C, Davey NE, Humphreys DT, Preiss T, Steinmetz LM, et al. 2012. Insights into RNA biology from an atlas of mammalian mRNA-binding proteins. Cell 149: 1393–1406. - PubMed

Publication types

MeSH terms