. 2017 Jul 15;77(14):3931-3941.
doi: 10.1158/0008-5472.CAN-17-0299. Epub 2017 May 9.

Noninvasive Interrogation of DLL3 Expression in Metastatic Small Cell Lung Cancer

Affiliations

Noninvasive Interrogation of DLL3 Expression in Metastatic Small Cell Lung Cancer

Sai Kiran Sharma et al. Cancer Res. .

Abstract

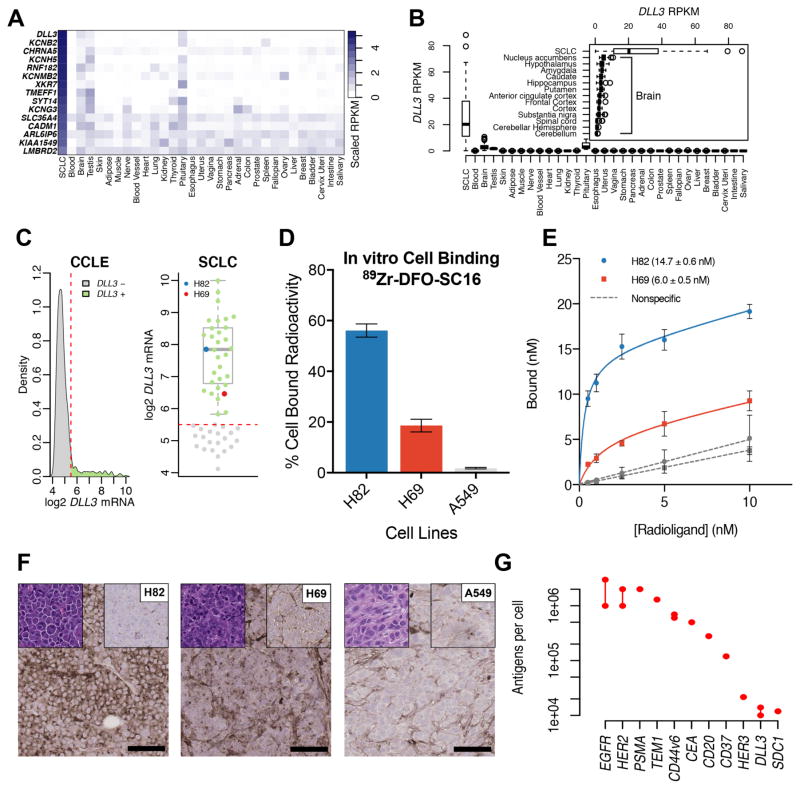
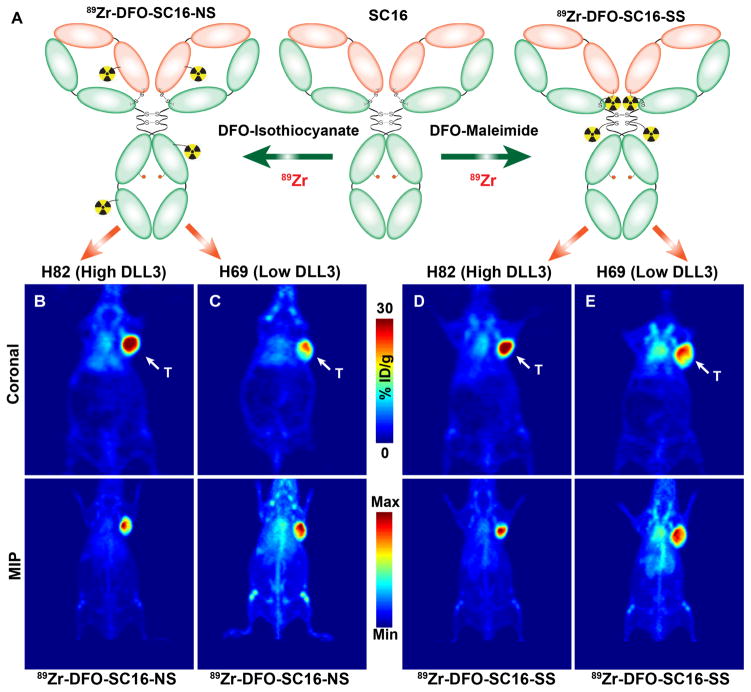
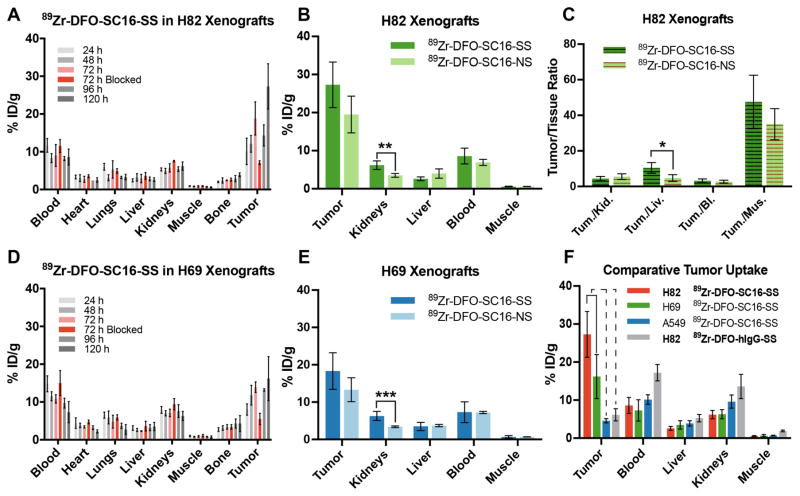
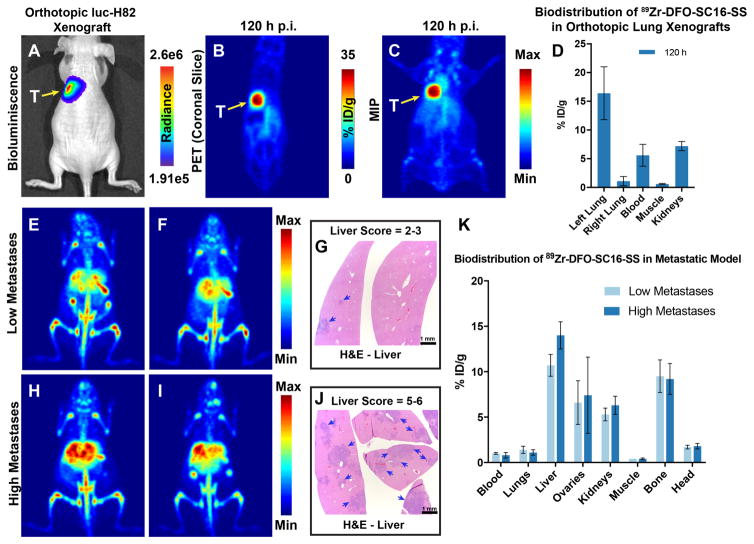
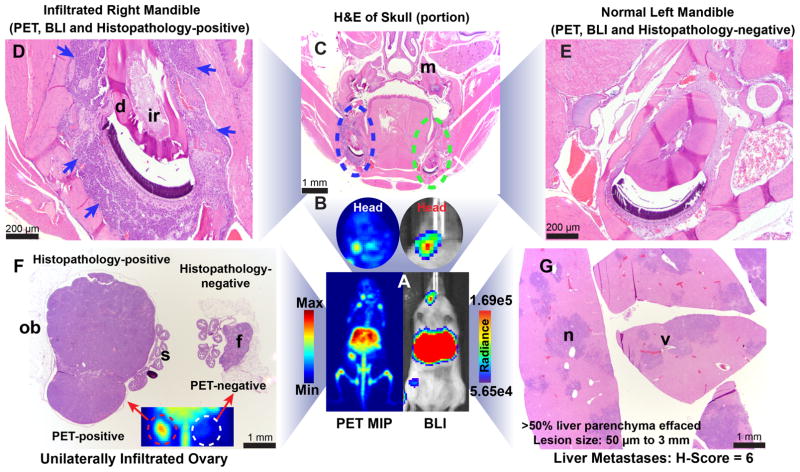
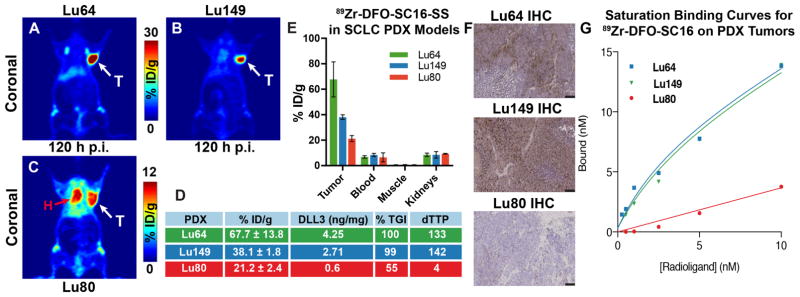
The Notch ligand DLL3 has emerged as a novel therapeutic target expressed in small cell lung cancer (SCLC) and high-grade neuroendocrine carcinomas. Rovalpituzumab teserine (Rova-T; SC16LD6.5) is a first-in-class DLL3-targeted antibody-drug conjugate with encouraging initial safety and efficacy profiles in SCLC in the clinic. Here we demonstrate that tumor expression of DLL3, although orders of magnitude lower in surface protein expression than typical oncology targets of immunoPET, can serve as an imaging biomarker for SCLC. We developed 89Zr-labeled SC16 antibody as a companion diagnostic agent to facilitate selection of patients for treatment with Rova-T based on a noninvasive interrogation of the in vivo status of DLL3 expression using PET imaging. Despite low cell-surface abundance of DLL3, immunoPET imaging with 89Zr-labeled SC16 antibody enabled delineation of subcutaneous and orthotopic SCLC tumor xenografts as well as distant organ metastases with high sensitivity. Uptake of the radiotracer in tumors was concordant with levels of DLL3 expression and, most notably, DLL3 immunoPET yielded rank-order correlation for response to SC16LD6.5 therapy in SCLC patient-derived xenograft models. Cancer Res; 77(14); 3931-41. ©2017 AACR.


Figures

Figure 1
Figure 1. DLL3 is a unique low-abundance cell surface target expressed in small cell lung cancer
(A) A heat map comparing the median RPKM of cell surface proteins elevated in small cell lung cancer (SCLC) to the median RPKM in normal adult tissues. DLL3 has abundant expression in SCLC and minimal expression in normal tissues with the exception of the pituitary gland, brain and testis; (B) A box plot comparing the median RPKM of DLL3 in SCLC versus normal adult tissues. The inset compares the median expression of DLL3 in SCLC with different tissues of the adult brain, showing maximum expression in the nucleus accumbens; (C) A density plot representing the gene expression data mined for DLL3 expression in cell lines from the Cancer Cell Line Encyclopedia (CCLE). The kernel density on the y-axis represents the cell lines that express DLL3 in levels corresponding to values shown on the x-axis (left); A representation of the density plot after selection for SCLC cells alone (right). Two cell lines – H82 (representing the median of DLL3 expression) and H69 (low DLL3 expression < 25th percentile) were selected for the development of in vitro and in vivo experimental models described in this study; (D) A graph representing the differential in vitro binding of 89Zr-DFO-SC16-NS to H82, H69 and A549 cells, showing cell bound radioactivity (y-axis) in concordance with the level of DLL3 expression in the cell lines; (E) A plot of the saturation binding curves derived from the ex vivo binding of 89Zr-DFO-SC16-NS to sections of H82 and H69 tumor tissue harvested from subcutaneous xenografts in mice. The curves yielded Bmax (maximum number of DLL3 target binding sites for SC16 antibody) on the tumors; (F) Immunohistochemistry on subcutaneous tumor xenografts. H82 showed high DLL3 expression ~ 95% of tumor, H69 showed low DLL3 expression ~ 45% of tumor and A549 showed no DLL3 expression. Left top corner inset: H&E, Right top corner inset: isotype control, Right low corner: scale bar for 100μm (G) A dot plot comparing the average level of expression (protein per cell) of DLL3 with other tumor-associated molecular targets/antigens that have been used for the immunoPET imaging of various cancers.
Figure 2
Figure 2. PET Imaging of small cell lung cancer in subcutaneous xenograft models
(A) A schematic showing the biochemical modification of the DLL3-targeted SC16 antibody with desferrioxamine (DFO) via non-site-selective conjugation (left) at randomly distributed lysine residues within the antibody to yield 89Zr-DFO-SC16-NS; and via site-selective conjugation (right) at unpaired cysteine residues within the hinge region of a reduced form of the antibody to yield 89Zr-DFO-SC16-SS. Representative whole body PET images – coronal slices (upper panel), Maximum Intensity Projections – MIP (lower panel) delineating the tumors via uptake of (B) 89Zr-DFO-SC16-NS in H82 xenograft; (C) 89Zr-DFO-SC16-NS in H69 xenograft; (D) 89Zr-DFO-SC16-SS in H82 xenograft; and (E) 89Zr-DFO-SC16-SS in H69 xenograft; T = tumor. The PET scans were performed at 120 h after the administration of the 89Zr-labeled radioimmunoconjugates [9.25 – 11.1 MBq; (250 – 300 μCi), 31–38 μg in chelex-treated PBS] via lateral tail vein injections. Serial PET images (24 h – 120 h) for these animals are shown in Figs. S6–S9.
Figure 3
Figure 3. Biodistribution of 89Zr-DFO-SC16 radioimmunoconjugates in subcutaneous xenograft models of SCLC
(A) Biodistribution data from H82 xenograft bearing mice (n = 4 per time point) after the administration of 89Zr-DFO-SC16-SS via lateral tail vein injection [0.74–0.925 MBq; (20–25 μCi), 2.5–3 μg in 200 μL chelex-treated PBS]. The tumoral uptake of 89Zr-DFO-SC16-SS could be blocked at 72 h by the co-injection of a 100-fold excess of the unlabeled SC16 antibody; (B) A graph comparing the uptake of the site-selectively labeled radioimmunoconjugate (89Zr-DFO-SC16-SS) and its non-site-selectively labeled cousin (89Zr-DFO-SC16-NS) at 120 h after the injection of the radioimmunoconjugates in H82 xenograft bearing mice. A higher concentration of radioactivity was found in the kidneys of xenografts injected with 89Zr-DFO-SC16-SS (** indicates adjusted p-value = 0.02). %ID/g values are shown in tables S1 and S3; (C) A comparative plot of the tumor-to-background tissue ratios derived from the uptake of 89Zr-DFO-SC16-SS and 89Zr-DFO-SC16-NS in H82 xenograft bearing mice. Marginally higher tumor-to-background activity concentration ratios were found for 89Zr-DFO-SC16-SS in the liver (* indicates adjusted p-value = 0.076); (D) Biodistribution data from H69 xenograft bearing mice (n = 4 per time point) after the administration of 89Zr-DFO-SC16-NS via lateral tail vein injection [0.81–1.1 MBq; (22–30 μCi), 2.75–3.75 μg in 200 μL chelex-treated PBS). The tumoral uptake of 89Zr-DFO-SC16-NS could be blocked at 72 h by the co-injection of a 100-fold excess of the unlabeled SC16 antibody; (E) A graph comparing the uptake of 89Zr-DFO-SC16-SS and 89Zr-DFO-SC16-NS at 120 h after the injection of the radioimmunoconjugates in H69 xenograft bearing mice. A higher concentration of radioactivity was found in the kidneys (*** indicates adjusted p value = 0.015) of xenografts injected with 89Zr-DFO-SC16-SS. %ID/g values are shown in tables S2 and S4; (F) A summarized comparison of the uptake of 89Zr-DFO-SC16-SS in subcutaneously xenografted DLL3-positive H82 and H69 tumors versus DLL3-negative A549 tumors. The tumoral uptake of 89Zr-DFO-SC16-SS was concordant with the level of DLL3 expression in the three tumors. The uptake of the 89Zr-DFO-SC16-SS in A549 tumors compared well with the uptake of an isotype-matched anti-hapten radioimmunoconjugate in DLL3-posiitve H82 tumors.
Figure 4
Figure 4. DLL3 PET imaging in orthotopic and metastatic models of SCLC
(A) Bioluminescence image of an athymic nude mouse bearing a luc-H82 tumor xenografted orthotopically in the left lung (yellow arrow). Radiance = photons/sec/cm2/steradian; (B–C) PET images (coronal slice and MIP) of 89Zr-DFO-SC16-SS delineating the orthotopically xenografted tumor (seen via bioluminescence in A). (D) Biodistribution of 89Zr-DFO-SC16-SS in athymic nude mice bearing orthotopic xenografts of luc-H82 tumors in the left lung. A highly selective uptake was observed in the left lungs of mice, with some concentration of radioactivity found in the blood and kidneys as seen in the PET images; (E–F) PET images (MIPs) of 2 representative mice 136 h after the injection of 89Zr-DFO-SC16-SS [7.4 MBq; (200 μCi) in 200 μL chelex-treated PBS] via the lateral tail vein. 9/16 mice in the metastatic cohort showed this pattern of low intensity focal PET signals in the liver; (G) H&E-stained sections of the liver lobes from mouse shown in A. Presence of small metastatic nodules (50 μm – 1 mm) (blue arrows) were seen with up to 30 % of the liver parenchyma being effaced. Mice with similar results from DLL3 PET imaging with 89Zr-DFO-SC16-SS and histopathology of livers were assigned a semi-quantitative score of 2–3 and classified as having low metastatic burden. (H–I) PET images (MIPs) of 2 representative mice 136 h after the injection of 89Zr-DFO-SC16-SS [7.4 MBq; (200 μCi) in 200 μL chelex-treated PBS] via the lateral tail vein. 7/16 mice in the metastatic cohort showed this pattern of high intensity focal PET signals in the liver; (J) H&E-stained sections of the liver from mouse shown in H. Presence of multiple small to large coalescing metastatic nodules (50 μm – 3 mm) (blue arrows) were seen with > 50 % of the liver parenchyma being effaced by neoplastic cells. Mice with similar results from DLL3 PET imaging with 89Zr-DFO-SC16-SS and histopathology of livers were assigned a semi-quantitative score of 5–6 and classified as having high metastatic burden; (K) Biodistribution data from the cohort of 16 mice analyzed for metastases via DLL3 PET. The concentration of radioactivity in the livers correlated well with the tumor burden found in these tissues.
Figure 5
Figure 5. Concordance between DLL3 PET imaging and histopathology in a metastatic model of SCLC
(A) A side-by-side ventral view of the PET and BLI (bioluminescence) images of a representative mouse showing concordance of signals obtained from the liver and head of the mouse; (B) A magnified view of the head region from the PET and BLI images of the mouse showing signals localized around the right mandible of the mouse; (C) A coronal overview of an H&E-stained section of the decalcified skull showing infiltration of the right mandible at the level of the molars (m). Even at low magnification, the localization of neoplastic cells within the right hemimandible (blue dashed ellipse) is evident and consistent with the signals observed in the PET image and focally high luminescence observed in the BLI image; (D) A magnified view of the right mandible. The blue arrows point to the neoplastic cells that infiltrated and replaced most of the alveolar bone around the incisors root (ir). The dentin (d) of the tooth was intact; (E) A magnified view of the left hemimandible, which was devoid of neoplastic cells, confirming the lack of signal in the PET scan and BLI image; (F) An H&E-stained section of the two ovaries of the mouse shown in A. The ovary on the left of the image is massively enlarged due to metastatic invasion by the tumor cells. However, the salpinx (s) and the ovarian bursa (ob) were spared from neoplastic infiltration. The contralateral ovary appeared normal in size and showed the presence of immature follicles (f), which were visible within the organ. The inset shows a portion of the lower abdomen from the PET image, wherein the unilateral PET-positive ovary is seen corresponding to the histopathological findings; (G) H&E-stained sections of the liver from the mouse shown in A. Multiple coalescing neoplastic nodules (n) were found within the liver lobes and tend to replace more than 50% of the liver parenchyma. The multifocal and coalescing pattern of the nodules appear as multiple high intensity signals in the PET MIP. The perivascular localization (v) of metastases was a consistent finding in H&E-stained sections of all the liver tissues examined from animals in the metastatic cohort.
Figure 6
Figure 6. Rank order correlation of DLL3 PET for response to therapy with SC16LD6.5 in flank PDX models of SCLC
PET images of 89Zr-DFO-SC16-SS in athymic nude mice bearing PDX – (A) Lu64 (high DLL3 expression); (B) Lu149 (medium DLL3 expression); and (C) Lu80 (low DLL3 expression). White arrows (A–C) point to the subcutaneously xenografted PDX tumors seen in the PET images. Red arrow (C) points to the heart and is indicative of radioactivity persisting within systemic circulation, due to the lack of a target sink in the Lu80 tumors; (D) A tabulated representation of the concordance between the uptake of 89Zr-DFO-SC16-SS in the three PDX lines with their levels of DLL3 expression, and parameters to indicate response to therapy – %TGI (percentage tumor growth inhibition upon treatment with the antibody drug conjugate – SC16LD6.5) and dTTP (delta time to progression) for the PDX tumors after treatment with SC16LD6.5; (E) Biodistribution of 89Zr-DFO-SC16-SS in select tissues examined from the PDX tumor bearing mice (n=4 per PDX line); (F) Immunohistochemistry on PDX tumors for DLL3 expression. Lu64 showed high DLL3 expression, Lu149 showed medium DLL3 expression and Lu80 showed minimal DLL3 expression. Right low corner: scale bar for 100μm. (G) A plot of the saturation binding curves derived from the ex vivo binding of 89Zr-DFO-SC16-NS to sections of Lu64, Lu149 and Lu80 tumor tissue harvested from subcutaneous xenografts in mice. The curves enabled the estimation of the maximum number of DLL3 target binding sites on the PDX tumors. Lu64 had ~9400 binding sites and Lu149 had 8600 binding sites. Lu80 had negligible DLL3 expression – too low to be determined by the assay.

References

    1. Bunn PA, Jr, Minna JD, Augustyn A, Gazdar AF, Ouadah Y, Krasnow MA, et al. Small Cell Lung Cancer: Can Recent Advances in Biology and Molecular Biology Be Translated into Improved Outcomes? J Thorac Oncol. 2016;11:453–74. - PMC - PubMed
    1. Siegel RL, Miller KD, Jemal A. Cancer statistics, 2016. CA Cancer J Clin. 2016;66:7–30. - PubMed
    1. Miller KD, Siegel RL, Lin CC, Mariotto AB, Kramer JL, Rowland JH, et al. Cancer treatment and survivorship statistics, 2016. CA Cancer J Clin. 2016;66:271–89. - PubMed
    1. Joshi M, Ayoola A, Belani CP. Small-cell lung cancer: an update on targeted therapies. Adv Exp Med Biol. 2013;779:385–404. - PubMed
    1. Rekhtman N. Neuroendocrine tumors of the lung: an update. Arch Pathol Lab Med. 2010;134:1628–38. - PubMed

Publication types

MeSH terms

Substances