. 2017 May 9;10(478):eaal2021.
doi: 10.1126/scisignal.aal2021.

The amyloid-β oligomer Aβ*56 induces specific alterations in neuronal signaling that lead to tau phosphorylation and aggregation

Affiliations

The amyloid-β oligomer Aβ*56 induces specific alterations in neuronal signaling that lead to tau phosphorylation and aggregation

Fatou Amar et al. Sci Signal. .

Expression of concern in

  • Editorial expression of concern.
    Foley JF. Foley JF. Sci Signal. 2022 Jun 21;15(739):eadd4322. doi: 10.1126/scisignal.add4322. Epub 2022 Jun 21. Sci Signal. 2022. PMID: 35727863 No abstract available.

Abstract

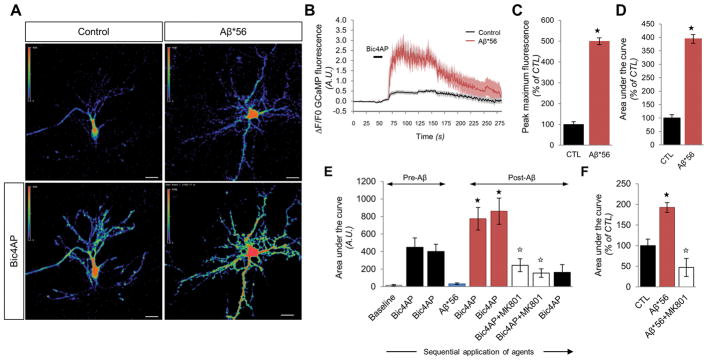
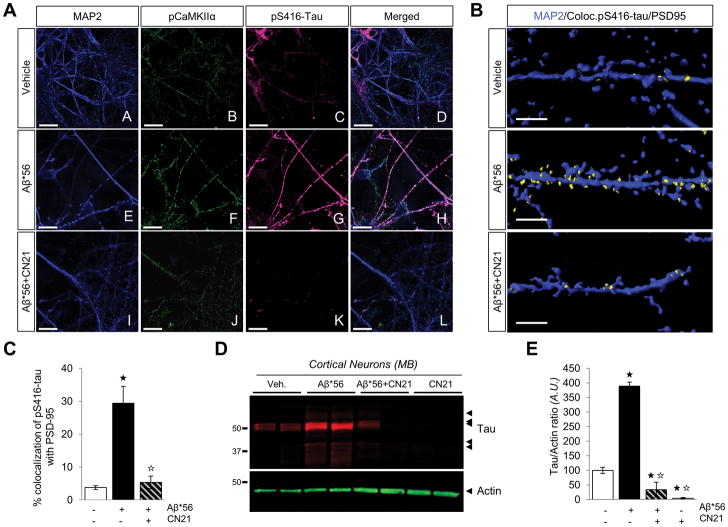
Oligomeric forms of amyloid-forming proteins are believed to be the principal initiating bioactive species in many neurodegenerative disorders, including Alzheimer's disease (AD). Amyloid-β (Aβ) oligomers are implicated in AD-associated phosphorylation and aggregation of the microtubule-associated protein tau. To investigate the specific molecular pathways activated by different assemblies, we isolated various forms of Aβ from Tg2576 mice, which are a model for AD. We found that Aβ*56, a 56-kDa oligomer that is detected before patients develop overt signs of AD, induced specific changes in neuronal signaling. In primary cortical neurons, Aβ*56 interacted with N-methyl-d-aspartate receptors (NMDARs), increased NMDAR-dependent Ca2+ influx, and consequently increased intracellular calcium concentrations and the activation of Ca2+-dependent calmodulin kinase IIα (CaMKIIα). In cultured neurons and in the brains of Tg2576 mice, activated CaMKIIα was associated with increased site-specific phosphorylation and missorting of tau, both of which are associated with AD pathology. In contrast, exposure of cultured primary cortical neurons to other oligomeric Aβ forms (dimers and trimers) did not trigger these effects. Our results indicate that distinct Aβ assemblies activate neuronal signaling pathways in a selective manner and that dissecting the molecular events caused by each oligomer may inform more effective therapeutic strategies.


Conflict of interest statement

Competing interests: The authors have no conflicts of interests in relation to this manuscript.

Figures

Figure 1
Figure 1. Co-immunoprecipitation and co-localization of Aβ*56 with the NMDA receptor subunit GluN1
(A) Co-immunoprecipitation of Aβ*56 with NMDAR subunits GluN1, GluN2A and GluN2B), AMPAR subunits (GluA1, GluA2), α7-nicotinic acetylcholine receptor subunit (α7), mGluR5 (R5), or Ephrin B2 (B2) in membrane extracts from the forebrain of Tg2576 mice. Aβ was detected with 6E10. Blot is representative of 3 experiments (n = 6 mice per group). (B and C) Western blots (B) and quantitation (C) of co-immunoprecipitation of Aβ*56 with GluN1 in membrane extracts from Tg2576 mice and a wild-type (WT) control. Antibody A11 was used to detect oligomeric Aβ. Data are mean ± S.D. from n = 5 mice per group. P < 0.05 vs. 5-month-old WT mice, P < 0.05 vs. 7-month-old Tg2576 mice, by two-way ANOVA [F(4,30) = 86.9203, P < 0.0001] followed by Student’s t test. (D) Representative confocal images of Aβ*56 (green) binding to GluN1 (red) on wild-type (WT) or Prnp-null (Prnp-/-) primary cortical neurons. Neurons were also labeled for the dendritic neuronal marker MAP-2 (blue). n = 6 dishes per group. (E) Software-assisted co-localization analysis of Aβ*56 and GluN1 on WT and Prnp-null neurons (6 R.O.I.s per dish; n= 6 dishes per group). (F) Western blots comparing GluN1 protein amounts in primary neurons and in HEK293 cells expressing GluN1. (G) Representative confocal images of Aβ*56 (A11, magenta) binding to HEK293 cells transfected with GluN1 (red) and/or GluN2B-eGFP (green). Arrowheads indicate colocalization between Aβ*56 and GluN1. Scale bars = 15 μm; n = 6–8 dishes per condition. IP, immunoprecipitation; WB, western blot; Tg, transgenic; WT, wild-type.
Figure 2
Figure 2. Aβ*56 enhances synaptic NMDAR-dependent calcium transients in primary cultured neurons
(A) Representative confocal images for GCaMP6f-transfected neurons in presence or absence of Aβ*56 at rest or after stimulation of synaptic NMDARs with Bic4AP. Scale bars = 20 μm. (B) Fluorescence responses of GCaMP6f-transfected neurons after synaptic NMDAR activation in the presence (red) or absence (black) of Aβ*56. Bold solid lines correspond to the average response; the flanking upper and lower grey-shaded areas indicate the standard deviation. The black bar indicates the exposure of Bic4AP. (C and D) Quantitation of the peak maximum GCaMP6f fluorescence (C) and area under the curve (D) in neurons exposed to Aβ*56 after simulation of synaptic NMDARs [F(1,13) = 21.122 and F(1,13) = 22.306 respectively], Student’s t test, P < 0.05; n = 6–9 cells per group. (E) Longitudinal fluorescence changes within GCaMP6f-transfected neurons in absence of Aβ*56 (bars 1–3) or after a 15-min application of Aβ*56 (bars 5–9). Each bar corresponds to sequential bath stimulations. Histograms show mean ± S.D.; one-way ANOVA [F(8,51) = 9.4731, P < 0.0001] followed by Student’s t test, P < 0.05 vs. Bic4AP (stimulation #2), P < 0.05 vs. Bic4AP post-Aβ*56 (stimulation #5); n = 8 cells per group. (F) Mean Ca2+ responses in cortical neurons consecutively exposed to Bic4AP, Bic4AP post-Aβ*56 application and Bic4AP+MK801. Histograms show mean ± S.D.; one-way ANOVA [F(2,40) = 14.7673, P < 0.0001] followed by Student’s t test, P < 0.05 vs. Bic4AP, P < 0.05 vs. Bic4AP post-Aβ*56; n = 16 responses per group.
Figure 3
Figure 3. CaMKIIα is abnormally phosphorylated at Thr286 in brain tissue of 7-month-old Tg2576 mice and in cortical neurons treated with Aβ*56
(A and B) Representative Western blots (A) and densitometry analysis (B) for pThr286-CaMKIIα and CaMKIIα in intracellular (IC) protein extracts of 4- and 7-month-old Tg2576 or age-matched wild-type (WT) and Tg5469 mice. Data are mean ± S.D; two-way ANOVA [F(7,28) = 38.7825, P < 0.0001] followed by Student’s t test, P < 0.05 vs. 4-month-old WT mice; n = 6–9 mice per group. (C) Confocal imaging analysis of pThr286-CaMKIIα abundance and subcellular localization in prefrontal cortex (PFC) and CA1 pyramidal neurons of 7-month-old WT and Tg2576 mice (n = 5 mice per group). Scale bar = 20 μm. (D and E) Representative western blots (D) and quantitation (E) for pT286-CaMKIIα and CaMKIIα in membrane-associated (MB) protein extracts of 4-, 7-, 12- and 16-month-old Tg2576 mice. Histograms show mean ± S.D.; one-way ANOVA [F(3,24) = 30.4023, P < 0.0001] followed by Student’s t test, P < 0.05 vs. 4-month-old WT mice, P < 0.05 vs. 7-month-old Tg2576 mice; n = 6 per group. (F and G) Western blots (F) and densitometry analysis (G) for pT286-CaMKIIα and total CaMKIIα in DIV12–14 primary mouse cortical neurons treated with vehicle or increasing concentrations of brain-derived Aβ*56 for 60 min. Histograms show mean ± standard deviation; ANOVA [F(4,30) = 14.6822, P < 0.0001] followed by Student’s t test, P < 0.05 vs. vehicle, P < 0.05 vs. 1 pM condition; n = 6–8 per group. (H and I) Western blot images (H) and quantitation (I) for pT286-CaMKIIα and total CaMKIIα in DIV12–14 primary mouse cortical neurons treated with 2.5 pM of brain-derived Aβ*56 for 1, 6, 8, 12 or 24 hours. Histograms show mean ± S.D.; ANOVA [F(4,34) = 17.4461, P < 0.0001] followed by Student’s t test, P < 0.05 vs. vehicle, P < 0.05 vs. 1 hour condition; n = 6 per group. (K and L) Representative Imaris surface images (K) and quantitation (L) of the colocalization of pCaMKIIα with PSD-95 (yellow) respective to MAP2 (blue) in neurons treated with vehicle or 2.5 pM Aβ*56 for 60 min. Scale bar = 3 μm. Histograms show mean ± standard deviation; Student’s t test, F(1,14) = 37.339, P < 0.05 vs. vehicle; n = 8 R.O.I.s per group.
Figure 4
Figure 4. Hyperphosphorylation and missorting profile of soluble tau species in young Tg2576 mice
(A and B) Representative Western blots (A) and quantitation (B) of soluble tau species detected in intracellular (IC)-enriched fractions from 4- and 7-month-old WT and Tg2576 mice. Histograms show mean ± S.D.; two-way ANOVA [F(2,21) = 67.6019, P < 0.0001] followed by Student’s t test, P < 0.05 vs. age-matched WT mice, P < 0.05 vs. 4-month-old Tg2576 mice; n = 6–9 mice per group. (C and D) Western blots (C) and densitometry analysis (D) of total soluble tau, PSD-95 and actin in membrane extracts (MB) of Tg2576 mice at 4, 7 and 12 months of age. Histograms show mean ± S.D.; one-way ANOVA [F(2,18) = 19.7636, P < 0.0001] followed by Student’s t test, P < 0.05 vs. 4-month-old Tg2576 mice, P < 0.05 vs. 7-month-old Tg2576 mice; n = 6–9 mice per group. (E and F) Western blots (E) and quantitation (F) of total soluble tau in intracellular-enriched (I) or membrane extracts (M) of 4- and 7-month-old Tg2576 mice. Histograms show mean ± S.D.; two-way ANOVA [F(3,30) = 47.2095, P < 0.0001] followed by Student’s t test, P < 0.05 vs. 4-month-old Tg2576 mice; n = 6–9 mice per group. (G) Representative confocal images of CA1 hippocampal neurons immunostained for MAP2 (blue), pSer202-Tau (CP13; green) and pSer416-Tau (red) revealed an aberrant accumulation and differential missorting of soluble tau species in 7-month-old Tg2576 mice. (H) Z-stack reconstruction from confocal images illustrating the colocalization for pSer202-Tau and pSer416-Tau (yellow), shown with the 3D rendering of MAP2. Scale bars = 20 μm (top and middle) or 10 μm (bottom) in (G), 3 μm in (H). n = 6 sections per animal; N = 3–6 animals per group.
Figure 5
Figure 5. Selective tau hyperphosphorylation in primary neurons exposed to Aβ*56
(A and B) Western blots (A) and quantitation (B) of soluble tau species detected in mouse cortical neurons exposed to increasing concentrations of Aβ*56 for 60 min. Histograms show mean ± S.D.; one-way ANOVA [F(2,21) = 67.6019, P < 0.0001] followed by Student’s t test, P < 0.05 vs. vehicle-treated neurons, P < 0.05 vs. 1 pM Aβ*56 condition; n = 6–8 dishes per treatment. (C and D) Western blots (C) and densitometry analysis (D) for total soluble tau detected with the antibody tau5, PSD-95 and actin in membrane-associated extracts from vehicle or Aβ*56 treated neurons. Histograms show mean ± S.D.; one-way ANOVA [F(2,21) = 67.6019, P < 0.0001] followed by Student t test, P < 0.05 vs. vehicle-treated neurons, P < 0.05 vs. 1 pM Aβ*56 condition; n = 6–8 per group. (E and F) Western blots (E) and quantitation (F) for pS416-Tau, total soluble tau detected with the antibody tau5 and actin in intracellular-enriched lysates of vehicle or Aβ*56 (2.5 pM) treated neurons. Histograms show mean ± S.D., P < 0.05 vs. vehicle-treated neurons by t test; n = 6 dishes per group.
Figure 6
Figure 6. Inhibiting CaMKII prevents Aβ*56-induced tau hyperphosphorylation at S416
(A and B) Western blots (A) and quantitation (B) for pCaMKIIα and total CaMKIIα in primary cortical neurons pretreated with the NMDAR uncoupling peptide tat-NR2B9c for 15 min in presence or absence of 2.5 pM Aβ*56. Histograms show mean ± S.D.; one-way ANOVA [F(3,14) = 252.0481, P < 0.0001] followed by Student’s t test; P < 0.05 vs. vehicle, P < 0.05 vs. Aβ*56-treated neurons; n = 4–6 dishes per group. (C to E) Western blots (C) and densitometry analysis (D and E) for pSer202-Tau, pSer416-Tau, total Tau and actin in primary cortical neurons pretreated with the NMDAR uncoupling peptide tat-NR2B9c for 15 minutes in presence or absence of 2.5 pM Aβ*56. Total tau was detected with the antibody Tau5. Histograms show mean ± S.D.; one-way ANOVA [F(3,14) = 22.6029, P < 0.0001 and F(3,12) = 16.1364, P = 0.0009 respectively] followed by Student’s t test; P < 0.05 vs. vehicle, P < 0.05 vs. Aβ*56-treated neurons; n = 4–6 dishes per group. (F and G) Western blots (F) and quantitation (G) for pThr286-CaMKIIα and total CaMKII in primary cortical neurons pretreated with the CaMKII inhibitor tat-CN21 in presence or absence of 2.5 pM Aβ*56. Histograms show mean ± S.D.; two-way ANOVA [F(3,35) = 25.0063, P < 0.0001] followed by Student’s t test, P < 0.05 vs. vehicle-treated neurons, P < 0.05 vs. Aβ*56-treated neurons; n = 6–9 dishes per group. ANOVA results: for Aβ*56 (F = 26.7966, P < 0.0001), tat-CN21 (F = 16.2025, P = 0.0003) and Aβ*56xtat-CN21 interaction (F = 27.4058, P < 0.0001). (H to J) Western blots (H) and quantitation (I and J) for soluble pSer416-Tau and total tau (as measured with the tau5 antibody) in mouse primary neurons pretreated with the CaMKII inhibitor tat-CN21 in presence or absence of 2.5 pM Aβ*56. Histograms show mean ± S.D.; two-way ANOVA [F(3,35) = 28.4569, P < 0.0001 and F(3,35) = 24.8972, P < 0.0001 respectively] followed by Student’s t test, P < 0.05 vs. vehicle-treated neurons, P < 0.05 vs. Aβ*56-treated neurons; n = 6–9 dishes per group.
Figure 7
Figure 7. CN21 pretreatment prevents the missorting of tau in cortical primary neurons exposed to Aβ*56
(A) Representative confocal images of primary mouse cortical neurons immunostained for MAP2 (blue), pThr286-CaMKIIα (green) and pSer416-Tau (magenta) after treatment with 2.5 pM Aβ*56 for 60 min. Scale bar = 30 μm. n = 6 dishes per group. (B) Surface rendering of dendrites labeled with MAP2, pSer416-tau and PSD-95 illustrating the cellular distribution of the pS416-tau/PSD-95 colocalization channel (yellow) with respect to MAP2 (in blue) in neurons treated with vehicle, 2.5 pM Aβ*56 or tatCN21 pretreatment (15 min) followed by 2.5 pM Aβ*56 for 60 min. Scale bar = 3 μm. (C) Quantitation of the colocalization of pS416-tau with PSD-95 in mouse primary neurons exposed to vehicle, 2.5 pM Aβ*56 or tatCN21 pretreatment followed by 2.5 pM Aβ*56. Histograms show mean ± S.D.; one-way ANOVA [F(2,20) = 67.7832, P < 0.0001] followed by Student t test; P < 0.05 vs. vehicle, P < 0.05 vs. Aβ*56-treated neurons; n = 8 R.O.I.s per group. (D and E) Western blots (D) and quantitation (E) for soluble tau in membrane-associated lysates from neurons exposed to vehicle, Aβ*56, CN21, or Aβ*56+CN21 using the pan tau-specific antibody tau5. Actin was used as internal standard. Histograms show mean ± S.D.; one-way ANOVA [F(3,12) = 197.3191, P < 0.0001] followed by Student t test; P < 0.05 vs. vehicle, P < 0.05 vs. Aβ*56-treated neurons; n = 4 dishes per group.

References

    1. Jin M, Shepardson N, Yang T, Chen G, Walsh D, Selkoe DJ. Soluble amyloid beta-protein dimers isolated from Alzheimer cortex directly induce Tau hyperphosphorylation and neuritic degeneration. Proc Natl Acad Sci U S A. 2011;108:5819–5824. - PMC - PubMed
    1. Larson M, Sherman MA, Amar F, Nuvolone M, Schneider JA, Bennett DA, Aguzzi A, Lesne SE. The complex PrP(c)-Fyn couples human oligomeric Abeta with pathological tau changes in Alzheimer’s disease. J Neurosci. 2012;32:16857–16871a. - PMC - PubMed
    1. Mairet-Coello G, Courchet J, Pieraut S, Courchet V, Maximov A, Polleux F. The CAMKK2-AMPK kinase pathway mediates the synaptotoxic effects of Abeta oligomers through Tau phosphorylation. Neuron. 2013;78:94–108. - PMC - PubMed
    1. Roberson ED, Scearce-Levie K, Palop JJ, Yan F, Cheng IH, Wu T, Gerstein H, Yu GQ, Mucke L. Reducing endogenous tau ameliorates amyloid beta-induced deficits in an Alzheimer’s disease mouse model. Science. 2007;316:750–754. - PubMed
    1. Ittner LM, Gotz J. Amyloid-beta and tau--a toxic pas de deux in Alzheimer’s disease. Nature reviews Neuroscience. 2011;12:65–72. - PubMed

MeSH terms