. 2017 Jul;174(3):1825-1836.
doi: 10.1104/pp.17.00421. Epub 2017 May 9.

Flavodiiron Proteins Promote Fast and Transient O2 Photoreduction in Chlamydomonas

Affiliations

Flavodiiron Proteins Promote Fast and Transient O2 Photoreduction in Chlamydomonas

Frédéric Chaux et al. Plant Physiol. 2017 Jul.

Abstract

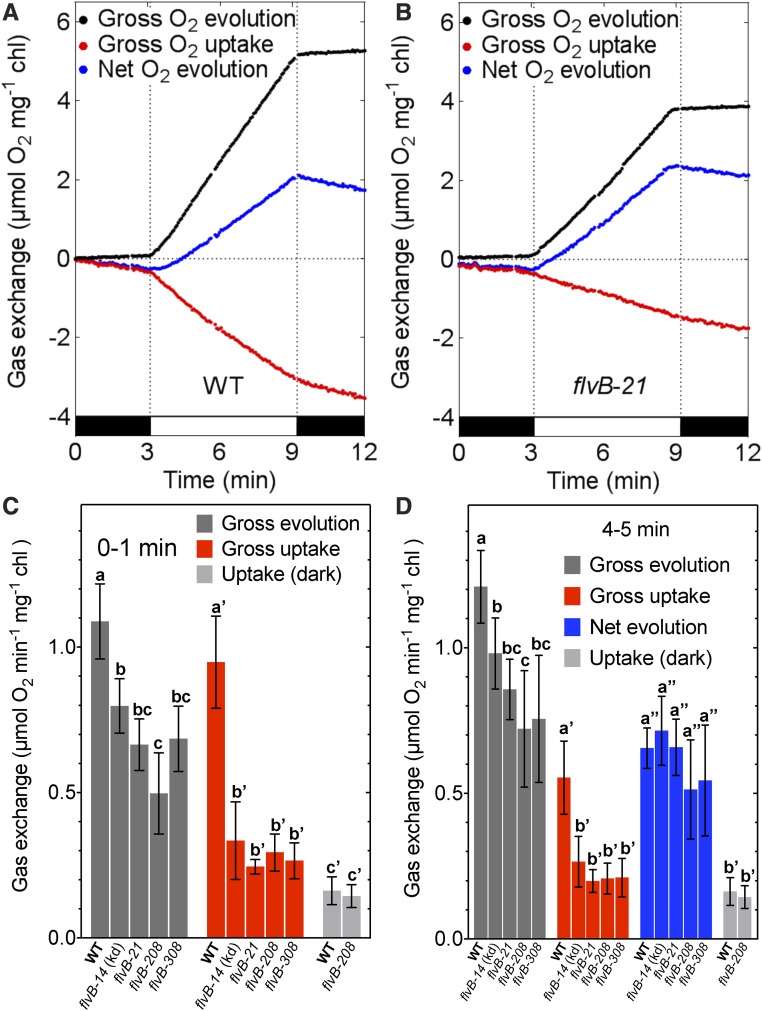
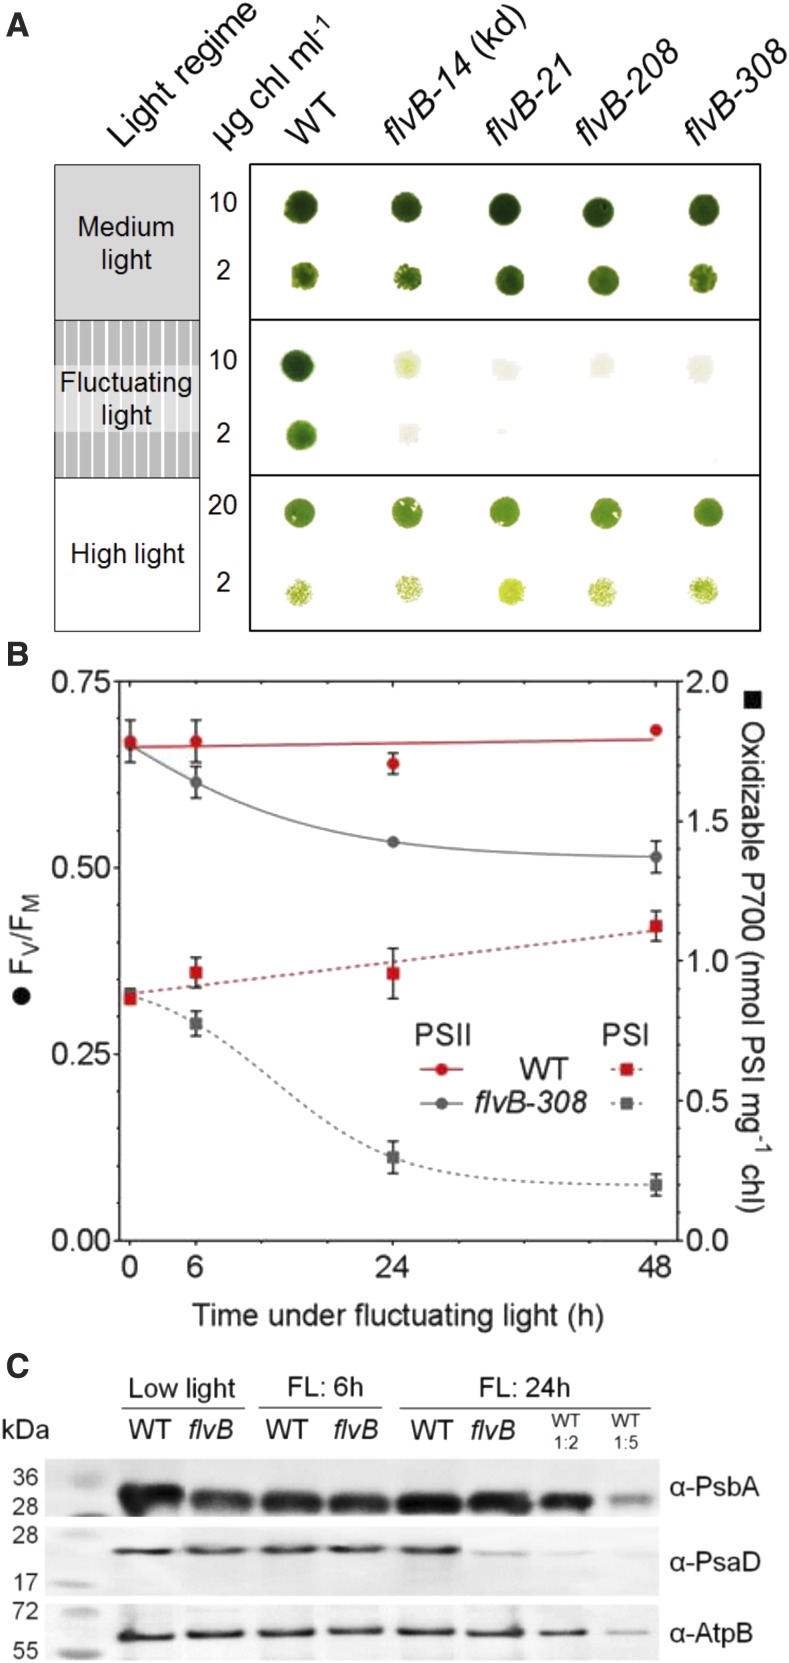
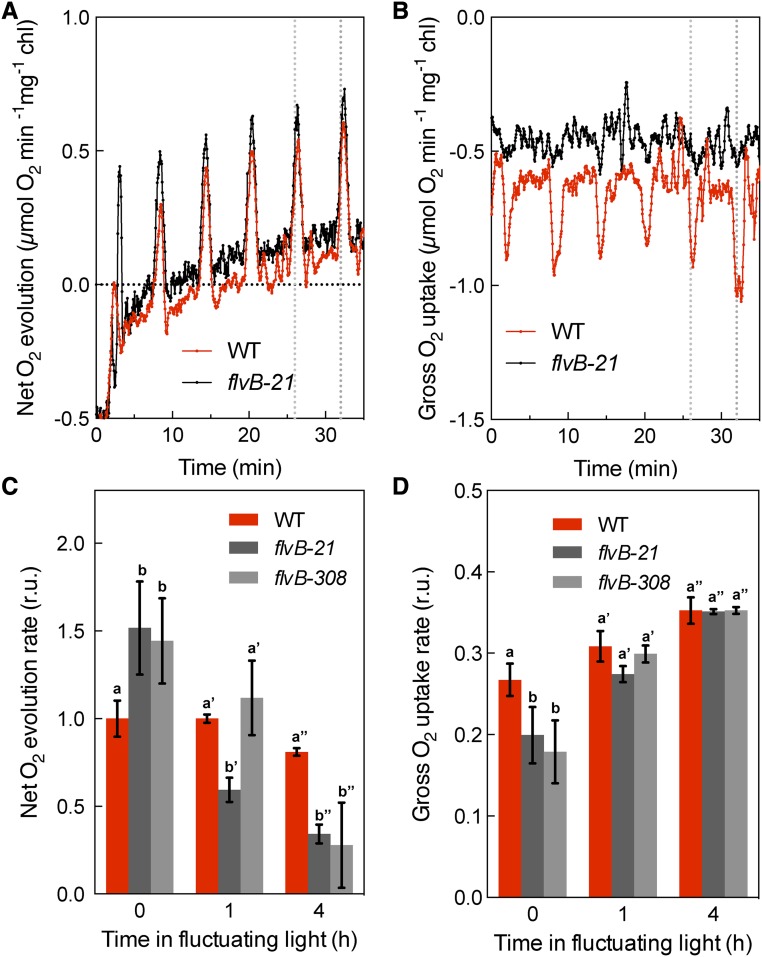
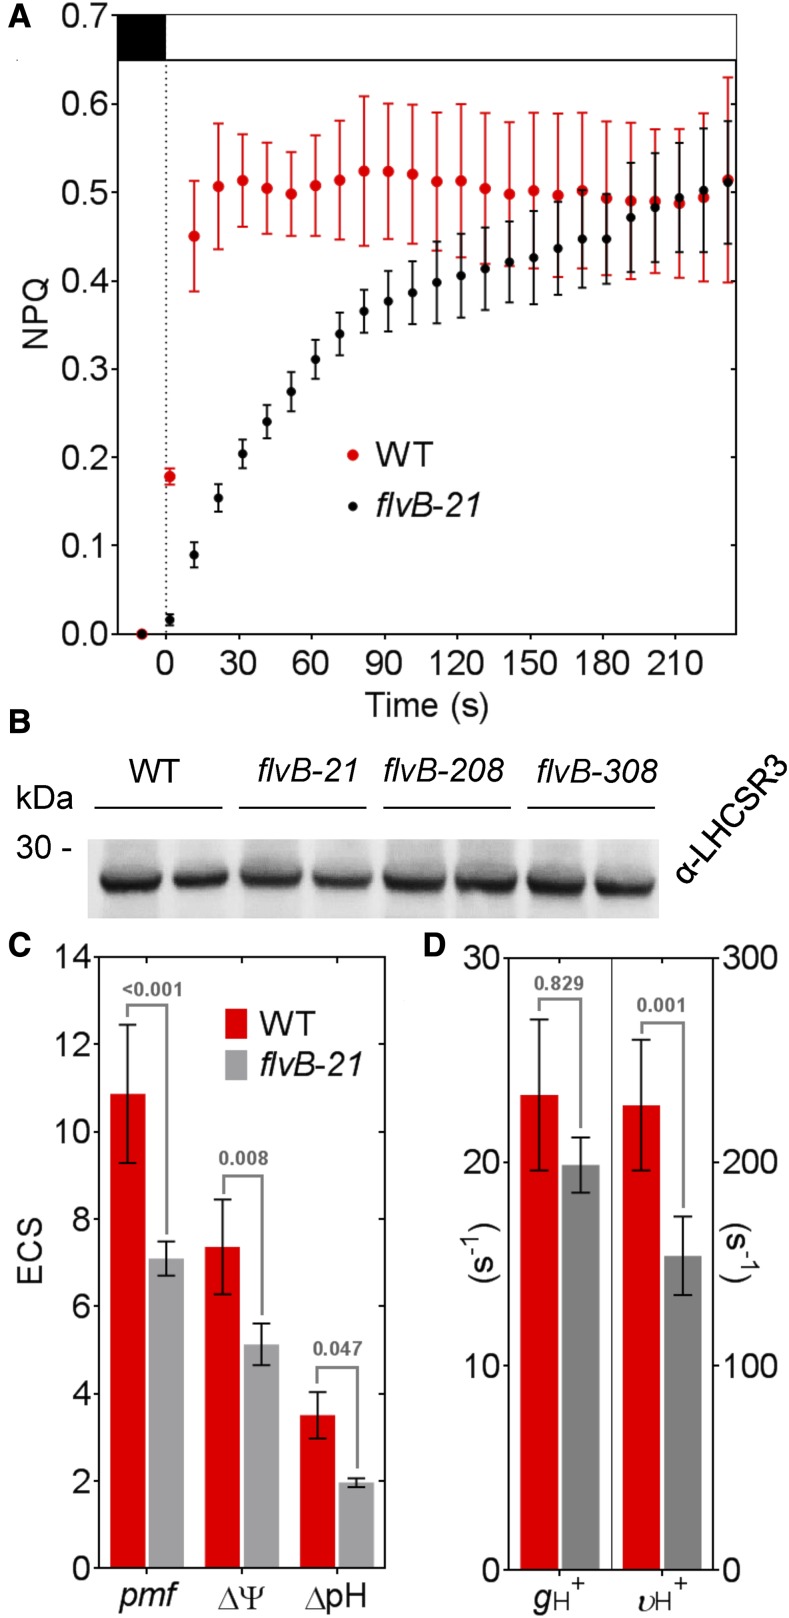
During oxygenic photosynthesis, the reducing power generated by light energy conversion is mainly used to reduce carbon dioxide. In bacteria and archae, flavodiiron (Flv) proteins catalyze O2 or NO reduction, thus protecting cells against oxidative or nitrosative stress. These proteins are found in cyanobacteria, mosses, and microalgae, but have been lost in angiosperms. Here, we used chlorophyll fluorescence and oxygen exchange measurement using [18O]-labeled O2 and a membrane inlet mass spectrometer to characterize Chlamydomonas reinhardtii flvB insertion mutants devoid of both FlvB and FlvA proteins. We show that Flv proteins are involved in a photo-dependent electron flow to oxygen, which drives most of the photosynthetic electron flow during the induction of photosynthesis. As a consequence, the chlorophyll fluorescence patterns are strongly affected in flvB mutants during a light transient, showing a lower PSII operating yield and a slower nonphotochemical quenching induction. Photoautotrophic growth of flvB mutants was indistinguishable from the wild type under constant light, but severely impaired under fluctuating light due to PSI photo damage. Remarkably, net photosynthesis of flv mutants was higher than in the wild type during the initial hour of a fluctuating light regime, but this advantage vanished under long-term exposure, and turned into PSI photo damage, thus explaining the marked growth retardation observed in these conditions. We conclude that the C. reinhardtii Flv participates in a Mehler-like reduction of O2, which drives a large part of the photosynthetic electron flow during a light transient and is thus critical for growth under fluctuating light regimes.


Figures

Figure 1.
Figure 1.
Characterization of independent C. reinhardtii mutants carrying an insertion in the flvB gene. A, Four mutant strains from the CLiP (www.chlamylibrary.org/) harboring putative insertions of the paromomycin resistance cassette in the FLVB locus (Cre16.g691800) were characterized. Exons, introns, and untranslated regions are shown as red boxes, black lines, and gray boxes, respectively. Genomic sequences flanking the insertion cassette of the four putative flvB mutant strains obtained from the CLiP Web site were used to design primers (F1/R2 and F8/R9) to confirm the location of insertion. B and C, Immunoanalysis of FlvB and FlvA protein amounts were carried out using antibodies produced against recombinant FlvB (B) and FlvA (C) proteins, respectively. A cytochrome f antibody was used as loading control.
Figure 2.
Figure 2.
Chlorophyll fluorescence measurements during dark to light transients in C. reinhardtii wild type (WT) and flvB mutant strains. Cells were grown in HSM medium under low light (40 µmol photon m−2 s−1) and harvested during exponential phase. Chlorophyll fluorescence measurements were performed using pulse amplitude modulated fluorimeter in the dark (black boxes) and under red actinic light (white boxes) of different intensities: 25 µmol photon m−2 s−1 (A), 100 µmol photon m−2 s−1 (B), and 500 µmol photon m−2 s−1 (C). Saturating flashes were supplied when indicated by red vertical lines. Data are normalized on initial FM measurements and traces of mutant strains are shifted few seconds to the right for clarity.
Figure 3.
Figure 3.
Light dependence of the PSII yield in the wild type (WT) and flvB mutant strains. Upon 10-min dark adaptation under constant air bubbling, algal suspensions of wild type and flvB mutant strains were introduced in the cuvette of a pulse amplitude-modulated fluorimeter. PSII yields were measured after 20 s (dotted lines) or 5 min (plain lines) of illumination at different light intensities. Shown are the mean values (±sd, n = 3).
Figure 4.
Figure 4.
Effect of DBMIB and MV on chlorophyll fluorescence transients measured in wild type (WT) and flvB mutant strains. Samples were placed in the dark (black box) in the presence of 1 µm DBMIB, 1 mm MV, or without addition of any chemicals. Chlorophyll fluorescence was measured during a transient dark to light (100 µmol photon m−2 s−1) transient. Saturating flashes were supplied when indicated by red vertical lines. Shown are the traces representative of n = 2 independent measurements. Fluorescence data have been normalized on F0.
Figure 5.
Figure 5.
Oxygen exchange measurements performed using a MIMS and 18O-labeled O2 in the wild type (WT) and flvB mutant strains. A and B, Gross O2 evolution (black dots), O2 uptake (red dots), and net O2 production (blue dots) were determined in the wild type (A) and the flvB-21 mutant (B). C, Mean values of gross O2 evolution (dark gray boxes) and O2 uptake (red boxes) measured during the first minute of illumination (shown are means ± sd, n = 3) in the wild type, and in flvB-14, flvB-21, flvB-208, and flvB-308 mutant strains. D, Mean values of gross O2 evolution (dark gray boxes), O2 uptake (red boxes), and net O2 evolution (blue boxes) measured between 4 and 5 min of illumination (shown are means ± sd, n = 3). Values of O2 uptake in the dark prior to illumination (light gray boxes) are shown for the wild type and flvB-208 (shown are means ± sd, n = 3) (C and D). Letters above the bars (C and D) represent statistically significant differences (P value < 0.05) between strains for a given gas exchange measurement based on ANOVA analysis (Tukey adjusted P value); letters with single or double quote have been used to group oxygen uptake or net evolution data respectively.
Figure 6.
Figure 6.
Growth and PSI activity of flvB mutants are impaired under fluctuating light. A, Cells were spotted on HSM agar plates and exposed for 10 d to continuous medium (125 µmol photon m−2 s−1), high (800 µmol photon m−2 s−1), or to fluctuating light intensity (alternatively 5 min at 50 µmol photon m−2 s−1 and 1 min at 500 µmol photon m−2 s−1). Shown are representative drops of three independent spot tests. B, PSII and PSI activity measured in response to fluctuating light exposure. Wild-type (WT) and flvB-308 cells were grown photoautotrophically in flasks under low light (50 µmol photon m−2 s−1) and exposed at t0 to fluctuating light cycles (5 min at 50 µmol photon m−2 s−1 and 1 min at 500 µmol photon m−2 s−1) for 48 h. Maximal PSII yields and maximal oxidizable PSI were respectively determined by means of chlorophyll fluorescence and P700 absorption changes measurements PSII. C, Immunoanalysis of PSII and PSI subunit amounts in the wild type and flvB-308 mutant in response to fluctuating light exposure. PsbA and PsaD antibodies were used to probe amounts of PSII and PSI complexes, respectively. AtpB antibody was used as loading control.
Figure 7.
Figure 7.
Net O2 exchange measurements under fluctuating light in flvB mutants and in wild-type (WT) C. reinhardtii strains. Cells were grown photoautotrophically in air under continuous light (50 µmol photon m−2 s−1) and then exposed up to 4 h to a fluctuating light regime (1 min at 50 µmol photon m−2 s−1, 5 min at 500 µmol photon m-2 s−1) before performing O2 exchange measurements using a MIMS under similar fluctuating light conditions. A and B, Representative traces of net O2 evolution rate (A) and O2 uptake rate in the light (B) measured in the flvB-21 mutant and wild type under fluctuating light in cells previously cultivated under continuous light. C and D, Mean values of net O2 evolution (C) and O2 uptake rates in the light (D) measured in fluctuating light in flvB-21, flvB-308, and wild-type strains. Shown are means (±sd, n = 3 for t = 0 h, n = 2 for t > 0 h) of net O2 evolution rates relative to the wild type (at t = 0) and measured during the 5th light fluctuation period (as indicated in A and B by vertical dotted lines) in the wild type (red boxes) and flvB mutants (gray boxes). Letters (a and b) above the bars (C and D) represent statistically significant differences (P value < 0.05) between strains for a given gas exchange measurement based on ANOVA analysis; letters with simple or double quote have been used to group oxygen exchange data after 1 and 4 h or fluctuating light, respectively.
Figure 8.
Figure 8.
NPQ induction and proton motive force (pmf) measurements in the wild type (WT) and flvB-21 mutant. A, For NPQ measurements, cells were exposed to 200 µmol photon m−2 s−1 for 4 h to induce accumulation of the LHCSR3 prior to chlorophyll fluorescence measurements. The wild type and flvB-21 mutant were then exposed to 500 µmol photon m−2 s−1 in the PAM cuvette (white box) and NPQ determined from chlorophyll fluorescence measurements. NPQ values are the mean (±sd, n = 3) in the wild type (red symbols) and flvB-21 mutant (black symbols). B, Immunodetection of LHCSR3 protein in experimental conditions as described in (A) in wild type and different flvB mutants. C, Different components of the pmf (ΔΨ and ΔpH) were determined from ECS measurements in wild type (red) and flvB-21 mutant (gray) from similar experiments as described in (Supplemental Fig. S5A). D, Membrane proton conductivity (gH+) and proton flow (νH+) were determined from ECS measurements. Numbers above bars (C and D) represent uncorrected P values as determined by ANOVA using Fischer’s lsd.

Similar articles

Cited by

References

    1. Allahverdiyeva Y, Ermakova M, Eisenhut M, Zhang P, Richaud P, Hagemann M, Cournac L, Aro EM (2011) Interplay between flavodiiron proteins and photorespiration in Synechocystis sp. PCC 6803. J Biol Chem 286: 24007–24014 - PMC - PubMed
    1. Allahverdiyeva Y, Isojärvi J, Zhang P, Aro E-M (2015) Cyanobacterial oxygenic photosynthesis is protected by flavodiiron proteins. Life (Basel) 5: 716–743 - PMC - PubMed
    1. Allahverdiyeva Y, Mustila H, Ermakova M, Bersanini L, Richaud P, Ajlani G, Battchikova N, Cournac L, Aro EM (2013) Flavodiiron proteins Flv1 and Flv3 enable cyanobacterial growth and photosynthesis under fluctuating light. Proc Natl Acad Sci USA 110: 4111–4116 - PMC - PubMed
    1. Allen JF. (2003) Cyclic, pseudocyclic and noncyclic photophosphorylation: new links in the chain. Trends Plant Sci 8: 15–19 - PubMed
    1. Badger MR. (1985) Photosynthetic oxygen-exchange. Annu Rev Plant Physiol Plant Mol Biol 36: 27–53

LinkOut - more resources