. 2017 May 23;114(21):5497-5502.
doi: 10.1073/pnas.1619336114. Epub 2017 May 9.

Microbiota promotes systemic T-cell survival through suppression of an apoptotic factor

Affiliations

Microbiota promotes systemic T-cell survival through suppression of an apoptotic factor

Raymond Soto et al. Proc Natl Acad Sci U S A. .

Abstract

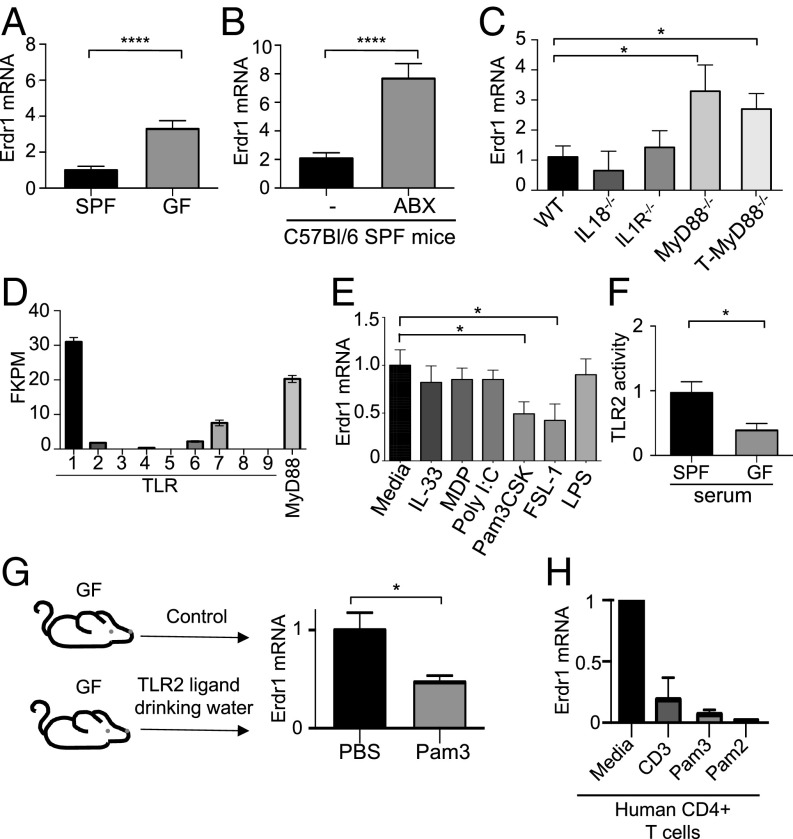
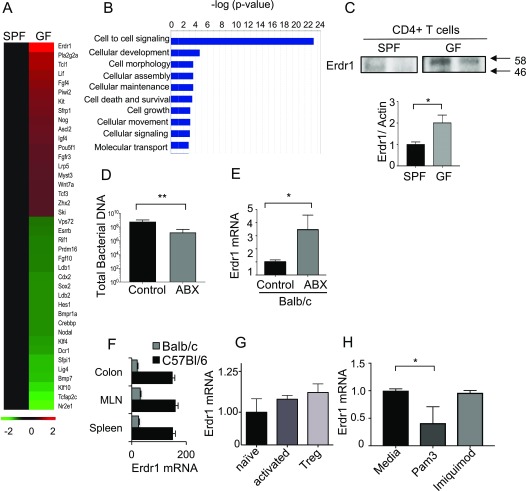
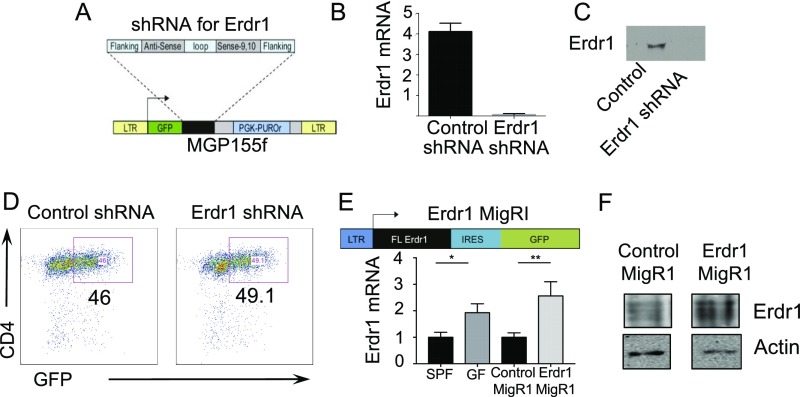
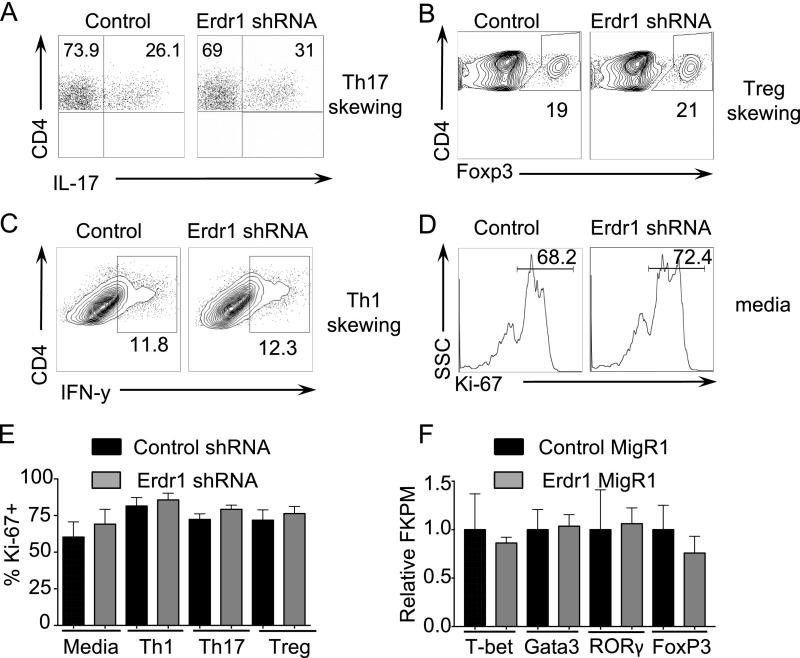
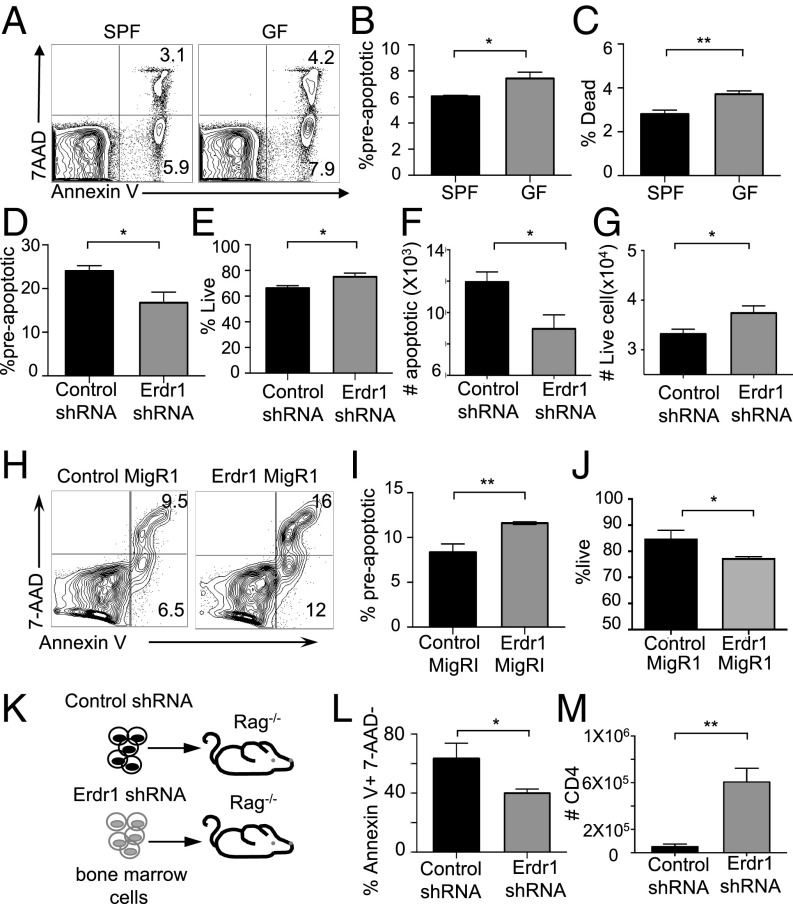
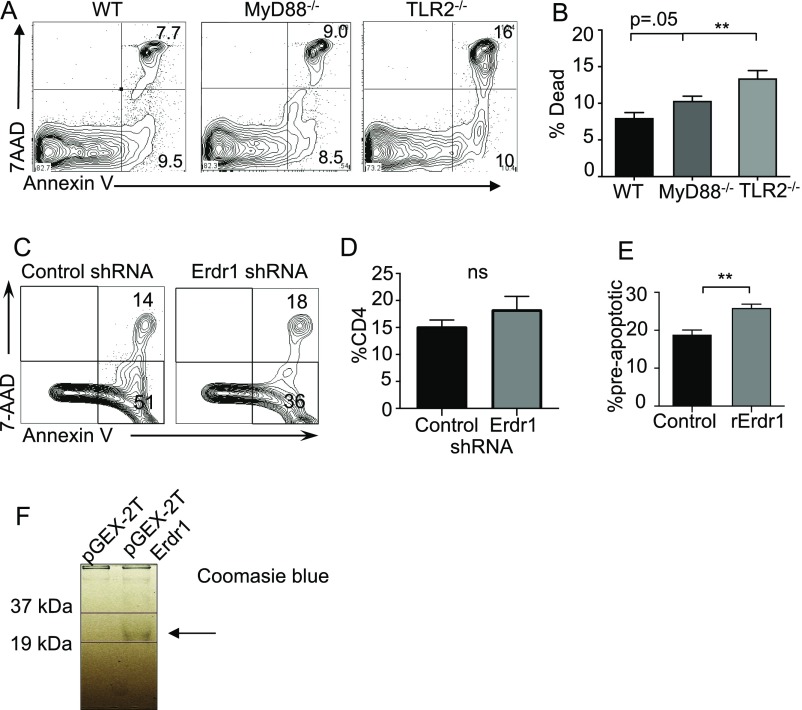
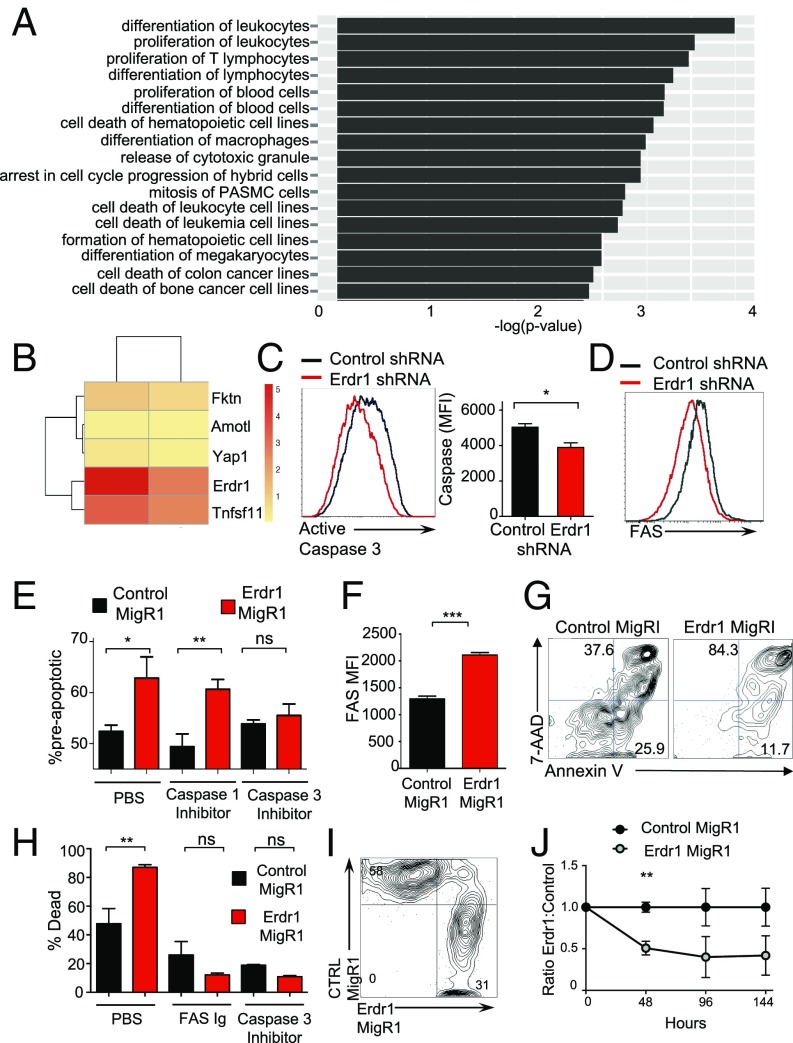
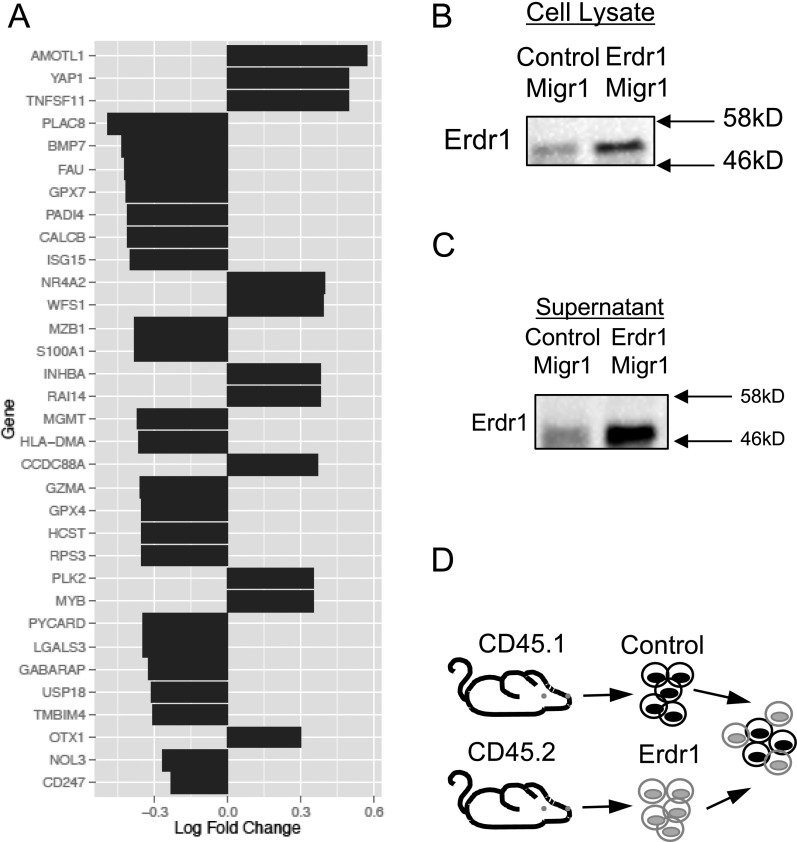
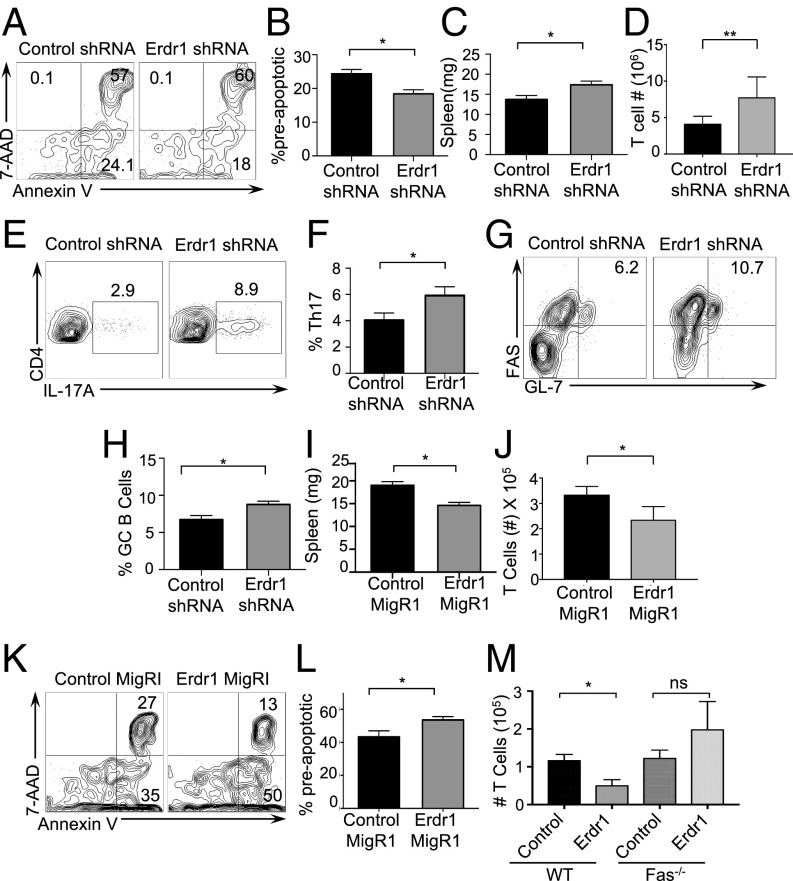
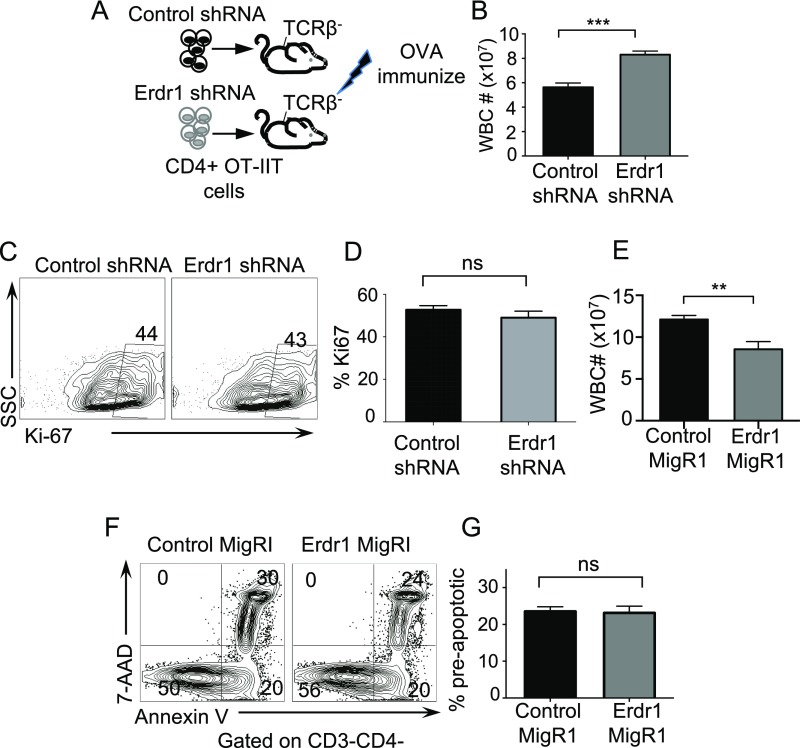
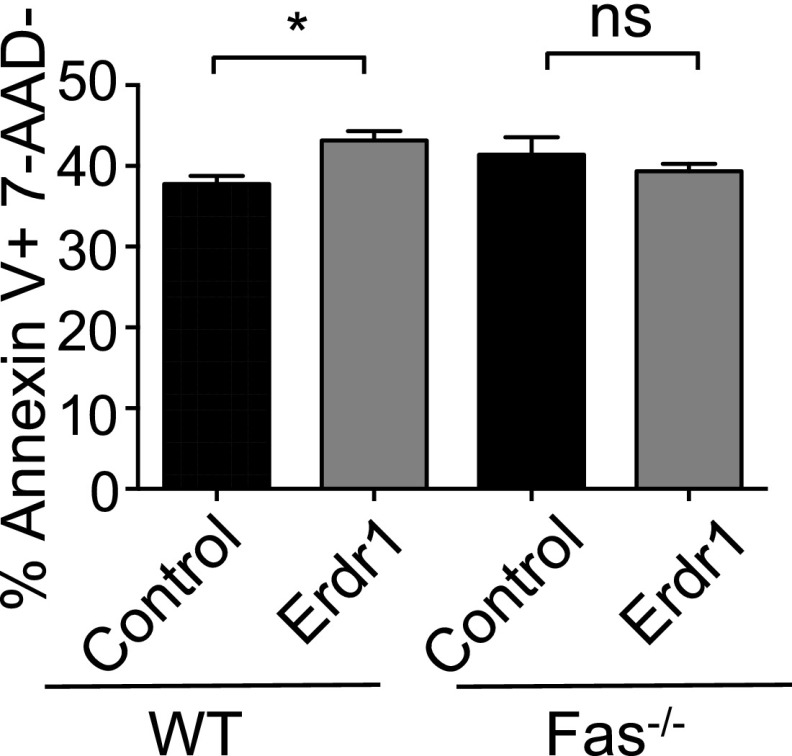
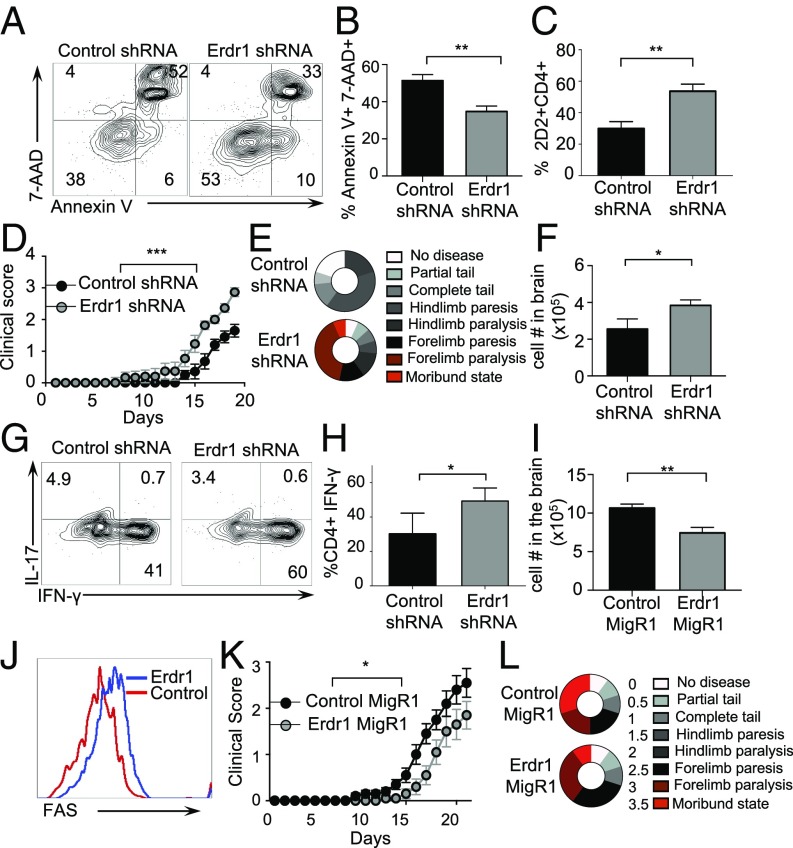
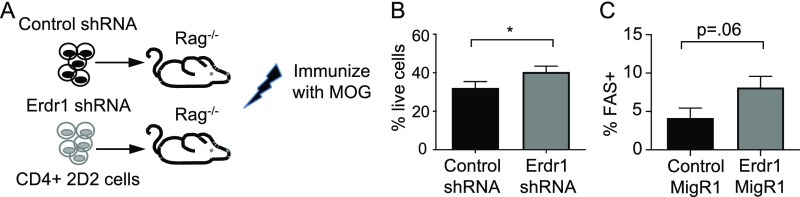
Symbiotic microbes impact the severity of a variety of diseases through regulation of T-cell development. However, little is known regarding the molecular mechanisms by which this is accomplished. Here we report that a secreted factor, Erdr1, is regulated by the microbiota to control T-cell apoptosis. Erdr1 expression was identified by transcriptome analysis to be elevated in splenic T cells from germfree and antibiotic-treated mice. Suppression of Erdr1 depends on detection of circulating microbial products by Toll-like receptors on T cells, and this regulation is conserved in human T cells. Erdr1 was found to function as an autocrine factor to induce apoptosis through caspase 3. Consistent with elevated levels of Erdr1, germfree mice have increased splenic T-cell apoptosis. RNA sequencing of Erdr1-overexpressing cells identified the up-regulation of genes involved in Fas-mediated cell death, and Erdr1 fails to induce apoptosis in Fas-deficient cells. Importantly, forced changes in Erdr1 expression levels dictate the survival of auto-reactive T cells and the clinical outcome of neuro-inflammatory autoimmune disease. Cellular survival is a fundamental feature regulating appropriate immune responses. We have identified a mechanism whereby the host integrates signals from the microbiota to control T-cell apoptosis, making regulation of Erdr1 a potential therapeutic target for autoimmune disease.

Keywords: Fas; T cells; Toll-like receptors; apoptosis; microbiota.


Conflict of interest statement

The authors declare no conflict of interest.

Figures

Fig. 1.
Fig. 1.
Erdr1 is a conserved T-cell factor that is dynamically regulated by the microbiota through MyD88. (A) RNA was collected from CD3+CD4+ T cells from indicated animals and Erdr1 was analyzed by qRT-PCR. n = 8/group compiled from three experiments. (B) qRT-PCR was performed for Erdr1 from CD4+ T cells in antibiotic-treated animals. The n = 10/group was compiled from three experiments. (C) qRT-PCR was performed for Erdr1 from CD4+ T cells isolated from the indicated animals. n = 3–6/group. (D) RNA was collected from the CD3+CD4+ splenic T cells isolated and used for RNA-seq. n = 4/group. (E) Germfree CD4+ T cells were stimulated with anti-CD3 either alone or in combination with indicated stimuli. n = 5–8/group. (F) HEK293T NF-κB reporter cells activated by TLR2 were incubated with serum isolated from either SPF or germfree animals. Performed from the sera of six independent animals. (G) qRT-PCR was performed for Erdr1 from CD4+ T cells from germfree mice provided Pam3CysK in their drinking water. Data were compiled from two experiments; n = 6–8/group. (H) Primary human CD4+CD3+ T cells were isolated from whole blood and stimulated with anti-CD3 either alone or in combination with the indicated TLR2 ligands. Representative of three experiments. *P < 0.05 and ****P < 0.0001 were determined by a Student’s t test.
Fig. S1.
Fig. S1.
Erdr1 is up-regulated in germfree T cells and regulated by microbial signals. (A) Heat map of the most significantly changed genes in germfree mice compared with SPF in splenic T cells in the KEGG category of cellular maintenance. n = 2/group. (B) Ingenuity Analysis on microarray data from A showing the most significantly different pathways when comparing splenic germfree (GF) versus SPF CD4+ T cells. (C) CD3+CD4+ T-cell lysate from GF or SPF spleens was collected and analyzed for Erdr1 protein levels. (D) Total bacteria from fecal samples of animals after 2 wk of antibiotic treatment. (E) BALB/c mice were treated with antibiotics for 2 wk. CD3+CD4+ T cells were isolated from the spleen, and Erdr1 was measured by qRT-PCR. n = 4–5/group. (F) CD3+CD4+ T cells were isolated from the indicated compartments, and levels of Erdr1 were measured by qRT-PCR. n = 3/group. (G) RNA was collected from naive (CD3+CD4+CD44−CD62L+), activated (CD3+CD4+CD44+CD62L−), or Treg (CD3+CD4+CD25hi) T cells, and levels of Erdr1 were analyzed. (H) CD3+CD4+ T cells from GF spleens were collected and incubated with either Pam3 or Imiquimod, and Erdr1 was measured by qRT-PCR. n = 3/group. *P < 0.05; **P < 0.01. Statistical significance was determined by Student’s t test.
Fig. S2.
Fig. S2.
Erdr1 knockout or floxed animals cannot be generated. (A) Two of eight guide RNAs (gRNAs) had activity at the Erdr1 locus in vitro. Numbers indicate the various gRNAs. gRNA 1 and gRNA 3 had activity. (B) Sixteen of 18 blastocysts showed Crisper/Cas9 activity at the Erdr1 locus. However, 711 embryos injected with these blastocysts could not produce viable pups, indicating that this gene is necessary during development. (C and D) A high degree of sequence repetition inhibits efficient targeting of Erdr1. The first exon of Erdr1 is shown highlighted in red, and flanking LoxP sites shown in pink indicate the target sites for CRISPR genome editing. Dark-gray highlights indicate repetitive sequencing surrounding either (C) the 5′ site or (D) the 3′ site.
Fig. S3.
Fig. S3.
Validation of shRNA and overexpression of Erdr1 in primary T cells. (AF) The 293T cells are transfected with either the Erdr1 MigRI or Erdr1 shRNA or with the respective control plasmids along with pCLECO packaging vector to obtain virus. Erdr1-modified virus is then used to infect CD4+CD3+ splenic mouse T cells as described in SI Materials and Methods. (A) Schematic of the Erdr1 shRNA vector used throughout the study. (B and C) Validation that the Erdr1 shRNA construct functions to reduce levels of Erdr1 at the RNA and protein levels in T cells. (D) Efficiency of delivery of Erdr1 and control shRNA into primary CD4+CD3+ T lymphocytes. Cells are sorted by GFP+ before use. (E) Schematic of vector used for Erdr1 overexpression. RNA was collected from CD3+CD4+ splenic mouse T cells from SPF, GF, control infected, or Erdr1overexpressing T cells, and levels of Erdr1 were assayed by qRT-PCR. (F) Validation that the Erdr1 MigRI results in overexpression of the Erdr1 in primary splenic CD4+ T cells at the protein levels. *P < 0.05 and **P < 0.01. Statistical significance was determined by Student’s t test.
Fig. S4.
Fig. S4.
Erdr1 does not influence T-helper-cell differentiation or proliferation. (AC) Representative flow cytometry plots of sort-purified CD4+CD3+ T cells from the spleens of SPF animals after transfection with control or Erdr1-specific shRNA. T cells were incubated under the designated skewing conditions (A) Th17, (B) Treg, and (C) Th1 and analyzed for differentiation. (D) Representative flow cytometry plot of Ki-67 staining from sort-purified CD4+CD3+ T cells in response to anti-CD3/CD28 stimulation. All experiments were performed from cells isolated from at least four mice, and each experiment was replicated at least twice independently. (E) Ki-67 staining of sort-purified CD4+CD3+ T cells under indicated skewing conditions. n = 6–8/group compiled from two independent experiments. (F) CD3+CD4+ GFP+ sort-purified T cells from cells overexpressing either control MigRI or Erdr1 MigRI were stimulated with anti-CD3 and anti-CD28 in vitro for 2 d, and RNA was collected for RNA-seq. Analysis of fragments per kilobase of transcript per million mapped reads (FPKM) of master regulators of T-helper-cell differentiation. n = 4/group.
Fig. 2.
Fig. 2.
Erdr1 induces T-cell apoptosis. (AC) Cell apoptosis was analyzed by Annexin V and 7AAD in CD4+ T cells from germfree mice by flow cytometry. n = 7–8/group compiled from two experiments. (DG) Indicated CD4+ T cells were stimulated with anti-CD3/CD28 and analyzed for cell death. Preapoptotic are Annexin V+7AAD−, live are Annexin V−7AAD−. The data represent two pooled independent experiments. n = 4/group. (HJ) Indicated CD4+ sort-purified T cells were stimulated with anti-CD3/CD28 and analyzed for cell death as above. The data represent two pooled independent experiments. n = 4/group. (KM) Total bone marrow was infected with either control shRNA or Erdr1 shRNA-containing virus. GFP+ cells were flow-sorted and injected into Rag−/− animals. Eight weeks postreconstitution animals were analyzed for cellular death. n = 3/group. *P < 0.05 and **P < 0.01 were determined by a Student’s t test.
Fig. S5.
Fig. S5.
Cell apoptosis is modulated by Erdr1 expression. (A and B) CD3+CD4+ splenic T cells isolated from the indicated knockout animals and analyzed for cell death. (C) Representative flow cytometry plot of Annexin V staining in bone marrow chimeras from Fig. 2K. n = 3/group. (D) Percentage of CD4 in the spleens from animals receiving indicated bone marrow transplant. n = 3/group. (E) CD4+CD3+ T cells were treated with recombinant Erdr1 for 3 d in the presence of anti-CD3/CD28 and stained for Annexin V and 7AAD. n = 3/group. (F) Coomassie-stained gel of rERDR1 protein purification. **P < 0.01. ns, not significant. Statistical significance was determined by Student’s t test.
Fig. 3.
Fig. 3.
Erdr1-induced death is dependent on Fas and caspase 3. (A and B) Indicated CD4+ T cells were used for RNA-seq and analyzed using Ingenuity Pathway Analysis. n = 4/group. (B) The five most significantly changed genes between Erdr1 MigRI and controls are shown. (C and D) Indicated CD4+ T cells were analyzed for active caspase 3 or Fas by flow cytometry. Three experiments were performed with n = 2–3/group. (E) Indicated CD4+ T cells stimulated with anti-CD3/CD28 in vitro in the presence of indicated inhibitors. n = 4/group from two trials. (F and G) Fas expression was measured by flow cytometry in control MigR1- or Erdr1 MigR1-expressing DO11.10 hybridoma T cells or (H) incubated with indicated inhibitors or Fas-blocking antibody and subsequently measured for cell death. Representative of four trials. (I and J) Equal numbers of Erdr1- and control MigRI-expressing T cells were mixed and stimulated with anti-CD3 to anti-CD28 for 6 days. n = 3/group. *P < 0.05, **P < 0.01, and ***P < 0.001 were determined by Student’s t test. ns, not significant.
Fig. S6.
Fig. S6.
Characterization of gene expression in Erdr1-overexpressing T cells. (A) List of the most significantly changed genes involved in cell death (up- or down-regulated). (B and C) Western blot of supernatant from cultured cells that were overexpressing Erdr1 or control cells to demonstrate that Erdr1 can be detected in the culture media. Western blot of cell lysate from Erdr1-overexpressing DO11.10 cells. (D) Schematic of experimental design for Fig. 3I.
Fig. 4.
Fig. 4.
Erdr1 regulates apoptosis in vivo during immunization. (AD) Indicated OT-II CD4+ T cells were transferred into TCRβ−/− animals and immunized with OVA and CFA. Representative plots are from the draining lymph node stained for Annexin V and 7AAD, spleen size in milligrams, number of live OT-II T cells in the spleen after red blood cell (RBC) lysis. n = 9/group compiled from two experiments. (E and F) Representative plots of cells from the draining lymph node of experiments in A stained for CD3+CD4+IL-17A+. (G and H) Representative plots of cells stained for Fas and GL-7 and gated on B220+ IgD− cells. n = 9/group. Data were compiled from two experiments. (IL) Indicated OT-II CD4+ T cells were transferred into TCRβ−/− animals and subsequently immunized with OVA and CFA. Seven days postimmunization, spleen size in milligrams (I), number of OT-II T cells (J), and apoptotic cells (K and L) were analyzed. n = 4–5/group. Data were compiled from two independent experiments. (M) Splenic CD4+ T cells from B6 or FAS−/− mice immunized with OVA-overexpressing Erdr1 or the control vector were transferred into TCRβ−/− mice and immunized with OVA. T-cell numbers were determined in the draining lymph nodes. n = 3–6/group. *P < 0.05 and **P < 0.01 were determined by Student’s t test. ns, not significant.
Fig. S7.
Fig. S7.
Erdr1 influences cellular survival during immunization. (A) Schematic of experimental design shown in Fig. 4. TCRβ−/− animals were provided with Erdr1-overexpressing, Erdr1 shRNA, or control OT-II cells and subsequently immunized with OVA. (B) Quantification of total splenic cells after RBC lysis from mice in A and Fig. 4. (C and D) Representative FACS plot and quantification of Ki-67 from splenic T cells isolated from animals in A and Fig. 4. Plots are gated on CD4+CD3+ cells. (E) Quantification of total splenic cells after RBC lysis from mice in Fig. 4. (F and G) There is no difference in non-CD4 cell apoptosis during overexpression of Erdr1 in T cells from Fig. 4, indicating that cell death is specific to the cells overexpressing Erdr1. **P < 0.01; ***P < 0.001. ns, not significant. Statistical significance was determined by Student’s t test.
Fig. S8.
Fig. S8.
Erdr1-induced cell death is dependent on Fas signaling. Percentage of preapoptotic T cells from mice receiving WT or Fas−/− T cells. *P < 0.05. ns; ns, not significant. Statistical significance was determined by Student’s t test.
Fig. 5.
Fig. 5.
Erdr1 effects on T-cell survival influence extraintestinal autoimmunity. (AH) The indicated 2D2 T cells were transferred into Rag−/− animals and EAE-induced. (A) Representative flow cytometry plots of Annexin V and 7AAD. (B) Compiled plots from splenic cells. n = 7–9/group from three experiments. (C) Percentage of CD4+ T cells isolated from spleens. n = 9/group from three experiments. (D and E) Clinical symptoms of disease are shown. ***P < 0.005 by two-way ANOVA statistical test. n = 9/group. Data were compiled from three experiments. (F) Total number of infiltrating lymphocytes in the brains of indicated animals. n = 4–5/group representative of three experiments. (G and H) Representative plots of brain infiltrating IL-17 and IFN-γ from T cells. n = 4–5/group representative of three trials. (IL) The indicated 2D2 T cells were transferred into Rag−/− animals, and EAE was induced. (I) Number of total lymphocytes isolated from the brains of animals. n = 9–10/group. (J) Representative plot of Fas staining from the brains of animals. Data were compiled from two experiments. (K and L) Animals were monitored for signs of paralysis for 21 d. n = 9–10/group representative of two experiments. *P < 0.05 by two-way ANOVA statistical test. Data were compiled from two experiments. *P < 0.05, **P < 0.01, and ***P < 0.005 by Student’s t test unless otherwise indicated.
Fig. S9.
Fig. S9.
Erdr1 influences cell survival during EAE. (A) Schematic of experimental design shown in Fig. 5. Rag−/− animals were provided with Erdr1-overexpressing, Erdr1 shRNA, or control 2D2 cells and subsequently immunized with MOG + CFA. (B) Percentage of live (Annexin V−7AAD−) total cells in the spleens of animals after RBC lysis. (C) Fas-expressing cells from the spleens of animals from Fig. 5 HL as measured by flow cytometry. Data are compiled from three independent experiments with a total of 9–10/group. *P < 0.05. Statistical significance was determined by Student’s t test.

Similar articles

Cited by

References

    1. Wu HJ, et al. Gut-residing segmented filamentous bacteria drive autoimmune arthritis via T helper 17 cells. Immunity. 2010;32:815–827. - PMC - PubMed
    1. Lee YK, Menezes JS, Umesaki Y, Mazmanian SK. Proinflammatory T-cell responses to gut microbiota promote experimental autoimmune encephalomyelitis. Proc Natl Acad Sci USA. 2011;108:4615–4622. - PMC - PubMed
    1. Hsiao EY, et al. Microbiota modulate behavioral and physiological abnormalities associated with neurodevelopmental disorders. Cell. 2013;155:1451–1463. - PMC - PubMed
    1. Mazmanian SK, Liu CH, Tzianabos AO, Kasper DL. An immunomodulatory molecule of symbiotic bacteria directs maturation of the host immune system. Cell. 2005;122:107–118. - PubMed
    1. Dobber R, Hertogh-Huijbregts A, Rozing J, Bottomly K, Nagelkerken L. The involvement of the intestinal microflora in the expansion of CD4+ T cells with a naive phenotype in the periphery. Dev Immunol. 1992;2:141–150. - PMC - PubMed

Publication types

Substances