. 2017 Jun 27;8(26):42648-42663.
doi: 10.18632/oncotarget.17337.

Naoling decoction restores cognitive function by inhibiting the neuroinflammatory network in a rat model of Alzheimer's disease

Affiliations

Naoling decoction restores cognitive function by inhibiting the neuroinflammatory network in a rat model of Alzheimer's disease

Zian Xia et al. Oncotarget. .

Abstract

Neuroinflammation is central to the pathogenesis of Alzheimer's disease (AD). We previously showed that Naoling decoction (NLD), a traditional Chinese medicine, was effective against AD, acting by inhibiting expression of IL-1β and IL-6. In the present study, we generated the rat model of AD by injecting Aβ1-42 peptide intracerebroventricularly and evaluated the dose-dependent effects of NLD treatment. The NLD-treated rats exhibited significant improvements in cognitive function as evaluated by the Morris water maze test. Golgi-Cox staining revealed that NLD treatment dose-dependently increased dendritic spines in the CA1 region, which were diminished in vehicle-treated rats. Further, NLD treatment normalized hippocampal Chromogranin A levels, which were elevated by Aβ1-42 induction. NLD also attenuated activation of microglia and astrocytes induced by Aβ1-42. Subsequently, NLD dose-dependently reduced levels TNF-α, IL-1β and IL-6 by inhibiting the NF-κB signaling pathway and the ASC-dependent inflammasome in the hippocampus. These findings reveal that NLD is a promising therapeutic agent that exerts inhibitory effects at multiple sites within the neuroinflammatory network induced in AD.

Keywords: Alzheimer’s disease; Chromogranin A; Naoling decoction; amyloid-beta (Aβ) deposits; neuroinflammatory network.


Conflict of interest statement

CONFLICTS OF INTEREST

The authors declare no conflicts of interest.

Figures

Figure 1
Figure 1. Liquid chromatography-mass spectrometry quadrapole time of flight (LC/MS-Q-TOF) analysis of Icariin and 2,3,5,4′-tetrahydroxystilbene-2-O-β-D-glucopyranoside (THSG)
(A) LC/MS-Q-TOF TIC chromatograms of NLD in the negative ESI mode. (B) LC/MS-Q-TOF EIC chromatograms of THSG in the negative ESI mode showing m/z ratio as 405.12 (top right graph). (C) LC/MS-Q-TOF EIC chromatograms of icariin in the negative ESI mode showing m/z ratio as 721.23 (top right graph).
Figure 2
Figure 2. Effect of NLD on cognitive outcomes in Aβ1-42-infused rat model
(A) Rats that were intracerebroventricularly injected with Aβ1-42 were administered NLD (NLD-L group: 9 g/kg; NLD-M group: 27 g/kg; NLD-H group: 54 g/kg) or an equivalent amount of saline (vehicle group) by oral gavage each day. Meanwhile, sham group rats received equal amount of saline orally. The Morris water maze (MWM) test was performed on all groups of rats to evaluate the cognitive function from the 28th to the 32nd day. The NLD group rats demonstrated significant improvements in the hidden platform tests compared to vehicle group rats (p < 0.01 for the group) and learning time. (B) The probe tests on the 32nd day showed that NLD treated rats showed significantly longer residence time in the target quadrant compared with the vehicle group (all p < 0.05). No differences in visible platform performance were noted (n = 8/group). (C) Representative images of the swim paths of different rat groups in the hidden platform testing on the 32nd day. (D) Representative images of the swim paths of different rat groups in the probe test. The data of escape latency was analyzed by two-way ANOVA, whereas the data from probe test were analyzed by one-way ANOVA. All data are presented as the mean ± SEM. *p < 0.05, **p < 0.01 compared to the vehicle group.
Figure 3
Figure 3. Effects of NLD on dendritic spines of neuron and release of Chromogranin A (CGA) in Aβ1-42-infused rat model
(A) The representative images of Golgi-Cox stained dendritic spines in sham, vehicle, NLD-L, NLD-M and NLD-H rat groups n = 3/group). (B) A representative image of Golgi-Cox staining of the hippocampal CA1 subregion in vehicle rat group infused with Aβ1-42 only. (C) The dendritic spine density in the 5 rat groups. The pyramidal neurons with countable morphology were selected from CA1 subregion (sham: n = 25, vehicle: n = 18, NLD-L: n = 21, NLD-M: n = 23, and NLD-H: n = 20) and the spine numbers were counted in three to four dendrites per neuron (dendritic spine density = spine numbers/dendritic length). Rats from vehicle group showed significantly reduced the dendritic spine density compared to the sham group (vehicle group: 18.95 ± 2.52 spines/10 μm, n = 18; sham group: 26.74 ± 2.18 spines/10 μm, n = 25; p < 0.01). Rats treated with NLD showed dose-dependent enhancement in dendritic spine density compared with the vehicle group (NLD-L group: 21.06 ± 0.79 spines/10 μm, n = 21; NLD-M group: 22.28 ± 1.95 spines/10 μm, n = 23; NLD-H group: 24.83 ± 1.54 spines/10 μm, n = 20; all p < 0.05). (D) Representative western blot image of CGA expression in hippocampus from the 5 rat groups. (E) Quantitative analysis of hippocampal CGA in different groups. The data are represented as the percentage of sham group (n = 6/group). (F) The qRT-PCR analysis of CGA mRNA in the hippocampus from different groups. Data are presented relative to the sham group (n = 6/group). NLD groups demonstrate decreased CGA protein and mRNA levels in hippocampus compared with the vehicle group. Significant differences in NLD-H versus NLD-L/NLD-M are also noted. The data were analyzed by one-way ANOVA and presented as the mean ± SEM. *p < 0.05, **p < 0.01 vs. the vehicle group. #p < 0.05 vs. the NLD-H group.
Figure 4
Figure 4. NLD inhibits microglial activation in hippocampus after intracerebroventricular injection of Aβ1-42
(A) The representative immunohistochemistry images of IBA-1 in sham, vehicle, NLD-L, NLD-M, and NLD-H groups (n = 3/group). The images from the first column show the total hippocampus (40× magnification). The selected CA1 and CA3 regions using black frames were enlarged 10 times and shown in the second and third column, respectively. The red arrows indicate the activated microglia. (B) A representative western blot image of IBA-1 expression in hippocampus from different groups. (C) Quantitative analysis of IBA-1 in hippocampus from each group. The data are represented as the relative percentage of sham group (n = 6/group). All the NLD groups significantly reduced the upregulation of IBA-1 induced by Aβ1-42infusion. Marked differences between NLD groups (NLD-L and NLD-M vs. NLD-H) were also observed. All data were analyzed by one-way ANOVA and presented as the mean ± SEM. *p < 0.05, **p < 0.01 vs. the vehicle group. #p < 0.05 vs. the NLD-H group.
Figure 5
Figure 5. NLD inhibits astrocyte activation in hippocampus after intracerebroventricular injection of Aβ1-42
(A) The representative immunohistochemistry images of GFAP in sham, vehicle, NLD-L, NLD-M, and NLD-H groups (n = 3/group). The images from first column showed the total hippocampus (40 × magnification). The selected CA1 and CA3 regions using black frames were enlarged 10 times and exhibited in the second and third column, respectively. The red arrows indicate the activated astrocytes. (B) A representative western blot image of GFAP expression in hippocampus from different groups. (C) Quantitative analysis of GFAP in hippocampus from different groups. The data are represented as the relative percentage to the sham group (n = 6/group). Only NLD-H group significantly reduced the upregulation of GFAP after Aβ1-42 infusion. The data were analyzed by one-way ANOVA and are presented as the mean ± SEM. *p < 0.05, **p < 0.01 vs. the vehicle group.
Figure 6
Figure 6. NLD inhibits expression of pro-inflammatory cytokines TNF-α, IL-1β and IL-6 in the hippocampus after intracerebroventricular injection of Aβ1-42
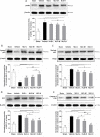
(A) Representative western blot images of TNF-α, IL-1β and IL-6 expression in hippocampus from different groups. (B, D, F) The expression levels of TNF-α, IL-1β and IL-6 proteins in the 5 groups of rats. (C, E, G) The expression levels of TNF-α, IL-1β and IL-6 mRNA in the 5 groups of rats. Aβ1-42 injection into the paracele significantly increased levels of TNF-α, IL-1β, IL-6 proteins and mRNA in the hippocampus of vehicle rats. NLD groups significantly reduced the increased protein and mRNA levels of TNF-α, IL-1β and IL-6, except for the IL-6 protein levels in the NLD-L group. There were significant differences between NLD-L group and NLD-H group in TNF-α, IL-1β and IL-6 protein and TNF-α and IL-6 mRNA. Also, significant differences between NLD-M group and NLD-H group were observed in the protein and mRNA expression of TNF-α. The data were analyzed by one-way ANOVA and are presented as the mean ± SEM. *p < 0.05, **p < 0.01 vs. the vehicle group. #p < 0.05, ##p < 0.01 vs. the NLD-H group.
Figure 7
Figure 7. NLD inhibits the NF-κB signaling pathway and ASC-depending inflammasome in the hippocampus after intracerebroventricular injection of Aβ1-42
Representative western blots and quantitative analysis of the effects of NLD treatment on (A) pIκBα. (B) cytoplasmic p65. (C) nuclear p65 (D) ASC and (E) caspase1 p20 proteins in the hippocampus on the 32nd day after Aβ1-42 infusion. The expression of pIκBα, nuclear p65, ASC and caspase 1 p20 were increased markedly in vehicle group compared with the sham group, and significantly decreased in the NLD groups except for pIκBα expression in the NLD-L group. On the contrary, the cytoplasmic p65 was markedly reduced in vehicle group compared with the sham group, whereas NLD groups showed significantly higher cytoplasmic p65 than the vehicle group. Significant differences between NLD-H and NLD-L group were also observed in pIκBα, cytoplasmic/nuclear p65, ASC and caspase1 p20 levels. There were significant differences in cytoplasmic p65 and caspase1 p20 levels between NLD-M and NLD-H groups, as well as ASC and caspase1 p20 levels between NLD-M and NLD-L groups. PCNA and β-actin were used as controls for nuclear and cytoplasmic p65, respectively. The quantitative data is represented as the relative percentage to the sham group (n = 6/group). The data were analyzed by one-way ANOVA and are presented as the mean ± SEM. *p < 0.05, **p < 0.01 vs. the vehicle group. #p < 0.05, ##p < 0.01 vs. the NLD-H group. & p < 0.05 NLD-H vs. NLD-M group.
Figure 8
Figure 8. The pathological inflammatory network in the AD brain and the anti-inflammatory effects of NLD
During AD, the formation of Aβ deposits not only stimulates the activation and aggregation of microglia and astrocytes, but also triggers the neuronal injury and synaptic damage, which induces a progressive neuritic dystrophy. This dystrophy of the neurons results in the over-production of Chromogranin A (CGA), which is released by exocytosis of secretory granules. CGA potentiates the microglial activation and the release of pro-inflammatory cytokines ( TNF-α, IL-1β and IL-6) by binding to class A scavenger receptor (SRA) and Toll-like receptor 4 (TLR4). The astrocytes surrounding the Aβ deposits sense the TNF-α and IL-1β by TNF receptor 1 (TNFR1) and IL1 type I receptor (IL1RI), respectively, which leads to prolonged activation leading to neuroinflammatory responses through the released inflammatory factors. In turn, these pro-inflammatory cytokines contribute to the further neuritic dystrophy. NLD significantly suppressed the vicious inflammatory response in the hippocampus after intracerebroventricular injection of Aβ by protecting neurons against synaptic damage, reducing the production of CGA, and suppressing the activation and aggregation of microglia and the astrocytes. NLD also inhibits activation of the NF-κB signaling pathway and the ASC-dependent inflammasome (including NLRP3 in microglia, IPAF in astrocytes and NLRP1 in neurons) and associated caspase-1/IL-1β axis by lowering levels of pIκBα, nuclear p65, ASC and caspase 1 p20 following Aβ-infusion, resulting in reduced production of pro-inflammatory factors and thereby exerting anti-inflammatory effects.

Similar articles

Cited by

References

    1. Scheltens P, Blennow K, Breteler MM, de Strooper B, Frisoni GB, Salloway S, Van der Flier WM. Alzheimer's disease. Lancet. 2016 doi: 10.1016/s0140-6736(15)01124-1. - DOI - PubMed
    1. Ritchie CW, Molinuevo JL, Truyen L, Satlin A, Van der Geyten S, Lovestone S. Development of interventions for the secondary prevention of Alzheimer's dementia: the European Prevention of Alzheimer's Dementia (EPAD) project. The Lancet Psychiatry. 2016;3:179–86. doi: 10.1016/s2215-0366(15)00454-x. - DOI - PubMed
    1. Baek H, Ye M, Kang GH, Lee C, Lee G, Choi DB, Jung J, Kim H, Lee S, Kim JS, Lee HJ, Shim I, Lee JH, et al. Neuroprotective effects of CD4+CD25+Foxp3+ regulatory T cells in a 3xTg-AD Alzheimer's disease model. Oncotarget. 2016;7:69347–69357. doi: 10.18632/oncotarget.12469. - DOI - PMC - PubMed
    1. Yang B, Xia ZA, Zhong B, Xiong X, Sheng C, Wang Y, Gong W, Cao Y, Wang Z, Peng W. Distinct Hippocampal Expression Profiles of Long Non-coding RNAs in an Alzheimer's Disease Model. Mol Neurobiol. 2016 doi: 10.1007/s12035-016-0038-5. - DOI - PMC - PubMed
    1. Calsolaro V, Edison P. Neuroinflammation in Alzheimer's disease: Current evidence and future directions. Alzheimers Dement. 2016;12:719–32. doi: 10.1016/j.jalz.2016.02.010. - DOI - PubMed

Substances