. 2017 May 9;7(1):1639.
doi: 10.1038/s41598-017-01820-2.

GIRK2 splice variants and neuronal G protein-gated K+ channels: implications for channel function and behavior

Affiliations

GIRK2 splice variants and neuronal G protein-gated K+ channels: implications for channel function and behavior

Ezequiel Marron Fernandez de Velasco et al. Sci Rep. .

Abstract

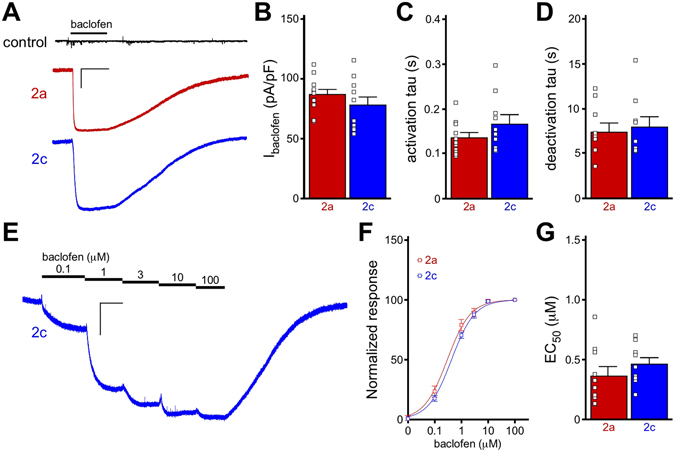
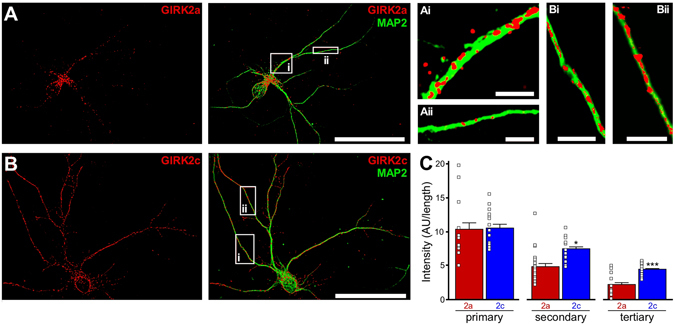
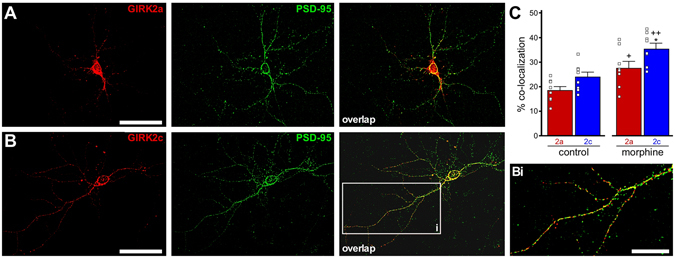
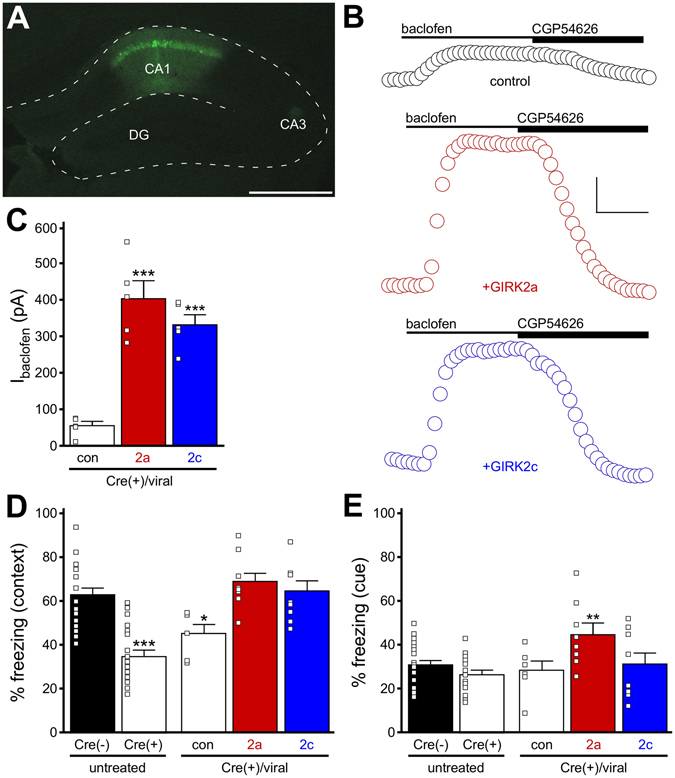
Many neurotransmitters directly inhibit neurons by activating G protein-gated inwardly rectifying K+ (GIRK) channels, thereby moderating the influence of excitatory input on neuronal excitability. While most neuronal GIRK channels are formed by GIRK1 and GIRK2 subunits, distinct GIRK2 isoforms generated by alternative splicing have been identified. Here, we compared the trafficking and function of two isoforms (GIRK2a and GIRK2c) expressed individually in hippocampal pyramidal neurons lacking GIRK2. GIRK2a and GIRK2c supported comparable somato-dendritic GIRK currents in Girk2 -/- pyramidal neurons, although GIRK2c achieved a more uniform subcellular distribution in pyramidal neurons and supported inhibitory postsynaptic currents in distal dendrites better than GIRK2a. While over-expression of either isoform in dorsal CA1 pyramidal neurons restored contextual fear learning in a conditional Girk2 -/- mouse line, GIRK2a also enhanced cue fear learning. Collectively, these data indicate that GIRK2 isoform balance within a neuron can impact the processing of afferent inhibitory input and associated behavior.


Conflict of interest statement

The authors declare that they have no competing interests.

Figures

Figure 1
Figure 1
Functional comparison of GIRK2a and GIRK2c in HEK cells. (A) Whole-cell currents (Vhold = −70 mV) evoked by baclofen (100 μM) in HEK cells expressing GABABR, GIRK1, and either GIRK2a (red) or GIRK2c (blue). No current was evoked by baclofen in cells expressing only GABABR (control, black). Scale: 500 pA/10 s. (B) Summary of baclofen-induced, steady-state current densities (Ibaclofen, pA/pF) in HEK cells expressing GIRK1/GIRK2a or GIRK1/GIRK2c (t 19 = 1.1, P = 0.29; n = 10–11/group). Individual data points are represented as small squares overlapping the relevant bar in the plot. (C,D) Activation (t 19 = 1.5, P = 0.16) and deactivation (t 16 = 0.4, P = 0.72) kinetics for baclofen-induced currents in HEK cells expressing GIRK1/GIRK2a or GIRK1/GIRK2c (n = 9–11/group). (E) Representative concentration-response experiment for a HEK cell expressing GABABR and GIRK1/GIRK2c. Scale: 500 pA/10 s. (F,G) Summary of concentration-response experiments for baclofen-induced currents in HEK cells expressing GIRK1/GIRK2a or GIRK1/GIRK2c (t 17 = 1.0, P = 0.32; n = 9–10/group). Currents were normalized to the response evoked by 100 μM baclofen in each experiment.
Figure 2
Figure 2
GIRK2 expression in the mouse hippocampus. (A) Girk2a and Girk2c mRNA levels as assessed by RNA-Seq in CA1 cell body and neuropil samples, taken from 3 adult mice. Main effects of isoform (F1,8 = 14.3, P < 0.01) and compartment (F1,8 = 27.1, P < 0.001) were observed, but there was no interaction between isoform and compartment (F1,8 = 0.07, P = 0.80). Symbols: *P < 0.05 vs. GIRK2a (within compartment); +,++ P < 0.05 and 0.01, respectively, vs. cell body (within isoform). (B) Representative GIRK2 immunoblots (from 3 independent experiments) of adult hippocampus and neonatal hippocampal culture (10–12 DIV) from wild-type (WT) and Girk2 −/− mice, probed with pan-GIRK2 or GIRK2c antibodies (upper blots), as well as a β-actin antibody (lower blots). (C,D) Representative images showing GIRK2 immunolabeling (as revealed with the pan-GIRK2 antibody) in cultured hippocampal neurons from wild-type (C) and Girk2 −/− (D) mice. Neurons were co-stained with a MAP2 antibody to highlight neuronal morphology and dendritic processes. Scale bar: 50 microns.
Figure 3
Figure 3
Subcellular distribution of GIRK2a and GIRK2c in Girk2 −/− pyramidal neurons. (A,B) Representative images showing GIRK2 (red) and MAP2 (green) immunolabeling, and their overlay, in Girk2 −/− hippocampal pyramidal neurons expressing either GIRK2a (A) or GIRK2c (B). Scale bars: 50 microns. The insets highlight different densities of GIRK2a and GIRK2c puncta along proximal/primary (Ai,Bi) and distal/secondary (Aii,Bii) dendritic segments. Scale bars: 5 microns. (C) Quantification of GIRK2a and GIRK2c labeling in dendrites from infected Girk2 −/− pyramidal neurons. GIRK2 fluorescence intensity was measured in 2–3 primary (t 27 = 1.4, P = 0.17), secondary (t 29 = 2.1, *P < 0.05), and tertiary (t 27 = 5.2, ***P < 0.001) dendritic segments from 5 different neurons expressing each subunit. Fluorescence intensity is expressed as arbitrary units (AU) normalized to segment length. Only GIRK2 labeling that overlapped directly with the dendritic segment (identified by MAP2 labeling) was quantified in this analysis.
Figure 4
Figure 4
Overlap of GIRK2a and GIRK2c with PSD-95 in pyramidal neurons. (A,B) Representative images showing GIRK2 (red) and PSD-95 (green) immunolabeling, and their overlay, in a Girk2 −/− hippocampal pyramidal neuron expressing GIRK2a (A) or GIRK2c (B). Scale bars: 50 microns. The inset (Bi) highlights the limited overlap between PSD-95 and GIRK2, as demonstrated with GIRK2c. Scale bars: 20 microns. (C) Quantification of overlap between PSD-95 and GIRK2a or GIRK2c, under control conditions and following morphine treatment (n = 8 per isoform and treatment condition). Main effects of isoform (F1,28 = 9.2, P < 0.01) and treatment (F1,28 = 22.1, P < 0.001) were observed, but there was no interaction between isoform and treatment (F1,28 = 0.3, P = 0.60). Symbols: *P < 0.05 vs. GIRK2a (within treatment); +,++ P < 0.05 and 0.01, respectively, vs. control (within isoform).
Figure 5
Figure 5
GPCR-GIRK currents in Girk2 −/− pyramidal neurons expressing GIRK2a or GIRK2c. (A) Whole-cell currents (Vhold = −70 mV) evoked by baclofen (100 μM) in a wild-type pyramidal neuron expressing EGFP (WT, black), as well as Girk2 −/− pyramidal neurons expressing EGFP (Girk2 −/−, gray), GIRK2a (red), or GIRK2c (blue). Scale: 1 nA/5 s. (B) Summary of baclofen-induced, steady-state current densities (pA/pF) in wild-type control and Girk2 −/− pyramidal neurons expressing EGFP, GIRK2a, or GIRK2c (F3,53 = 44.8, P < 0.001; n = 11–16/group). Symbols: ***P < 0.001 vs. WT. (C,D) Summary of activation (C; F2,35 = 19.2, P < 0.001) and deactivation (D) F2,33 = 2.76, P = 0.08) kinetics for baclofen-induced currents in infected wild-type and Girk2 −/− pyramidal neurons. Symbols: ***P < 0.001 vs. WT (n = 11–15 per group). (E) EC50 values for baclofen-induced currents in infected wild-type and Girk2 −/− pyramidal neurons expressing GIRK2a or GIRK2c (F2,17 = 8.84, P < 0.01; n = 6–8/group). Symbols: *,**P < 0.05 and 0.01, respectively, vs. WT. (F) Whole-cell currents evoked by adenosine (10 μM) in a wild-type pyramidal neuron expressing EGFP, as well as Girk2 −/− pyramidal neurons expressing EGFP, GIRK2a, or GIRK2c (Vhold = −70 mV). Scale: 500 pA/5 s. (G) Summary of adenosine-induced, steady-state current densities (Iadenosine, pA/pF) in wild-type control and Girk2 −/− pyramidal neurons expressing EGFP, GIRK2a, or GIRK2c (F3,36 = 32.1, P < 0.001; n = 9–13/group). Symbols: ***P < 0.001 vs. WT. (H) Whole-cell currents evoked by 8-OH-DPAT (10 μM) in a wild-type pyramidal neuron expressing EGFP, as well as Girk2 −/− pyramidal neurons expressing EGFP, GIRK2a, or GIRK2c (Vhold = −70 mV). As currents evoked by 8-OH-DPAT persisted following bath washout, the 5HT1AR-selective antagonist WAY100635 (WAY, 2 μM) was used to demonstrate reversibility of the 8-OH-DAT response. Scale: 500 pA/5 s. (I) Summary of 8-OH-DPAT-induced, steady-state current densities (I8-OH-DPAT, pA/pF) in wild-type control and Girk2 −/− pyramidal neurons expressing EGFP, GIRK2a, or GIRK2c (F3,30 = 7.92, P < 0.001; n = 5–11/group). Symbols: *P < 0.05 vs. WT. (J) Summary of current densities (pA/pF) evoked by 10 μM ML297 (IML297) in wild-type control and Girk2 −/− pyramidal neurons expressing EGFP, GIRK2a, or GIRK2c (F2,12 = 2.0, P = 0.16; n = 5–8/group).
Figure 6
Figure 6
Synaptic GIRK currents in Girk2 −/− neurons expressing GIRK2a and GIRK2c. (A) Image showing EGFP expression in the CA1 region of an organotypic hippocampal slice, taken 7 d after infection with AAV8-hSyn-GIRK2a-IRES-EGFP. The dotted white line highlights key features of slice morphology. Scale bar: 500 microns (inset: 50 microns). (B) Summary of peak baclofen-induced somatodendritic current amplitudes (Ibaclofen) in dorsal CA1 pyramidal neurons, measured 7 d after CA1 infusion of control virus (con) to wild-type (WT) organotypic slices, or GIRK2 expression viruses (2a, 2c) to Girk2 −/− organotypic slices (F2,17 = 1.2, P < 0.01; n = 6–7/group). Symbols *,**P < 0.05 and 0.01, respectively, vs. WT. (C) Slow IPSCs evoked via stimulation of proximal (Schaffer collateral/SC) or distal (perforant path, PP) dendritic fields, in wild-type and Girk2 −/− CA1 pyramidal neurons expressing EGFP, as well as Girk2 −/− CA1 pyramidal neurons expressing GIRK2a or GIRK2c. The stimulus artifact and residual GABAAR-dependent responses were removed for clarity, and the triangles below the traces denote stimulation times. Scale: 100 pA/1 s. (D) Summary plot comparing the ratios of slow IPSC maximal amplitudes evoked by SC and PP stimulation in wild-type CA1 pyramidal neurons expressing EGFP, as well as Girk2 −/− CA1 pyramidal neurons expressing GIRK2a or GIRK2c (F2,37 = 51.9; P < 0.001; n = 6–8/group). Maximal responses evoked by stimulation of SC and PP fields were measured in each neuron, in counterbalanced fashion. Symbols: ***P < 0.001 vs. WT (control) and Girk2 −/− (GIRK2c).
Figure 7
Figure 7
Fear learning in CaMKIICre(+):Girk2 fl/fl mice expressing GIRK2a or GIRK2c. (A) EGFP expression in the dorsal CA1 of a CaMKIICre(+):Girk2 fl/fl mouse, 2 wk after infusion of the AAV8-CaMKIIα-DIO-GIRK2a-IRES-EGFP virus. Scale bar: 500 microns. (B) Representative somato-dendritic currents (Vhold = −60 mV) evoked by baclofen (200 μM) and reversed by the GABABR antagonist CGP54626 (2 μM) in dorsal CA1 pyramidal neurons from CaMKIICre(+):Girk2 fl/fl mice, 2 wk after infusion of Cre-dependent control (con, mCherry), GIRK2a, or GIRK2c virus. Scale: 100 pA/100 s. (C) Summary of baclofen-induced currents in dorsal CA1 pyramidal neurons from CaMKIICre(+):Girk2 fl/fl mice, 2 wk after infusion of Cre-dependent control (con, mCherry), GIRK2a, or GIRK2c virus (F2,11 = 24.3, P < 0.001; n = 4–5/group). Symbols: ***P < 0.001 vs. control. (D) Contextual fear learning in untreated CaMKIICre(−):Girk2 fl/fl mice and CaMKIICre(+):Girk2 fl/fl mice, and in CaMKIICre(+):Girk2 fl/fl mice following infusion of Cre-dependent control (con, mCherry), GIRK2a, or GIRK2c virus in the dorsal CA1 (F4,55 = 14.7, P < 0.001; n = 6–23/group). Symbols: *,***P < 0.05 and 0.001, respectively, vs. Cre(−). (E) Cue fear learning in untreated CaMKIICre(−):Girk2 fl/fl mice and CaMKIICre(+):Girk2 fl/fl mice, and in CaMKIICre(+):Girk2 fl/fl mice following infusion of Cre-dependent control (con, mCherry), GIRK2a, or GIRK2c virus in the dorsal CA1 (F4,55 = 4.0, P < 0.01; n = 6–23/group). Symbols: **P < 0.01 vs. Cre(−).

Similar articles

Cited by

References

    1. Slesinger, P. A. & Wickman, K. Structure to Function of G Protein-Gated Inwardly Rectifying (GIRK) Channels, In International Review of Neurobiology Vol. 123 (eds R. A. Harris & P. Jenner) 365 (Elsevier, 2015).
    1. Lujan R, Aguado C. Localization and targeting of GIRK channels in mammalian central neurons. Int. Rev. Neurobiol. 2015;123:161–200. doi: 10.1016/bs.irn.2015.05.009. - DOI - PubMed
    1. Otmakhova NA, Lisman JE. Contribution of Ih and GABAB to synaptically induced afterhyperpolarizations in CA1: a brake on the NMDA response. J. Neurophysiol. 2004;92:2027–2039. doi: 10.1152/jn.00427.2004. - DOI - PubMed
    1. Lujan R, Marron Fernandez de Velasco E, Aguado C, Wickman K. New insights into the therapeutic potential of GIRK channels. Trends Neurosci. 2014;37:20–29. doi: 10.1016/j.tins.2013.10.006. - DOI - PMC - PubMed
    1. Mayfield J, Blednov YA, Harris RA. Behavioral and genetic evidence for GIRK channels in the CNS: role in physiology, pathophysiology, and drug addiction. Int. Rev. Neurobiol. 2015;123:279–313. doi: 10.1016/bs.irn.2015.05.016. - DOI - PMC - PubMed

Publication types

MeSH terms

Substances