

Silencing "Top-Down" Cortical Signals Affects Spike-Responses of Neurons in Cat's "Intermediate" Visual Cortex
- PMID: 28487637
- PMCID: PMC5404610
- DOI: 10.3389/fncir.2017.00027
Silencing "Top-Down" Cortical Signals Affects Spike-Responses of Neurons in Cat's "Intermediate" Visual Cortex
Abstract
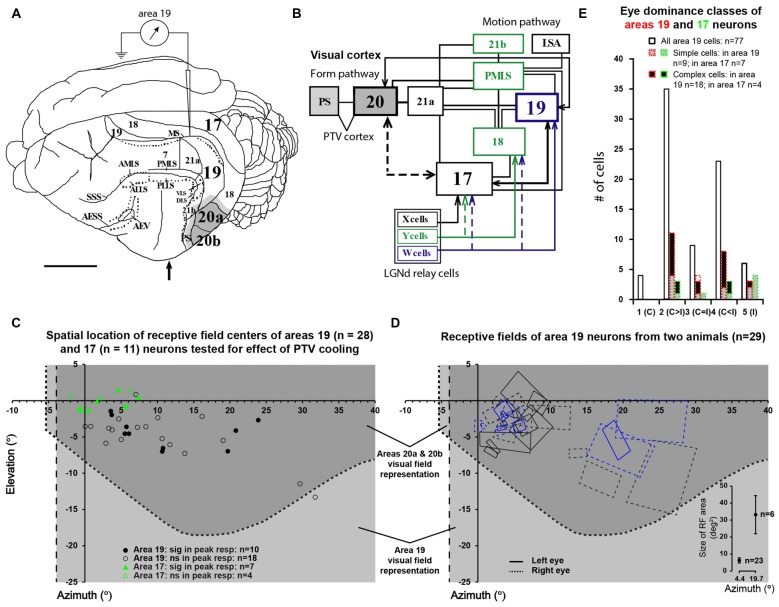
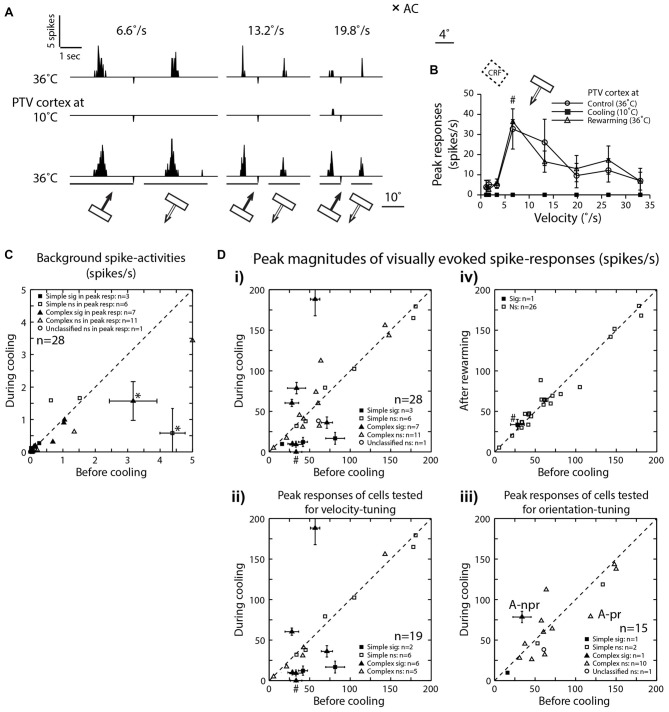
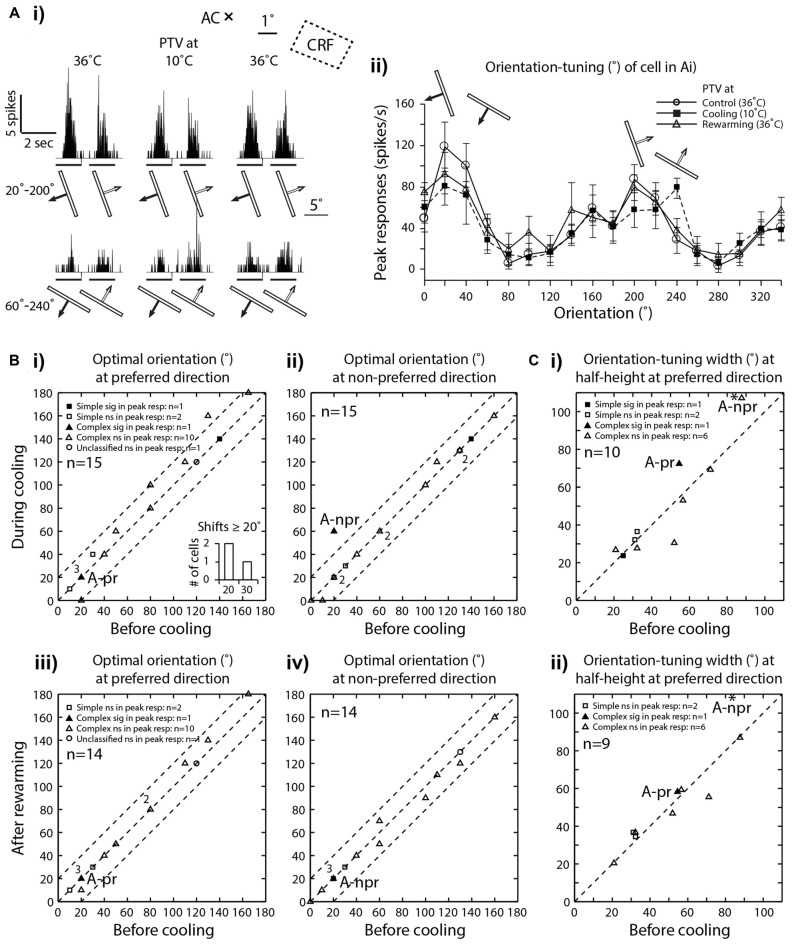
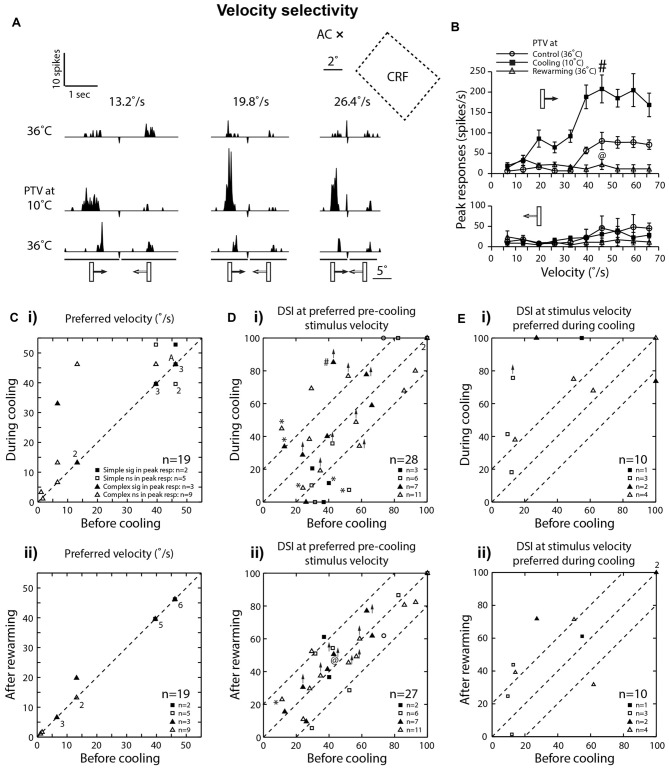
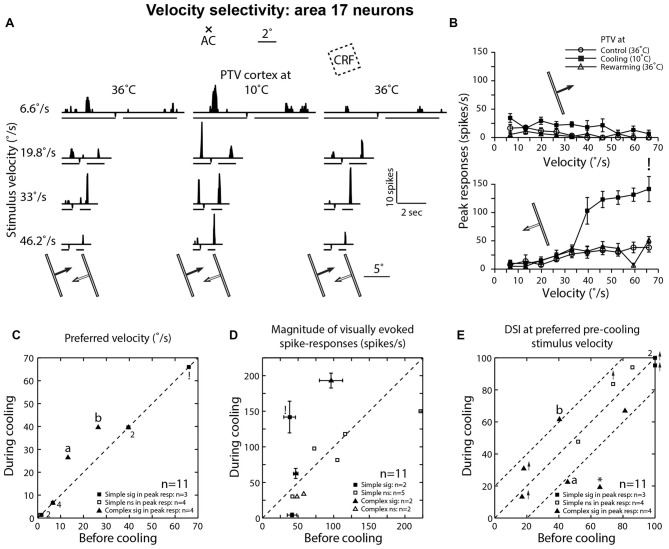
We examined the effects of reversible inactivation of a higher-order, pattern/form-processing, postero-temporal visual (PTV) cortex on the background activities and spike-responses of single neurons in the ipsilateral cytoarchitectonic area 19 (putative area V3) of anesthetized domestic cats. Very occasionally (2/28), silencing recurrent "feedback" signals from PTV, resulted in significant and reversible reduction in background activity of area 19 neurons. By contrast, in large proportions of area 19 neurons, PTV inactivation resulted in: (i) significant reversible changes in the peak magnitude of their responses to visual stimuli (35.5%; 10/28); (ii) substantial reversible changes in direction selectivity indices (DSIs; 43%; 12/28); and (iii) reversible, upward shifts in preferred stimulus velocities (37%; 7/19). Substantial (≥20°) shifts in preferred orientation and/or substantial (≥20°) changes in width of orientation-tuning curves of area 19 neurons were however less common (26.5%; 4/15). In a series of experiments conducted earlier, inactivation of PTV also induced upward shifts in the preferred velocities of the ipsilateral cytoarchitectonic area 17 (V1) neurons responding optimally at low velocities. These upward shifts in preferred velocities of areas 19 and 17 neurons were often accompanied by substantial increases in DSIs. Thus, in both the primary visual cortex and the "intermediate" visual cortex (area 19), feedback from PTV plays a modulatory role in relation to stimulus velocity preferences and/or direction selectivity, that is, the properties which are usually believed to be determined by the inputs from the dorsal thalamus and/or feedforward inputs from the primary visual cortices. The apparent specialization of area 19 for processing information about stationary/slowly moving visual stimuli is at least partially determined, by the feedback from the higher-order pattern-processing visual area. Overall, the recurrent signals from the higher-order, pattern/form-processing visual cortex appear to play an important role in determining the magnitude of spike-responses and some "motion-related" receptive field properties of a substantial proportion of neurons in the intermediate form-processing visual area-area 19.
Keywords: area V3; feedback from higher-order cortices; infero-temporal cortex; peristriate cortex; reversible inactivation.
Figures
Similar articles
-
'Top-down' influences of ipsilateral or contralateral postero-temporal visual cortices on the extra-classical receptive fields of neurons in cat's striate cortex.Neuroscience. 2009 Jan 23;158(2):951-68. doi: 10.1016/j.neuroscience.2008.09.057. Epub 2008 Oct 10. Neuroscience. 2009. PMID: 18976693
-
The effects of reversible inactivation of postero-temporal visual cortex on neuronal activities in cat's area 17.Brain Res. 2007 Mar 23;1138:111-28. doi: 10.1016/j.brainres.2006.12.081. Epub 2007 Jan 8. Brain Res. 2007. PMID: 17276420
-
Influence of 'feedback' signals on spatial integration in receptive fields of cat area 17 neurons.Brain Res. 2010 Apr 30;1328:34-48. doi: 10.1016/j.brainres.2010.02.069. Epub 2010 Mar 3. Brain Res. 2010. PMID: 20206150
-
Contribution of feedforward, lateral and feedback connections to the classical receptive field center and extra-classical receptive field surround of primate V1 neurons.Prog Brain Res. 2006;154:93-120. doi: 10.1016/S0079-6123(06)54005-1. Prog Brain Res. 2006. PMID: 17010705 Review.
-
The contribution of vertical and horizontal connections to the receptive field center and surround in V1.Neural Netw. 2004 Jun-Jul;17(5-6):681-93. doi: 10.1016/j.neunet.2004.05.002. Neural Netw. 2004. PMID: 15288892 Review.
Cited by
-
A Biomorphic Model of Cortical Column for Content-Based Image Retrieval.Entropy (Basel). 2021 Nov 3;23(11):1458. doi: 10.3390/e23111458. Entropy (Basel). 2021. PMID: 34828156 Free PMC article.
-
Effects of top-down influence suppression on behavioral and V1 neuronal contrast sensitivity functions in cats.iScience. 2021 Dec 24;25(1):103683. doi: 10.1016/j.isci.2021.103683. eCollection 2022 Jan 21. iScience. 2021. PMID: 35059603 Free PMC article.
-
Visual Corticocortical Inputs to Ferret Area 18.Front Neuroanat. 2020 Oct 6;14:581478. doi: 10.3389/fnana.2020.581478. eCollection 2020. Front Neuroanat. 2020. PMID: 33117134 Free PMC article.
-
Suppression of top-down influence decreases both behavioral and V1 neuronal response sensitivity to stimulus orientations in cats.Front Behav Neurosci. 2023 Feb 8;17:1061980. doi: 10.3389/fnbeh.2023.1061980. eCollection 2023. Front Behav Neurosci. 2023. PMID: 36844652 Free PMC article.
-
Characterization of Feedback Neurons in the High-Level Visual Cortical Areas That Project Directly to the Primary Visual Cortex in the Cat.Front Neuroanat. 2021 Jan 8;14:616465. doi: 10.3389/fnana.2020.616465. eCollection 2020. Front Neuroanat. 2021. PMID: 33488364 Free PMC article.
References
-
- Bardy C., Huang J. Y., Wang C., FitzGibbon T., Dreher B. (2009). ‘Top-down’ influences of ipsilateral or contralateral postero-temporal visual cortices on the extra-classical receptive fields of neurons in cat’s striate cortex. Neuroscience 158, 951–968. 10.1016/j.neuroscience.2008.09.057 - DOI - PubMed
-
- Batardiere A., Barone P., Dehay C., Kennedy H. (1998). Area-specific laminar distribution of cortical feedback neurons projecting to cat area 17: quantitative analysis in the adult and during ontogeny. J. Comp. Neurol. 396, 493–510. 10.1002/(SICI)1096-9861(19980713)396:4<493::AID-CNE6>3.0.CO;2-X - DOI - PubMed
Publication types
MeSH terms
LinkOut - more resources
Full Text Sources
Other Literature Sources
Miscellaneous