. 2017 Apr 25:11:30.
doi: 10.3389/fncom.2017.00030. eCollection 2017.

Forearm Flexor Muscles in Children with Cerebral Palsy Are Weak, Thin and Stiff

Affiliations

Forearm Flexor Muscles in Children with Cerebral Palsy Are Weak, Thin and Stiff

Ferdinand von Walden et al. Front Comput Neurosci. .

Abstract

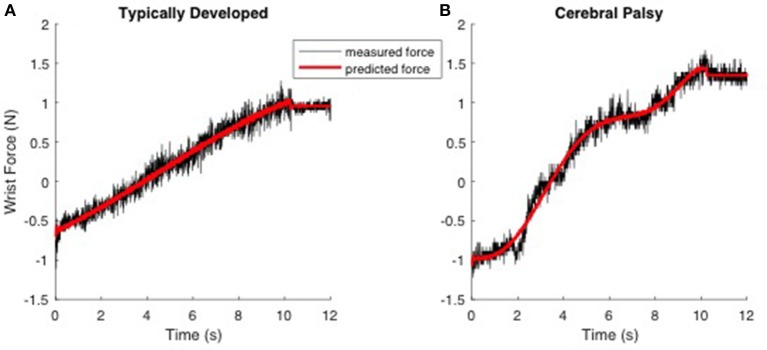
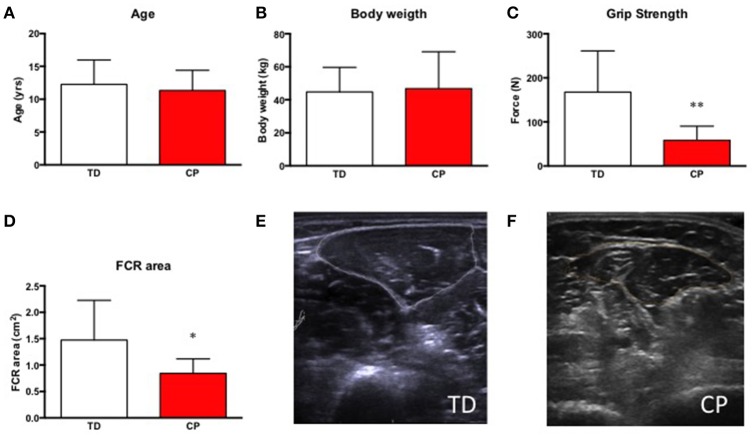
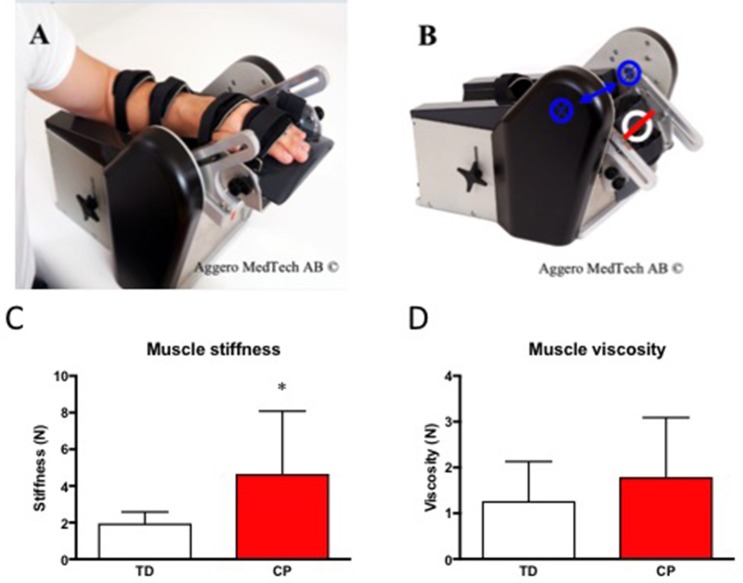
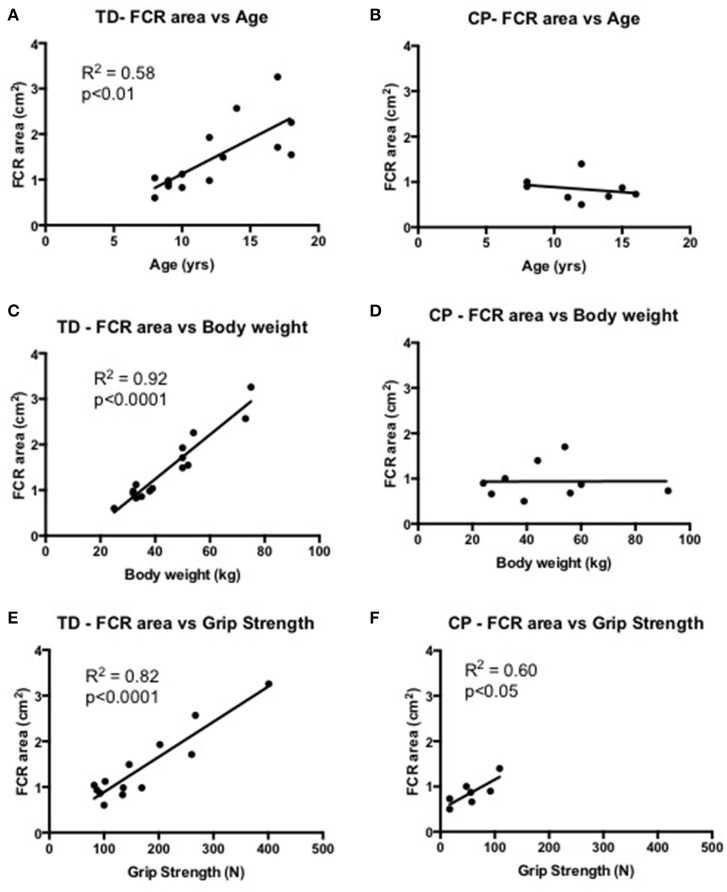
Children with cerebral palsy (CP) often develop reduced passive range of motion with age. The determining factor underlying this process is believed to be progressive development of contracture in skeletal muscle that likely changes the biomechanics of the joints. Consequently, to identify the underlying mechanisms, we modeled the mechanical characteristics of the forearm flexors acting across the wrist joint. We investigated skeletal muscle strength (Grippit®) and passive stiffness and viscosity of the forearm flexors in 15 typically developing (TD) children (10 boys/5 girls, mean age 12 years, range 8-18 yrs) and nine children with CP Nine children (6 boys/3 girls, mean age 11 ± 3 years (yrs), range 7-15 yrs) using the NeuroFlexor® apparatus. The muscle stiffness we estimate and report is the instantaneous mechanical response of the tissue that is independent of reflex activity. Furthermore, we assessed cross-sectional area of the flexor carpi radialis (FCR) muscle using ultrasound. Age and body weight did not differ significantly between the two groups. Children with CP had a significantly weaker (-65%, p < 0.01) grip and had smaller cross-sectional area (-43%, p < 0.01) of the FCR muscle. Passive stiffness of the forearm muscles in children with CP was increased 2-fold (p < 0.05) whereas viscosity did not differ significantly between CP and TD children. FCR cross-sectional area correlated to age (R2 = 0.58, p < 0.01), body weight (R2 = 0.92, p < 0.0001) and grip strength (R2 = 0.82, p < 0.0001) in TD children but only to grip strength (R2 = 0.60, p < 0.05) in children with CP. We conclude that children with CP have weaker, thinner, and stiffer forearm flexors as compared to typically developing children.

Keywords: cerebral palsy; muscle size; muscle stiffness; skeletal muscle; upper limb.


Figures

Figure 1
Figure 1
Typical trials demonstrating the prediction of the measured force using the biomechanical model in response to ramp-and-hold perturbation of 50 degrees with a low velocity (5°/s) experiment. Left; (A) TD. Right; (B) CP. The hand is moving from time 0 to 10 s. Data was recorded for another 2 s (time 10–12 s). The black and red line represents measured and predicted forces, respectively.
Figure 2
Figure 2
(A) Age in years of included research subjects, typically developed children (TD) and children with cerebral palsy (CP). (B) Body weight in kg in TD and CP. (C) Grip strength (N) in TD and CP. **Denotes significantly different from TD, p < 0.01. (D) Cross-sectional area of the flexor carpi radialis muscle (FCR) in cm2 in TD and CP. *Denotes significantly different from TD, p < 0.05. For all bar graphs, TD (white) & CP (red). (E,F) Representative ultrasound images of forearm muscles in TD (E) and CP (F) children. Encircled areas represent FCR.
Figure 3
Figure 3
(A) The NeuroFlexor® with hand at 30° extension. (B) The NeuroFlexor® at 20° Flexion. Blue arrow and crossed rings highlight the axis of rotation. White ring highlights the position of the force sensor. The red line was used to localize the center of the force sensor. (C) Skeletal muscle passive stiffness (N) in TD and CP. *Denotes significantly different from TD, p < 0.05. (D) Skeletal muscle viscosity (N) in TD and CP. For all bar graphs, TD (white) & CP (red). Photos in (A,B) were used with permission from Aggero Medtech AB.
Figure 4
Figure 4
(A,B) Correlational analysis of the flexor carpi radialis muscle (FCR) cross-sectional area (cm2) and age (yrs) in TD (graph A) and CP (graph B). (C,D) Correlational analysis of FCR cross-sectional area (cm2) and body weight (kg) in TD (graph C) and CP (graph D). (E,F) Correlational analysis of FCR cross-sectional area (cm2) and grip strength (N) in TD (graph E) and CP (graph F). R2 and significance level indicated in each graph when relevant.

Similar articles

Cited by

References

    1. Alhusaini A. A., Crosbie J., Shepherd R. B., Dean C. M., Scheinberg A. (2011). No change in calf muscle passive stiffness after botulinum toxin injection in children with cerebral palsy. Dev. Med. Child Neurol. 53, 553–558. 10.1111/j.1469-8749.2011.03930.x - DOI - PubMed
    1. Barber L. A., Read F., Lovatt Stern J., Lichtwark G., Boyd R. N. (2016). Medial gastrocnemius muscle volume in ambulant children with unilateral and bilateral cerebral palsy aged 2 to 9 years. Dev. Med. Child Neurol. 58, 1146–1152. 10.1111/dmcn.13132 - DOI - PubMed
    1. Barber L., Hastings-Ison T., Baker R., Barrett R., Lichtwark G. (2011). Medial gastrocnemius muscle volume and fascicle length in children aged 2 to 5 years with cerebral palsy. Dev. Med. Child Neurol. 53, 543–548. 10.1111/j.1469-8749.2011.03913.x - DOI - PubMed
    1. Barrett R. S., Lichtwark G. A. (2010). Gross muscle morphology and structure in spastic cerebral palsy: a systematic review. Dev. Med. Child Neurol. 52, 794–804. 10.1111/j.1469-8749.2010.03686.x - DOI - PubMed
    1. Booth C. M., Cortina-Borja M. J., Theologis T. N. (2001). Collagen accumulation in muscles of children with cerebral palsy and correlation with severity of spasticity. Dev. Med. Child Neurol. 43, 314–320. 10.1017/S0012162201000597 - DOI - PubMed

LinkOut - more resources