. 2017 Oct;53(2):265-276.
doi: 10.1007/s12016-017-8610-y.

Response to Treatment with TNFα Inhibitors in Rheumatoid Arthritis Is Associated with High Levels of GM-CSF and GM-CSF+ T Lymphocytes

Affiliations

Response to Treatment with TNFα Inhibitors in Rheumatoid Arthritis Is Associated with High Levels of GM-CSF and GM-CSF+ T Lymphocytes

Jonas Bystrom et al. Clin Rev Allergy Immunol. 2017 Oct.

Abstract

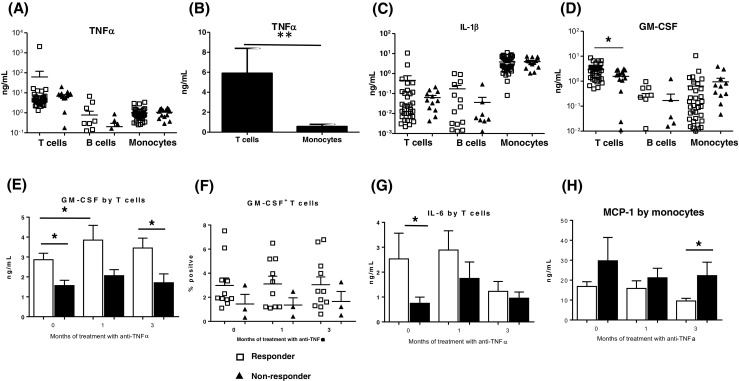
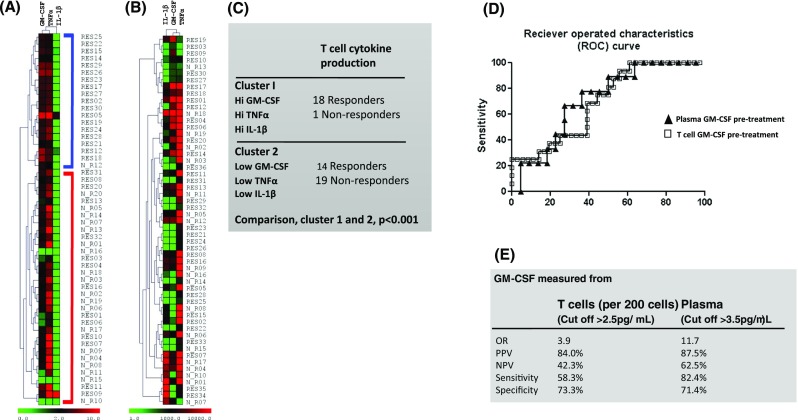
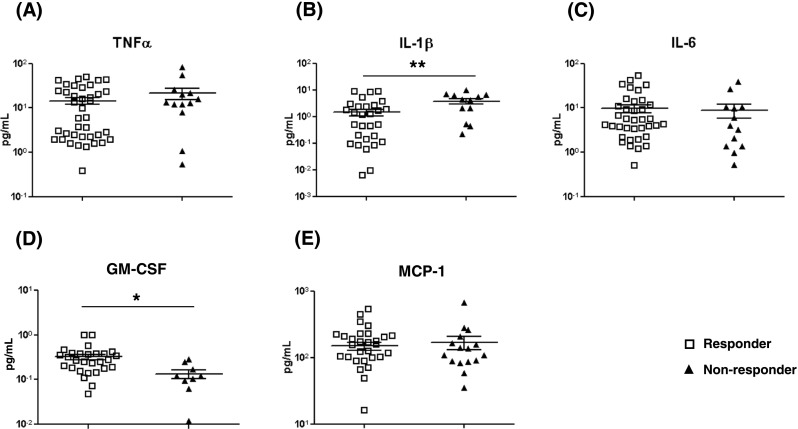
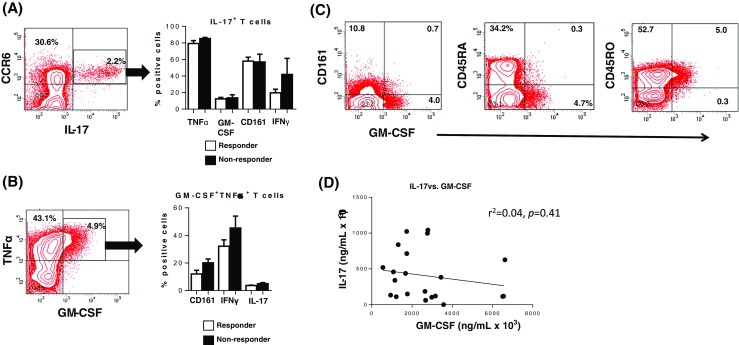
Biologic TNFα inhibitors are a mainstay treatment option for patients with rheumatoid arthritis (RA) refractory to other treatment options. However, many patients either do not respond or relapse after initially responding to these agents. This study was carried out to identify biomarkers that can distinguish responder from non-responder patients before the initiation of treatment. The level of cytokines in plasma and those produced by ex vivo T cells, B cells and monocytes in 97 RA patients treated with biologic TNFα inhibitors was measured before treatment and after 1 and 3 months of treatment by multiplex analyses. The frequency of T cell subsets and intracellular cytokines were determined by flow cytometry. The results reveal that pre-treatment, T cells from patients who went on to respond to treatment with biologic anti-TNFα agents produced significantly more GM-CSF than non-responder patients. Furthermore, immune cells from responder patients produced higher levels of IL-1β, TNFα and IL-6. Cytokine profiling in the blood of patients confirmed the association between high levels of GM-CSF and responsiveness to biologic anti-TNFα agents. Thus, high blood levels of GM-CSF pre-treatment had a positive predictive value of 87.5% (61.6 to 98.5% at 95% CI) in treated RA patients. The study also shows that cells from most anti-TNFα responder patients in the current cohort produced higher levels of GM-CSF and TNFα pre-treatment than non-responder patients. Findings from the current study and our previous observations that non-responsiveness to anti-TNFα is associated with high IL-17 levels suggest that the disease in responder and non-responder RA patients is likely to be driven/sustained by different inflammatory pathways. The use of biomarker signatures of distinct pro-inflammatory pathways could lead to evidence-based prescription of the most appropriate biological therapies for different RA patients.

Keywords: GM-CSF; Rheumatoid arthritis; T lymphocytes; TNFα.


Conflict of interest statement

Conflict of Interest

The authors declare that they have no conflict of interest.

Funding

This study was supported by the Investigator Initiated Research Grant No. WS872934 from Pfizer to Professor Rizgar A. Mageed.

Ethical Approval

The study summarised in this article was approved by the Ethical Committee of the City-East of London and conducted in compliance with the Declaration of Helsinki 2013. Informed consent was obtained from all individual participants included in the study.

Figures

Fig. 1
Fig. 1
Cytokine production by T cells, B cells and monocytes in rheumatoid arthritis patients prior to and after treatment with anti-TNFα. T cells, B cells and monocytes were enriched by negative selection from the blood of RA patients immediately before treatment with anti-TNFα agents and then after 1 and 3 months. The cells were stimulated for 48 h and the level of cytokines produced determined using MSD multiplex kits. Levels of 16 cytokines were determined but only results of cytokines with notable differences are presented: a, b Data on TNFα; c IL-1β and d GM-CSF. a TNFα produced by T cells stimulated with anti-CD3/anti-CD28 mAbs, B cells stimulated with anti-IgM/anti-CD40 and monocytes stimulated with LPS. b Mean ± standard error of the mean (SEM) for TNFα produced by T cells and monocytes from 3 healthy controls and stimulated for 48 h with PMA and ionomycin. c, d Levels of IL-1β and GM-CSF produced by T and B cells and monocytes activated and cultured as described in a. e Data on GM-CSF production by T cells as described for a before treatment (0 months) and after 1 and then 3 months. f Data on the frequency of GM-CSF+ T cells before treatment and after 1 and 3 months in responder and non-responder RA patients. Enriched T cells were stimulated with PMA/ionomycin for 16 h and stained for intracellular GM-CSF. g IL-6 production by T cells and h CCL2 production by monocytes. The data before and after treatment are for 67 patients. Differences between responders and non-responders were assessed using two-tailed Mann Whitney U test. Difference at different time points in the same group was assessed using Wilcoxon matched-pairs signed rank test. Single asterisk indicates P < 0.05; double asterisk indicates P < 0.01
Fig. 2
Fig. 2
Cluster and receiver operating characteristic (ROC) analyses for predictive value of cytokines in the response to anti-TNFα. a, b Cluster analyses of TNFα, IL-1β and GM-CSF in RA patients pre-treatment with anti-TNFα in relation to responsiveness/non-responsiveness. Cluster analyses of GM-CSF, IL-1β and TNFα levels (a) by in vitro activated T cells from responder (RES) and non-responder (N_R) patients whose identity codes are indicated by numbers and (b) in plasma from the same patients. The cluster analyses were performed using Pearson’s correlation with complete linkage. The two clusters in a were highlighted with a blue (cluster 1) and a red (cluster 2) bracket. c Summary of data from the cluster in a. Significant differences between responders and non-responders were calculated using Fisher’s exact test. d ROC curve analyses of the response to treatment with anti-TNFα. The increasing area under the ROC curve (area under the curve, AUC) corresponds to a higher diagnostic test yield. e Summary of sensitivity, specificity and odds ratio (OR) for GM-CSF levels by T cells and in plasma before treatment in predicting the response to treatment with anti-TNFα. PPV positive predictive value, NPV negative predictive value. Data are presented with 95% CI
Fig. 3
Fig. 3
Levels of cytokines in plasma pre-treatment of RA patients with anti-TNFα. Plasma levels of cytokines were determined immediately before treatment with anti-TNFα using MSD multiplex kits. Levels of cytokines shown are for: a TNFα; b IL-1β; c IL-6; d GM-CSF and e MCP-1. Values are presented as the mean ± SEM in the plasma of 40 responder and 13 non-responder patients on whom plasma samples were available. Statistical analyses were with the two-tailed Mann-Whitney U test. Single asterisk indicates P < 0.05; double asterisk indicates P < 0.01
Fig. 4
Fig. 4
GM-CSF+ and IL-17+ T cells segregate into two different subsets. Enriched T cells were stimulated with PMA/Ionomycin for 16 h and stained for membrane proteins and intracellular cytokines as indicated. a Contour plot showing the percentage of CCR6+ and CCR6+IL-17+ in blood CD4+ cells and b TNFα+ and TNF+GM-CSF+ T cells in the blood of RA patients. CCR6+IL-17+ in a were gated and the frequency of T cells expressing intracellular GM-CSF, TNFα and IFNγ+ and membrane CD161 determined by FACS. b PMA/Ionomycin-stimulated T cells were stained for intracellular TNFα and GM-CSF and the frequency in responder and non-responder patients determined. The frequency of TNFα+GM-CSF+ T cells that co-expressed INFγ and IL-17 membrane CD161 was determined by multicolour FACS. The data represent the mean ± SEM values from seven responder and three non-responder patients. c Contour plots showing characteristics of the RA patients GM-CSF+ T cells (expression of CD45RA, CD45RO and CD161) pre-treatment. Percentages of differentially stained cell subsets are given inside the quadrants. d Linear regression showing the correlation between the level of IL-17 and GM-CSF produced by patients’ T cells activated with anti-CD3/anti-CD28 mAbs

Similar articles

Cited by

References

    1. McInnes IB, Schett G. The pathogenesis of rheumatoid arthritis. N Engl J Med. 2011;365(23):2205–2219. doi: 10.1056/NEJMra1004965. - DOI - PubMed
    1. Suzuki A, Kochi Y, Okada Y, Yamamoto K. Insight from genome-wide association studies in rheumatoid arthritis and multiple sclerosis. FEBS Lett. 2011;585(23):3627–3632. doi: 10.1016/j.febslet.2011.05.025. - DOI - PubMed
    1. Elliott MJ, Maini RN, Feldmann M, Long-Fox A, Charles P, Katsikis P, Brennan FM, Walker J, Bijl H, Ghrayeb J, et al. Treatment of rheumatoid arthritis with chimeric monoclonal antibodies to tumor necrosis factor alpha. Arthritis Rheum. 1993;36(12):1681–1690. doi: 10.1002/art.1780361206. - DOI - PubMed
    1. Emery P, Breedveld FC, Hall S, Durez P, Chang DJ, Robertson D, Singh A, Pedersen RD, Koenig AS, Freundlich B. Comparison of methotrexate monotherapy with a combination of methotrexate and etanercept in active, early, moderate to severe rheumatoid arthritis (COMET): a randomised, double-blind, parallel treatment trial. Lancet. 2008;372(9636):375–382. doi: 10.1016/S0140-6736(08)61000-4. - DOI - PubMed
    1. Klarenbeek NB, Allaart CF, Kerstens PJ, Huizinga TW, Dijkmans BA. The BeSt story: on strategy trials in rheumatoid arthritis. Curr Opin Rheumatol. 2009;21(3):291–298. doi: 10.1097/BOR.0b013e32832a2f1c. - DOI - PubMed

MeSH terms

Substances