

Acute pressure changes in the brain are correlated with MR elastography stiffness measurements: initial feasibility in an in vivo large animal model
- PMID: 28488326
- PMCID: PMC5811891
- DOI: 10.1002/mrm.26738
Acute pressure changes in the brain are correlated with MR elastography stiffness measurements: initial feasibility in an in vivo large animal model
Abstract
Purpose: The homeostasis of intracranial pressure (ICP) is of paramount importance for maintaining normal brain function. A noninvasive technique capable of making direct measurements of ICP currently does not exist. MR elastography (MRE) is capable of noninvasively measuring brain tissue stiffness in vivo, and may act as a surrogate to measure ICP. The objective of this study was to investigate the impact of changing ICP on brain stiffness using MRE in a swine model.
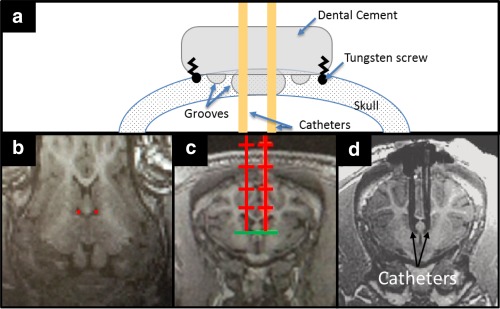
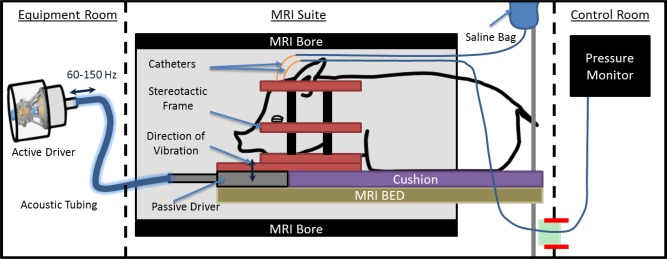
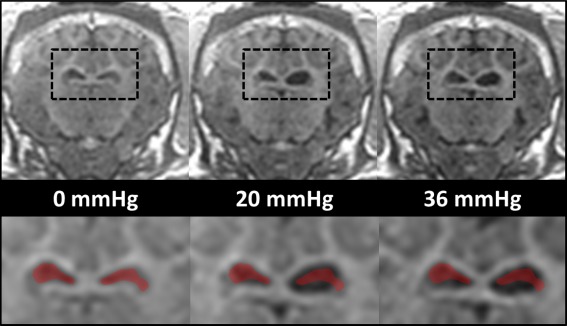
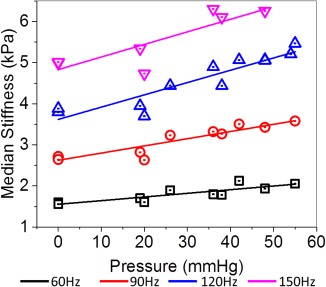
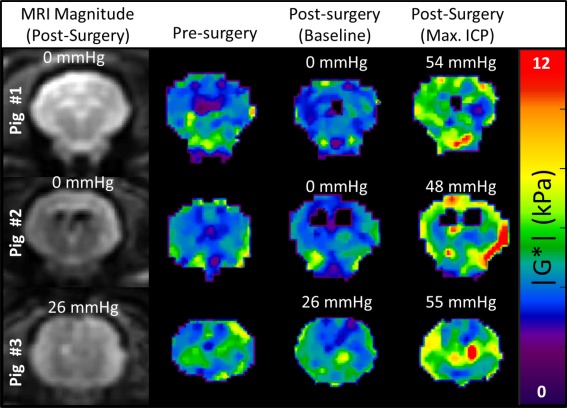
Methods: Baseline MRE measurements were obtained, and then catheters were surgically placed into the left and right lateral ventricles of three animals. ICP was systematically increased over the range of 0 to 55 millimeters mercury (mmHg), and stiffness measurements were made using brain MRE at vibration frequencies of 60 hertz (Hz), 90 Hz, 120 Hz, and 150 Hz.
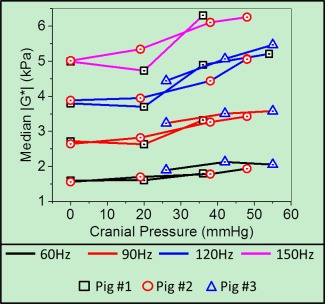
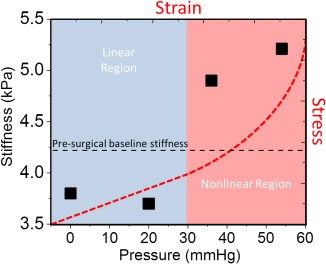
Results: A significant linear correlation between stiffness and ICP in the cross-subject comparison was observed for all tested vibrational frequencies (P ≤ 0.01). The 120 Hz (0.030 ± 0.004 kilopascal (kPa)/mmHg, P < 0.0001) and 150 Hz (0.031 ± 0.008 kPa/mmHg, P = 0.01) vibrational frequencies had nearly identical slopes, which were approximately two- to three-fold higher than the 90 Hz (0.017 ± 0.002 kPa/mmHg, P < 0.0001) and 60 Hz (0.009 ± 0.002 kPa/mmHg, P = 0.001) slopes, respectively.
Conclusion: In this study, MRE demonstrated the potential for noninvasive measurement of changes in ICP. Magn Reson Med 79:1043-1051, 2018. © 2017 The Authors Magnetic Resonance in Medicine published by Wiley Periodicals, Inc. on behalf of International Society for Magnetic Resonance in Medicine. This is an open access article under the terms of the Creative Commons Attribution-NonCommercial-NoDerivs License, which permits use and distribution in any medium, provided the original work is properly cited, the use is non-commercial and no modifications or adaptations are made.
Keywords: brain stiffness; intracranial pressure; magnetic resonance elastography; viscoelasticity.
© 2017 The Authors Magnetic Resonance in Medicine published by Wiley Periodicals, Inc. on behalf of International Society for Magnetic Resonance in Medicine.
Figures
References
-
- Manduca A, Oliphant TE, Dresner MA, Mahowald JL, Kruse SA, Amromin E, Felmlee JP, Greenleaf JF, Ehman RL. Magnetic resonance elastography: non‐invasive mapping of tissue elasticity. Med Image Anal 2001;5:237–254. - PubMed
-
- Xu L, Lin Y, Han JC, Xi ZN, Shen H, Gao PY. Magnetic resonance elastography of brain tumors: preliminary results. Acta Radiol 2007;48:327–330. - PubMed
-
- Streitberger KJ, Wiener E, Hoffmann J, et al. In vivo viscoelastic properties of the brain in normal pressure hydrocephalus. NMR Biomed 2011;24:385–392. - PubMed
Publication types
MeSH terms
Grants and funding
LinkOut - more resources
Full Text Sources
Other Literature Sources
Medical
