. 2017 May 10:8:15378.
doi: 10.1038/ncomms15378.

Climate warming reduces the temporal stability of plant community biomass production

Affiliations

Climate warming reduces the temporal stability of plant community biomass production

Zhiyuan Ma et al. Nat Commun. .

Abstract

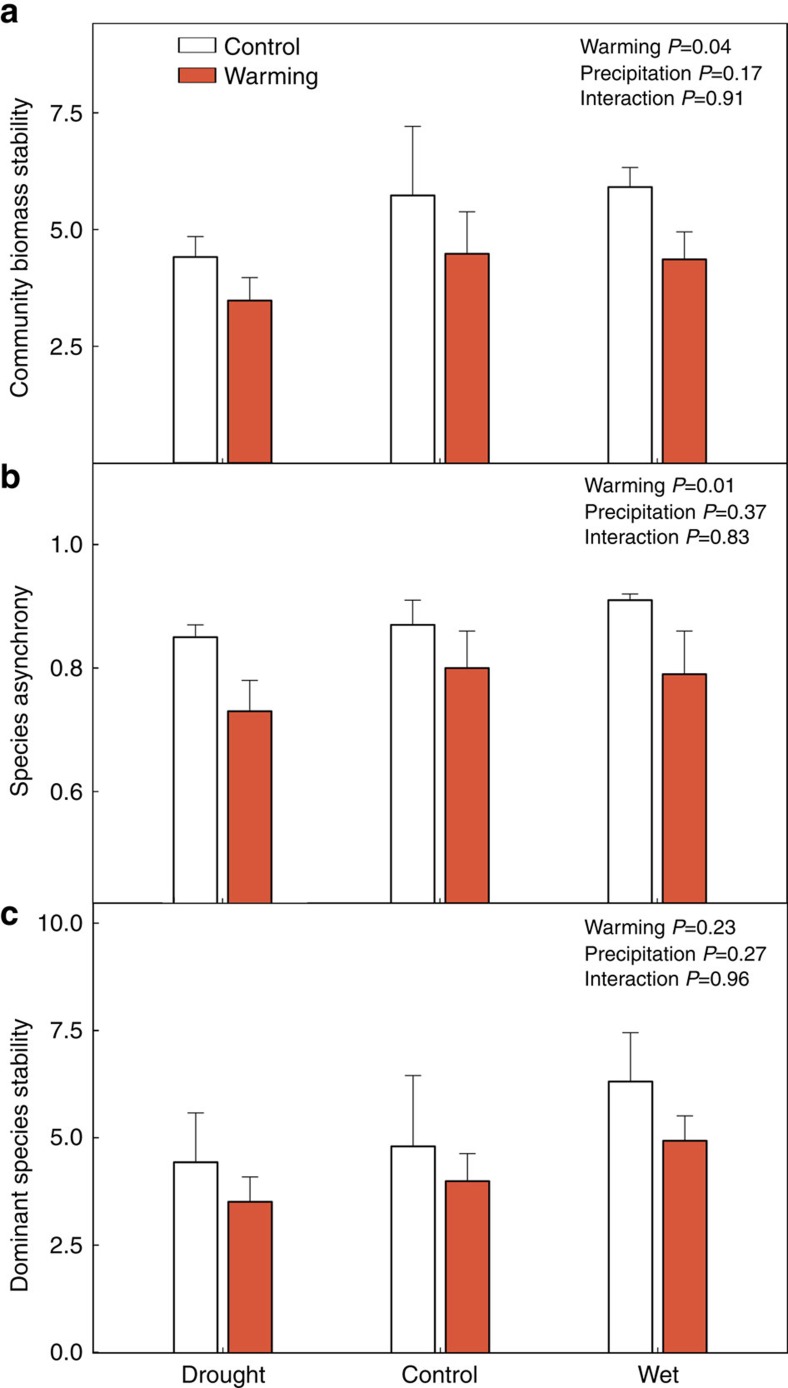
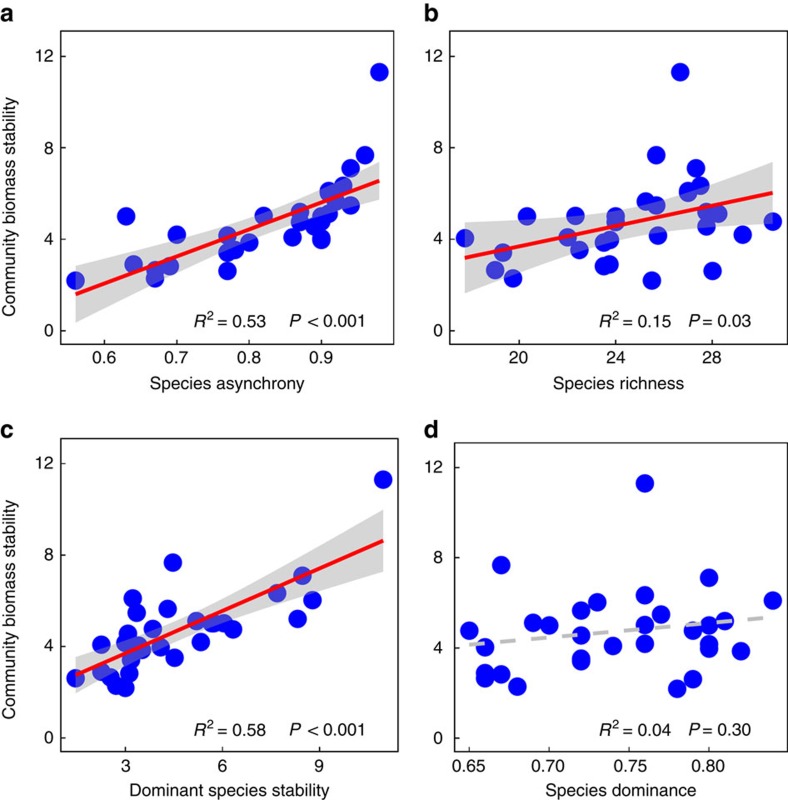
Anthropogenic climate change has emerged as a critical environmental problem, prompting frequent investigations into its consequences for various ecological systems. Few studies, however, have explored the effect of climate change on ecological stability and the underlying mechanisms. We conduct a field experiment to assess the influence of warming and altered precipitation on the temporal stability of plant community biomass in an alpine grassland located on the Tibetan Plateau. We find that whereas precipitation alteration does not influence biomass temporal stability, warming lowers stability through reducing the degree of species asynchrony. Importantly, biomass temporal stability is not influenced by plant species diversity, but is largely determined by the temporal stability of dominant species and asynchronous population dynamics among the coexisting species. Our findings suggest that ongoing and future climate change may alter stability properties of ecological communities, potentially hindering their ability to provide ecosystem services for humanity.


Conflict of interest statement

The authors declare no competing financial interests.

Figures

Figure 1
Figure 1. Community biomass and species diversity in different experimental treatments.
Shown are (a) community biomass (linear mixed-effects model; warming: P=0.84; precipitation: P<0.001; interaction: P=0.02); (b) species richness (linear mixed-effects model; warming: P<0.001; precipitation: P<0.001; interaction: P=0.06); and (c) Simpson's dominance (linear mixed-effects model; warming: P=0.01; precipitation: P=0.01; interaction: P=0.12) in the warming and altered precipitation treatments during the experimental period. Drought, 50% reduction in precipitation compared with control; Wet, 50% increase in precipitation compared with control. Vertical bars represent the s.e.m. (n=5).
Figure 2
Figure 2. Temporal stability and species asynchrony in different experimental treatments.
Shown are (a) community biomass temporal stability (linear mixed-effects model; warming: P=0.04; precipitation: P=0.17; interaction: P=0.91); (b) species asynchrony (linear mixed-effects model; warming: P=0.01; precipitation: P=0.37; interaction: P=0.83); and (c) dominant species stability (linear mixed-effects model; warming: P=0.23; precipitation: P=0.27; interaction: P=0.96) in the warming and altered precipitation treatments during the experimental period. Drought, 50% reduction in precipitation compared with control; Wet, 50% increase in precipitation compared with control. Vertical bars represent the s.e.m. (n=5).
Figure 3
Figure 3. Relationships between ecological factors and community biomass stability.
Shown are (a) species asynchrony (linear regression; P<0.001); (b) species richness (linear regression; P=0.03); (c) dominant species temporal stability (linear regression; P<0.001); and (d) Simpson's dominance (linear regression; P=0.30). The red solid lines are significant regression lines, and the grey dashed lines are nonsignificant regression lines. Each blue circle represents an experimental plot (n=30). Shaded areas represent 95% confidence intervals.
Figure 4
Figure 4. A structural equation model of treatment effects on biomass temporal stability.
The structural equation model considered all plausible pathways through which experimental treatments influence community biomass temporal stability. Red and black arrows represent significant positive and negative pathways, respectively, and grey dashed arrows indicate nonsignificant pathways. Bold numbers indicate the standard path coefficients. Arrow width is proportional to the strength of the relationship. R2 represent the proportion of variance explained for each dependent variable in the model. *P<0.05, **P<0.01, ***P<0.001; χ2=7.27, P=0.03; root mean square error of approximation (RMSEA)=0.30, P=0.03; Akaike information criteria (AIC)=334.90.

References

    1. Pimm S. L. The complexity and stability of ecosystems. Nature 307, 321–326 (1984).
    1. Ives A. R. & Carpenter S. R. Stability and diversity of ecosystems. Science 317, 58–62 (2007). - PubMed
    1. Oliver T. H. et al.. Declining resilience of ecosystem functions under biodiversity loss. Nat. Commun. 6, 10122 (2015). - PMC - PubMed
    1. Hooper D. U. et al.. Effects of biodiversity on ecosystem functioning: a consensus of current knowledge. Ecol. Monogr. 75, 3–35 (2005).
    1. Grman E., Lau J. A., Schoolmaster D. R. & Gross K. L. Mechanisms contributing to stability in ecosystem function depend on the environmental context. Ecol. Lett. 13, 1400–1410 (2010). - PubMed

Publication types