. 2017 May 10:8:15207.
doi: 10.1038/ncomms15207.

Blockade of IDO-kynurenine-AhR metabolic circuitry abrogates IFN-γ-induced immunologic dormancy of tumor-repopulating cells

Affiliations

Blockade of IDO-kynurenine-AhR metabolic circuitry abrogates IFN-γ-induced immunologic dormancy of tumor-repopulating cells

Yuying Liu et al. Nat Commun. .

Abstract

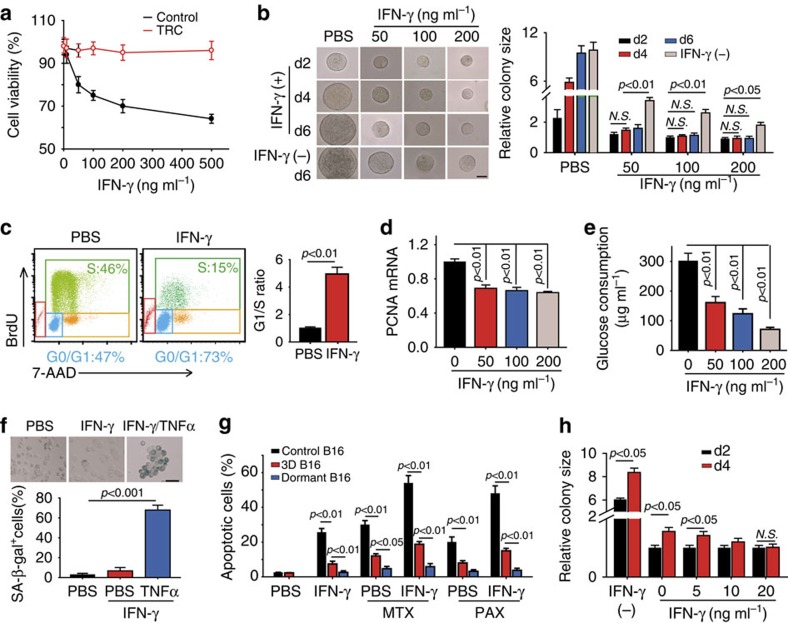
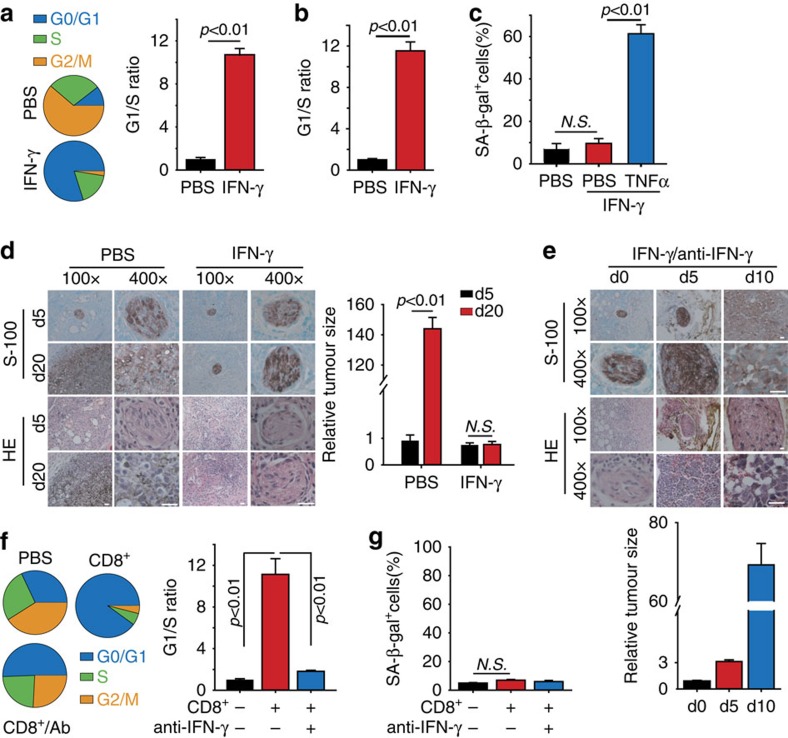
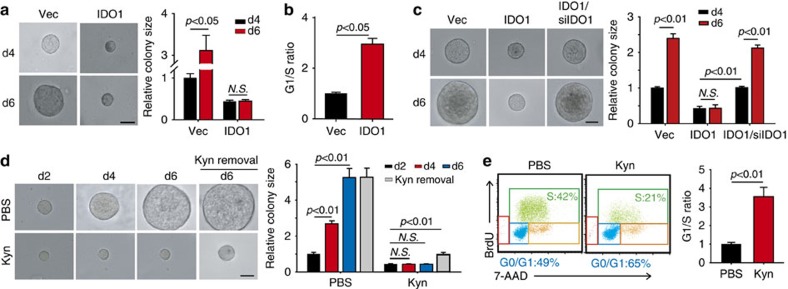
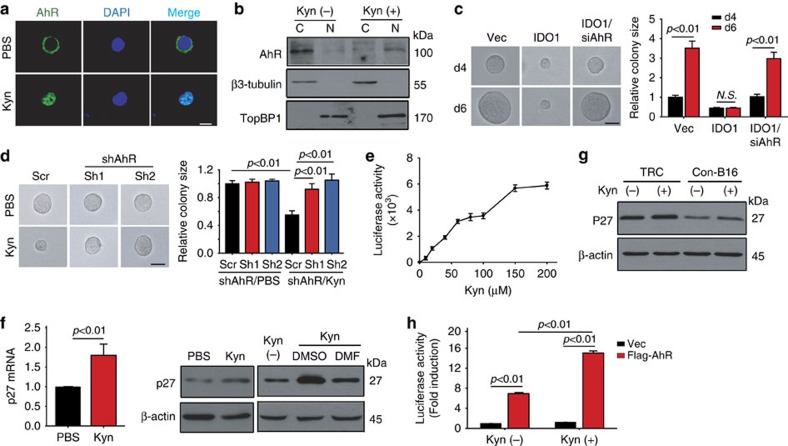
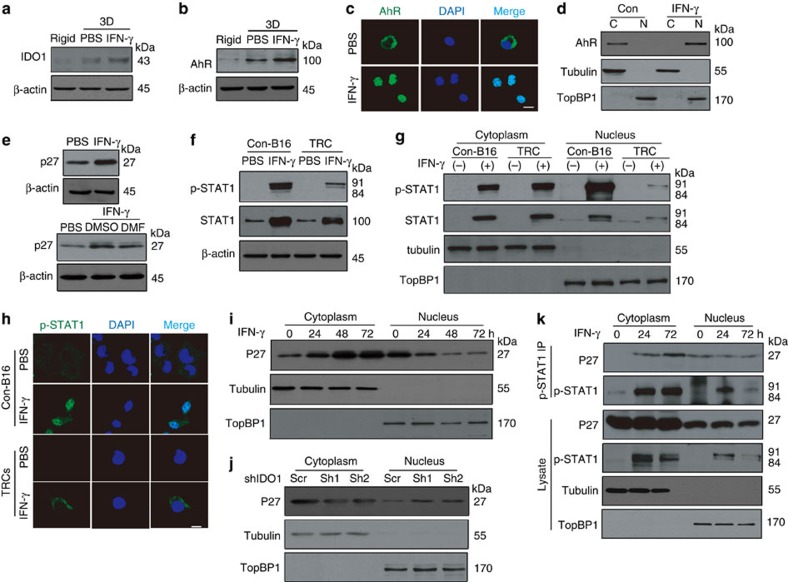
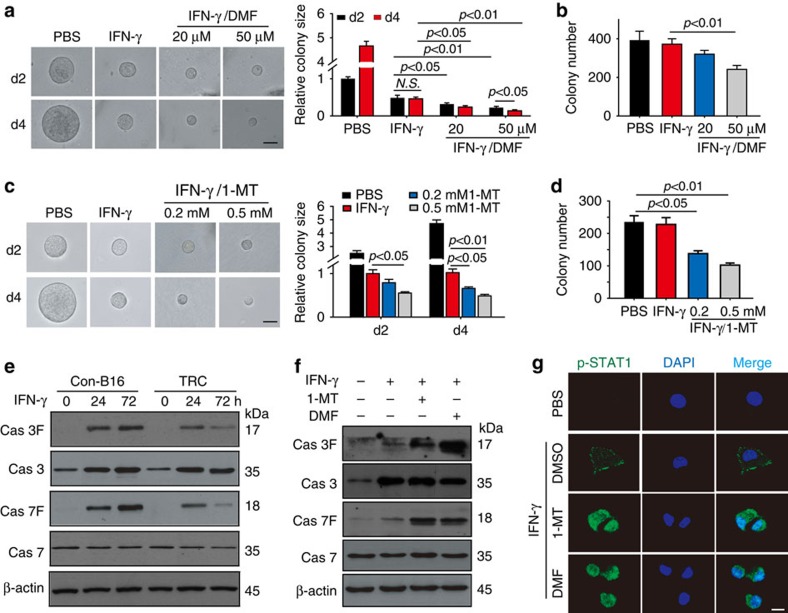
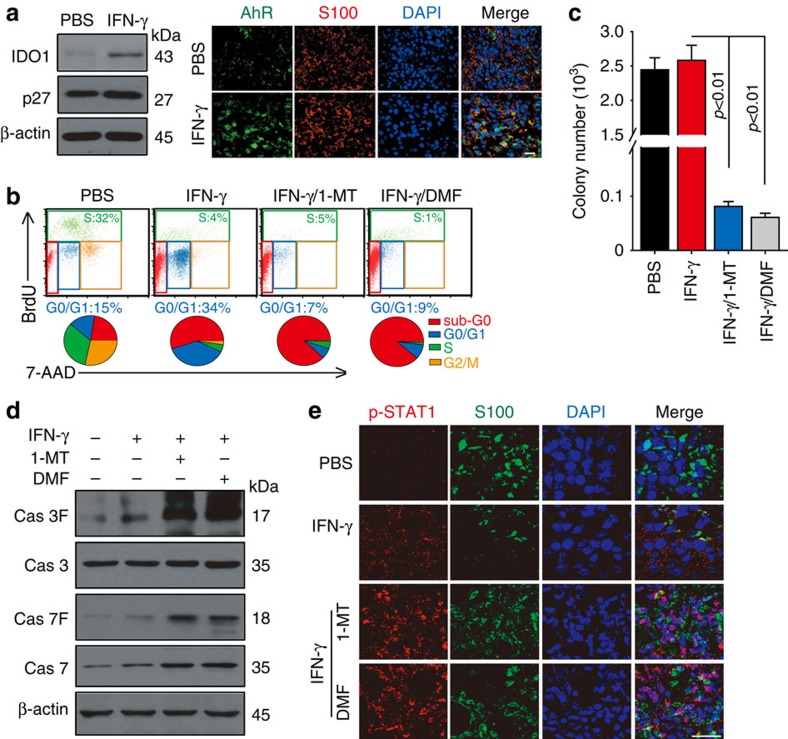
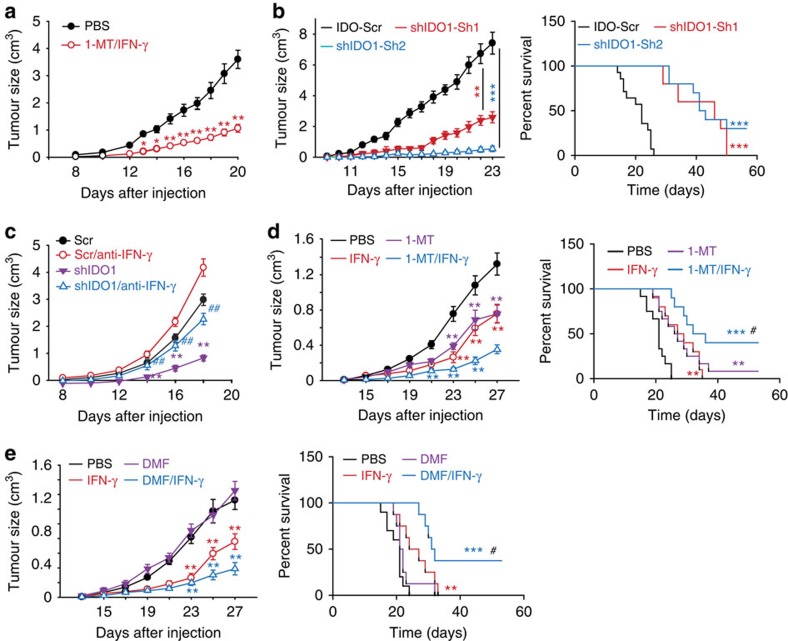
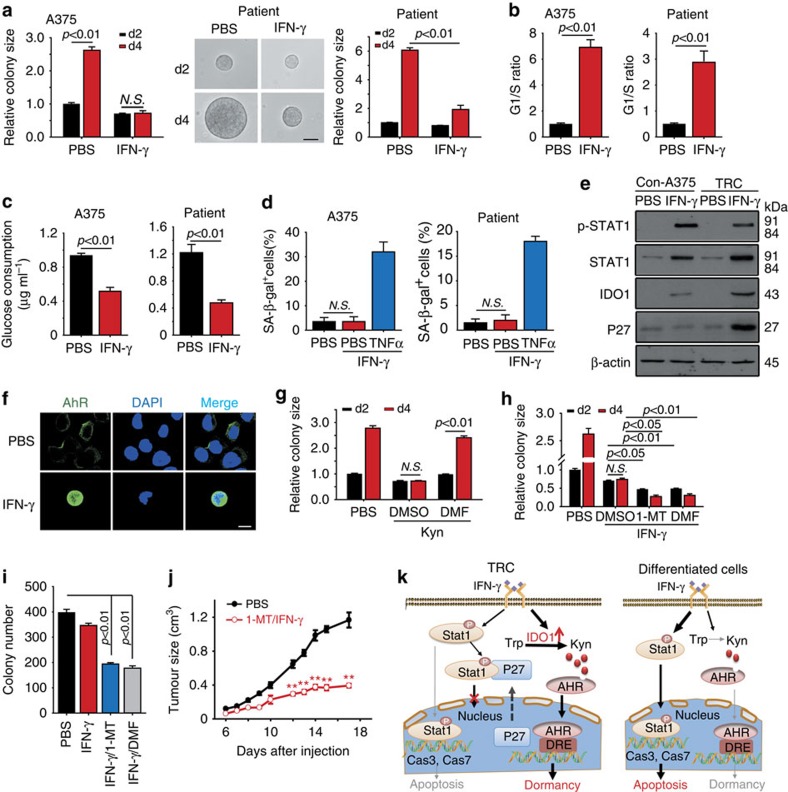
Interactions with the immune system may lead tumorigenic cells into dormancy. However, the underlying molecular mechanism is poorly understood. Using a 3D fibrin gel model, we show that IFN-γ induces tumour-repopulating cells (TRCs) to enter dormancy through an indolamine 2,3-dioxygenase 1 (IDO1)-kynurenine (Kyn)-aryl hydrocarbon receptor (AhR)-p27 dependent pathway. Mechanistically, IFN-γ signalling triggers differentiated tumour cell apoptosis via STAT1; however, when IDO1 and AhR are highly expressed as in TRCs, IFN-γ results in IDO1/AhR-dependent p27 induction that prevents STAT1 signalling, thus suppressing the process of cell death and activating the dormancy program. Blocking the IDO/AhR metabolic circuitry not only abrogates IFN-γ-induced dormancy but also results in enhanced repression of tumour growth by IFN-γ-induced apoptosis of TRCs both in vitro and in vivo. These data present a previously unrecognized mechanism of inducing TRC dormancy by IFN-γ, suggesting a potential effective cancer immunotherapeutic modality through the combination of IFN-γ and IDO/AhR inhibitors.


Conflict of interest statement

The authors declare no competing financial interests.

Figures

Figure 1
Figure 1. IFN-γ induces TRC dormancy in vitro.
(a) B16 cells in conventional rigid plate or B16 TRCs seeded in soft 3D fibrin gels were cultured for 3 days in the presence of different concentration of IFN-γ. Cell viability were analysed by flow cytometry. (b,c) B16 cells were seeded in soft 3D fibrin gels for 3 days, and then treated with different doses of IFN-γ for additional 2 days (d2), 4 days (d4) or 6 days (d6). For the bottom wells, IFN-γ was provided for the first 4 days and withdrawn for the last 2 days. Colony size was indicated (b), and cell cycle was analysed after 3 days IFN-γ treatment (100 ng ml−1) (c). The relative colony size was calculated by comparing the colony size in other groups with the colony size in the group of IFN-γ (50 ng ml−1) treated for 2 days, which was set to 1. Bar, 50 μm. (d,e) IFN-γ treatment decreased the expression of PCNA mRNA in B16 TRCs (d), and the glucose consumption (e). (f) B16 TRCs were treated with IFN-γ (100 ng ml−1) or IFN-γ/TNF-α (10 ng ml−1) for 72 h. SA-β gal staining was conducted. Bar, 50 μm. (g) control B16 cells from rigid plate, B16 TRCs, or dormant TRCs (72 h IFN-γ treatment) were treated with methotrexate (MTX, 250 ng ml−1) or paclitaxal (PAX, 2 μg ml−1) for 24 h. Cell viability was measured by flow cytometry. (h) TRC dormancy induced by high dose of IFN-γ was maintained by low dose of IFN-γ. B16 TRCs were treated with 200 ng ml−1 IFN-γ for 2 days, then treated with different low doses of IFN-γ as indicated and cultured for another 2–4 days. The relative colony size was calculated by comparing the colony size in other groups with the colony size in the group of IFN-γ (0 ng ml−1) treated for 2 days, which was set to 1. Data shown are representative of three independent experiments and error bars represent mean±s.e.m., NS, no significant difference (Student's t-test).
Figure 2
Figure 2. IFN-γ induces TRC dormancy in vivo.
(a,b) C57BL/6 mice with 5 × 5 mm B16 melanoma were intratumorally treated with 10 μg IFN-γ once per day for 3 days (n=6 per group). Isolated primary tumour cells were assayed for cell cycle analysis (a). Or CD133high tumour cells were sorted from tumour by FACS and performed cell cycle analysis (b). (c) the same as a, but mice were treated with 10 μg IFN-γ in the presence or absence of TNF-α once per day for 3 days. Isolated primary tumour cells were stained with SA-β gal. (d) B16 TRCs (5 × 10³) were subcutaneously injected to mice. On day 3, 10 μg IFN-γ was directly injected into tumour site once every 2 days (n=8 per group). On day 5 and day 20, tumour cell-injected tissues were analysed by immunostaining against S100β or H&E staining. The tumour size was presented photographically (left) and graphically (right). Bar, 25 μm. (e) 5 × 10³ B16 TRCs were subcutaneously injected to C57BL/6 mice, and then mice were intratumorally treated with IFN-γ (10 μg per day) for 10 days, and then further treated with IFN-γ or IFN-γ+anti-IFN-γ antibody (250 μg per day) once every two days (n=8 per group). Tissues at the injection site were collected on day 10 (d0), day 15 (d5) or day 20 (d10), and used for immunostaining against S100β or H&E staining. Bar, 25 μm. (f,g) Mice were s.c. injected with 2 × 10⁵ OVA-B16 TRCs (n=8 per group). When the tumour size reached 3 × 3 mm, mice were adoptively transferred with OVA-specific CD8+ T cells (1 × 10⁷ cells per mouse) once per two days for twice. Some mice were pretreated with anti-IFN-γ antibody (250 μg per day) once per two days for twice. The isolated primary tumour cells were performed cell cycle analysis (f) and SA-β gal staining (g). In this figure, the data represented mean±s.e.m., NS, no significant difference (Student's t-test).
Figure 3
Figure 3. IDO-Kyn metabolic circuitry mediates TRC dormancy.
(a,b) IDO1-overexpressing B16 cells were seeded in soft 3D fibrin gels for 4 days (d4) or 6 days (d6). The colony size was indicated (a) and the cell cycle was analysed (b). The relative colony size was calculated by comparing the colony size in other groups with the colony size in the Vec (d4) group, which was set to 1. Bar, 50 μm. (c) IDO1- B16 cells were transfected with IDO1 siRNA or scramble siRNA and then seeded in soft 3D fibrin gels and cultured for the indicated days. The colony size is presented photographically and graphically. The relative colony size was calculated by comparing the colony size in groups with that in the Vec (d4) group, which was set to 1. Bar, 50 μm. (d) Kyn inhibited B16-TRC growth. B16-TRCs cultured in 3D soft gels for 2 days were treated with 150 μM Kyn for 2–4 days and at day 5, Kyn was removed from the supernatant and continued to culture for another 2 days. The relative colony size was calculated by comparing the colony size in other groups with the colony size in the PBS (d2) group, which was set to 1. Bar, 50 μm. (e) The same as d, but the TRCs were collected 72 h after Kyn treatment and performed cell cycle analysis. Data shown are representative of three independent experiments and error bars represent mean±s.e.m., NS, no significant difference (Student's t-test).
Figure 4
Figure 4. TRC dormancy is regulated by Kyn-AhR-p27 pathway.
(a) Kyn promoted the translocation of AhR from the cytosol to nucleus by immunostaining assay. Bar, 10 μm. (b) Cell fraction of cytosol (C) and nucleus (N) was analysed by western blot. (c) Stably IDO1-B16 cells were transfected with scramble or AhR siRNA and seeded in 3D soft fibrin gels and cultured for the indicated days. The colony size is presented photographically and graphically. The relative colony size was calculated by comparing the colony size in groups with that in the Vec (d4) group, which was set to 1. Bar, 50 μm. (d) B16 cells were stably transfected with scramble shRNA, AhR shRNA1 or AhR shRNA2, and cultured in soft 3D fibrin gels with or without Kyn (150 μM) for 48 h. Scramble-B16 TRCs were used as control. The colony size is presented photographically and graphically after Kyn treatment for 48 h. The relative colony size was calculated by comparing the colony size in groups with that in the ShAhR/PBS group, which was set to 1. Bar, 50 μm. (e) B16 TRCs were treated with different concentration of Kyn. AhR activity was determined by luciferase assay. (f) B16-TRCs were treated with Kyn (150 μM) in the presence or absence of DMF (20 μM). The expression of p27 was determined by real-time PCR (left) and western blot (right). (g) the expression of p27 in TRCs or control B16 cells with or without IFN-γ treatment. (h) Kyn enhanced the luciferase activity of p27 promoter. B16-TRCs were transiently transfected with a luciferase reporter plasmid of pGL3/p27 promoter with or without Flag-AhR in the presence or absence of Kyn for 24 h. Data shown are representative of three independent experiments and error bars represent mean±s.e.m. (Student's t-test).
Figure 5
Figure 5. IFN-γ activated IDO-Kyn-AhR cascade crosstalks with STAT1 pathway via p27.
(a) the expression of IDO1 in control B16 cells, B16 TRCs or IFN-γ-treated B16 TRCs was determined by western blot. (b) the expression of AhR in control B16 cells, B16 TRCs or IFN-γ-treated B16 TRCs was determined by western blot. (c,d) B16 TRCs were treated with 100 ng ml−1 IFN-γ for 3 days. The nuclear localization of AhR was determined by immuno-fluorescence staining (c) and western blot (d). Cytoplasmic β3-tubulin and nuclear TopBp1 were used as controls. (e) B16 TRCs were treated with IFN-γ (100 ng ml−1) or IFN-γ+DMF (20 μM) for 3 days. The expression of p27 was determined by western blot. (fh) B16 TRCs were treated with or without IFN-γ (100 ng ml−1) for 3 days. Phosphorylated STAT1 in whole cell lysate (f) or cytoplasmic and nuclear fractions (g) was analysed by western blot. Immunostaining of p-STAT1 (green) and DAPI (blue) was represented (h). Bar, 10 μm. (i) B16 TRCs were treated with IFN-γ (100 ng ml−1) for indicated time. Cytoplasmic and nuclear p27 was analysed by western blot. (j) B16 TRCs, stably transfected with scramble shRNA or IDO1 shRNAs, were treated with IFN-γ (100 ng ml−1) for 72 h. Cytoplasmic and nuclear expression of p27 was analysed by western blot. (k) B16-TRCs were treated with IFN-γ (100 ng ml−1) for 24 or 72 h and the cytoplasmic and nuclear fractions were collected. Anti-phospho-STAT1 immunoprecipitates from both cytoplasm and nucleus were immunoblotted with anti-p27 and anti-phospho-STAT1 antibodies. Images shown are representative of three independent experiments.
Figure 6
Figure 6. Switching IFN-γ-mediated IDO-Kyn-AhR cascade to STAT1 signalling targets TRC dormancy.
(a,b) B16 cells (1.25 × 10³) were seeded in soft 3D fibrin gels. Two days later, IFN-γ was added for further 2 days (d2) or 4 days (d4) culture in the presence or absence of different concentration of DMF. The colony size was presented (a) and colony number was counted (b). The relative colony size was calculated by comparing the colony size in other groups with the colony size in the PBS (d2) group, which was set to 1. The data represent mean±s.e.m. (n=3). Bar, 50 μm. (c,d) The above B16 TRCs were cultured in the presence or absence of different concentration of 1-MT. The colony size was presented (c) and colony number was counted (d). The relative colony size was calculated by comparing the colony size in other groups with the colony size in the PBS (d2) group, which was set to 1. The data represent mean±s.e.m. (n=3). Bar, 50 μm. (e) control B16 cells or B16 TRCs were treated with 100 ng ml−1 IFN-γ for 24 or 72 h (n=3). Caspase 3 (Cas 3), caspase 7 (Cas 7) and their cleaved forms (Cas 3F and Cas 7F) were determined by western blot. (f) B16-TRCs were treated with IFN-γ (100 ng ml−1) plus 1-MT (0.2 mM) or DMF (20 μM) for 72 h (n=3). Caspases were analysed by western blot. (g) B16-TRCs were treated with IFN-γ (100 ng ml−1), IFN-γ/1-MT (0.2 mM) or IFN-γ/DMF (20 μM) for 72 h. Immunostaining of p-STAT1 (green) and DAPI (blue) was shown as the representative of three independent experiments. Bar, 10 μm.
Figure 7
Figure 7. Combining IFN-γ and an IDO or AhR inhibitor disrupts murine TRC dormancy in vivo.
(a) C57BL/6 mice with 5 × 5 mm B16 melanoma were intratumorally treated with 10 μg IFN-γ once daily for 3 days (n=6 per group). Isolated primary tumour cells from a part of tumour tissue were analysed by western blot with anti-IDO1, p27 and β-actin antibody, respectively (left). Another part of tumour tissue was immunostained with anti-AhR (green), S100 (red) and DAPI (blue), and observed under confocal microscopy (right). Bar, 20 μm. (b,c) mice with 5 × 5 mm B16 melanoma were intratumorally treated with 10 μg IFN-γ, IFN-γ/1-MT (5 mg ml−1, 3–4 ml per mouse per day) or IFN-γ/DMF (10 mg kg−1) once daily for 3 days (n=6 per group). Isolated primary tumour cells were assayed for cell cycle analysis (b). The tumour cells were cultured in 3D soft fibrin gels. Four days later, the colony number was counted (c). The data represent mean±s.e.m. (analysis of Student's t-test). (d) the same as b, but isolated primary tumour cells were used to analyse caspase 3, caspase 7 and their cleaved forms by western blot (n=6 per group). (e) tumour tissue from b were fixed in paraffin for immunocytochemical analysis with anti-p-STAT1 (red), anti-S100 (green) and DAPI (blue). Bar, 25 μm.
Figure 8
Figure 8. The combining therapy of IFN-γ and 1-MT/DMF targets tumour independent of the adaptive immune system.
(a) The NOD-SCID mice (n=8) with B16 melanoma (7 × 7 mm) were treated with IFN-γ/1-MT for 1 week. The tumour growth was measured. (b) IDO1-stably silencing or scramble control B16 cells (1 × 10⁵) were s.c. injected to C57BL/6 mice (n=10 per group). The tumour growth was measured (left) and long-term survival was analysed (right). (c) IDO1-knockdown or scramble control B16 cells were injected to C57BL/6 mice (n=8 per group). Twelve hours before tumour cell injection, mice were treated with anti-IFN-γ antibody (250 μg) once every 2 days. Tumour growth was measured. (d) C57BL/6 mice (n=10 per group) were s.c. injected with 1 × 10⁵ B16 cells. Three days later, mice were treated with IFN-γ (intratumoral injection of 20 μg per day, once every 2 days), 1-MT (5 mg ml−1 in drinking water, 3–4 ml per mouse per day) or IFN-γ/1-MT for 10 days. The tumour growth was measured (left) and long-term survival was analysed (right). (e) Three days after injection of 1 × 10⁵ B16 cells, C57BL/6 mice were treated with IFN-γ, DMF (intragastric injection of 10 mg kg−1, once per 2 days) or IFN-γ/DMF for 10 days (n=10 per group). The tumour growth was measured (left) and long-term survival was analysed (right). The data represent mean±s.e.m., *P<0.05, **P<0.01, ***P<0.001 versus PBS group; #P<0.05, ##P<0.01 versus Scr or IFN-γ group (Student's t-test or Kaplan–Meier analysis).
Figure 9
Figure 9. Dormant human TRCs by IFN-γ are also abrogated by blocking IDO1-AhR pathway.
(a) A375 or primary human melanoma cells were cultured in soft 3D fibrin gels for 2 days and then treated with IFN-γ (150 ng ml−1 or 200 ng ml−1) for the indicated days. (bd) A375 or primary human melanoma TRCs treated with IFN-γ for 3 days were subjected to cell cycle analysis (b), glucose consumption assay (c) or SA-β gal staining (d). (e) A375 cells grown in rigid plate or soft 3D gels were treated with IFN-γ (150 ng ml−1) for 3 days and then subjected to western blot against phospho-STAT1, STAT1, IDO1, p27 and β-actin, respectively. (f) A375 TRCs treated with IFN-γ (150 ng ml−1) were immunostained with anti-AhR antibody (green) and DAPI (blue), and observed under confocal microscope. (g) A375 TRCs were treated with Kyn (150 μM) or Kyn+DMF (20 μM) for 48 h. The colony size was calculated. (h,i) A375 cells were treated with IFN-γ (150 ng ml−1) in the presence or absence of 1-MT (0.2 mM) or DMF (20 μM) for 3 days. The colony size was quantified (h) and colony number was counted (i). (j) NOD-SCID mice (n=8 per group) with human MCF-7 breast cancer (7 × 7 mm) were treated with IFN-γ/1-MT for 1 week. The tumour growth was measured. (k) IFN-γ activates p-STAT1 pathway to trigger apoptosis in differentiated cells, while IFN-γ switches from the p-STAT1 pathway to the IDO-Kyn-AhR-p27 cascade to induce TRC dormancy. The relative colony size in this figure was calculated by comparing the colony size in other groups with the colony size in the PBS (d2) group, which was set to 1. Data shown are representative of three independent experiments and error bars represent mean±s.e.m., NS, no significant difference (Student's t-test).

Similar articles

Cited by

References

    1. MacKie R. M., Reid R. & Junor B. Fatal melanoma transferred in a donated kidney 16 years after melanoma surgery. N. Engl. J. Med. 348, 567–568 (2003). - PubMed
    1. Milton C. A. et al.. The transmission of donor-derived malignant melanoma to a renal allograft recipient. Clin. Transplant. 20, 547–550 (2006). - PubMed
    1. Strauss D. C. & Thomas J. M. Transmission of donor melanoma by organ transplantation. Lancet Oncol. 11, 790–796 (2010). - PubMed
    1. Hamid O. et al.. Safety and tumor responses with lambrolizumab (anti-PD-1) in melanoma. N. Engl. J. Med. 369, 134–144 (2013). - PMC - PubMed
    1. Senzer N. N. et al.. Phase II clinical trial of a granulocyte-macrophage colony-stimulating factor-encoding, second-generation oncolytic herpesvirus in patients with unresectable metastatic melanoma. J. Clin. Oncol. 27, 5763–5771 (2009). - PubMed

Publication types

MeSH terms