

Third Generation Antivenomics: Pushing the Limits of the In Vitro Preclinical Assessment of Antivenoms
- PMID: 28489039
- PMCID: PMC5450706
- DOI: 10.3390/toxins9050158
Third Generation Antivenomics: Pushing the Limits of the In Vitro Preclinical Assessment of Antivenoms
Abstract
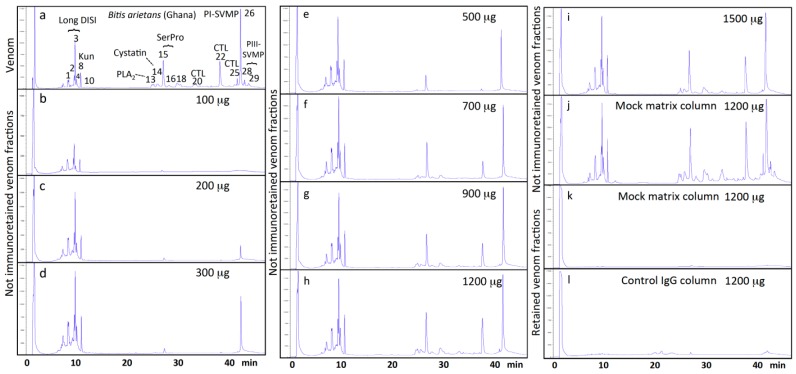
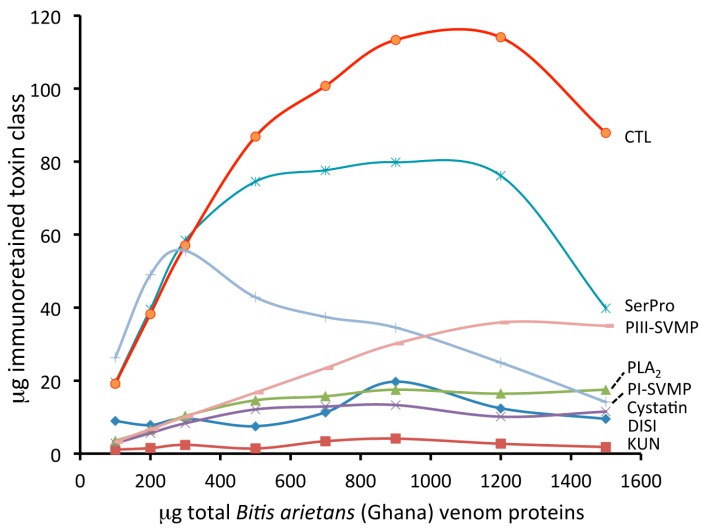
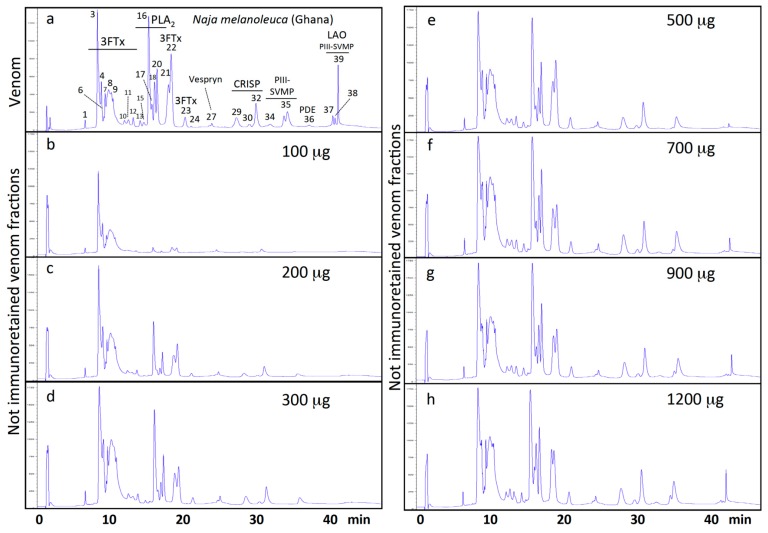
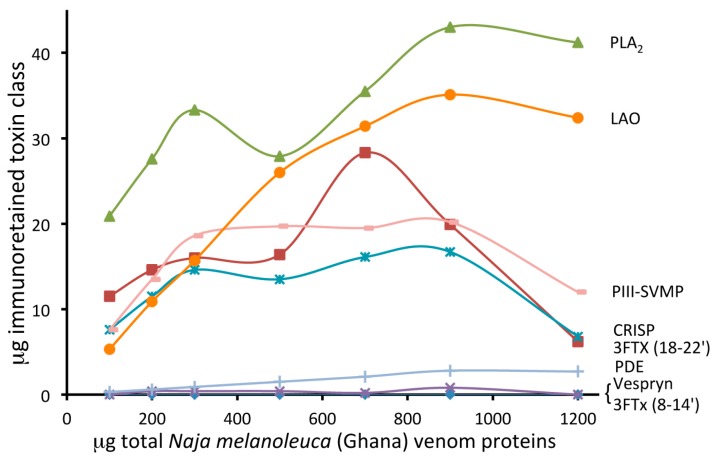
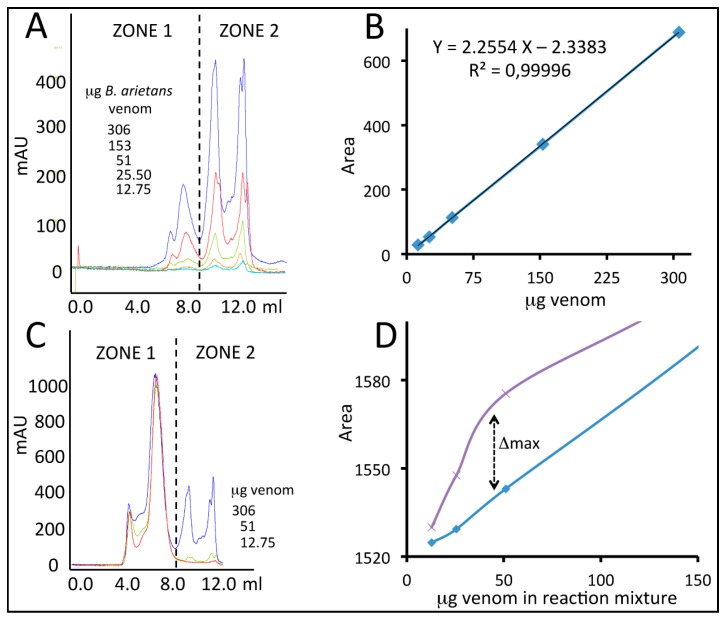
Second generation antivenomics is a translational venomics approach designed to complement in vivo preclinical neutralization assays. It provides qualitative and quantitative information on the set of homologous and heterologous venom proteins presenting antivenom-recognized epitopes and those exhibiting impaired immunoreactivity. In a situation of worrying antivenom shortage in many tropical and sub-tropical regions with high snakebite mortality and morbidity rates, such knowledge has the potential to facilitate the optimal deployment of currently existing antivenoms and to aid in the rational design of novel broad specificity antidotes. The aim of the present work was to expand the analytical capability of the immunoaffinity second-generation antivenomics platform, endowing it with the ability to determine the maximal binding capacity of an antivenom toward the different toxins present in a venom, and to quantify the fraction of venom-specific antibodies present in a given antivenom. The application of this new platform, termed third generation (3G) antivenomics, in the preclinical evaluation of antivenoms is illustrated in this paper for the case of antivenom EchiTAb-Plus-ICP® reactivity towards the toxins of homologous (B. arietans) and heterologous (N. melanoleuca) venoms.
Keywords: antivenom; preclinical assessment of antivenom; size-exclusion analysis of IgG-toxin complexes; snake venom; third generation antivenomics.
Conflict of interest statement
The authors declare no conflict of interest.
Figures
Similar articles
-
Immunological profile of antivenoms: preclinical analysis of the efficacy of a polyspecific antivenom through antivenomics and neutralization assays.J Proteomics. 2014 Jun 13;105:340-50. doi: 10.1016/j.jprot.2014.02.021. Epub 2014 Feb 28. J Proteomics. 2014. PMID: 24583507 Review.
-
Proteomics of Naja kaouthia venom from North East India and assessment of Indian polyvalent antivenom by third generation antivenomics.J Proteomics. 2019 Sep 15;207:103463. doi: 10.1016/j.jprot.2019.103463. Epub 2019 Jul 22. J Proteomics. 2019. PMID: 31344496
-
Phylovenomics of Daboia russelii across the Indian subcontinent. Bioactivities and comparative in vivo neutralization and in vitro third-generation antivenomics of antivenoms against venoms from India, Bangladesh and Sri Lanka.J Proteomics. 2019 Sep 15;207:103443. doi: 10.1016/j.jprot.2019.103443. Epub 2019 Jul 17. J Proteomics. 2019. PMID: 31325606
-
Comparative venomics and preclinical efficacy evaluation of a monospecific Hemachatus antivenom towards sub-Saharan Africa cobra venoms.J Proteomics. 2021 May 30;240:104196. doi: 10.1016/j.jprot.2021.104196. Epub 2021 Mar 26. J Proteomics. 2021. PMID: 33775842
-
Snake venomics and antivenomics: Proteomic tools in the design and control of antivenoms for the treatment of snakebite envenoming.J Proteomics. 2009 Mar 6;72(2):165-82. doi: 10.1016/j.jprot.2009.01.008. Epub 2009 Jan 21. J Proteomics. 2009. PMID: 19344652 Review.
Cited by
-
An analysis of preclinical efficacy testing of antivenoms for sub-Saharan Africa: Inadequate independent scrutiny and poor-quality reporting are barriers to improving snakebite treatment and management.PLoS Negl Trop Dis. 2020 Aug 20;14(8):e0008579. doi: 10.1371/journal.pntd.0008579. eCollection 2020 Aug. PLoS Negl Trop Dis. 2020. PMID: 32817682 Free PMC article.
-
Immunorecognition and Neutralization of Crotalus durissus cumanensis Venom by a Commercial Antivenom Produced in Colombia.Toxins (Basel). 2022 Mar 25;14(4):235. doi: 10.3390/toxins14040235. Toxins (Basel). 2022. PMID: 35448844 Free PMC article.
-
Translational Venomics: Third-Generation Antivenomics of Anti-Siamese Russell's Viper, Daboia siamensis, Antivenom Manufactured in Taiwan CDC's Vaccine Center.Trop Med Infect Dis. 2018 Jun 15;3(2):66. doi: 10.3390/tropicalmed3020066. Trop Med Infect Dis. 2018. PMID: 30274462 Free PMC article.
-
In Vitro Tests for Assessing the Neutralizing Ability of Snake Antivenoms: Toward the 3Rs Principles.Front Immunol. 2021 Jan 11;11:617429. doi: 10.3389/fimmu.2020.617429. eCollection 2020. Front Immunol. 2021. PMID: 33505403 Free PMC article.
-
Bothrops jararacussu Venom Inactivated by High Hydrostatic Pressure Enhances the Immunogenicity Response in Horses and Triggers Unexpected Cross-Reactivity with Other Snake Venoms.Toxins (Basel). 2025 Feb 13;17(2):88. doi: 10.3390/toxins17020088. Toxins (Basel). 2025. PMID: 39998105 Free PMC article.
References
-
- Lillian Lincoln Foundation Short Promotional Video. [(accessed on 22 March 2017)]; Available online: https://vimeo.com/167436988.
Publication types
MeSH terms
Substances
LinkOut - more resources
Full Text Sources
Other Literature Sources
