. 2017 May 10:8:15208.
doi: 10.1038/ncomms15208.

Senescent tumor cells lead the collective invasion in thyroid cancer

Affiliations

Senescent tumor cells lead the collective invasion in thyroid cancer

Young Hwa Kim et al. Nat Commun. .

Abstract

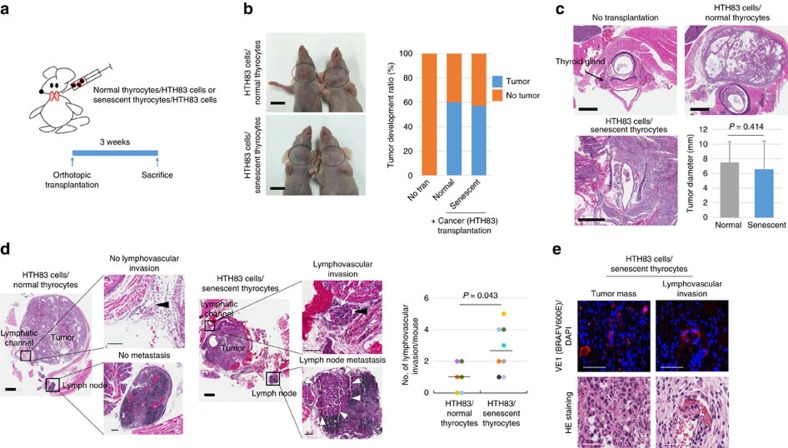
Cellular senescence has been perceived as a barrier against carcinogenesis. However, the senescence-associated secretory phenotype (SASP) of senescent cells can promote tumorigenesis. Here, we show senescent tumour cells are frequently present in the front region of collective invasion of papillary thyroid carcinoma (PTC), as well as lymphatic channels and metastatic foci of lymph nodes. In in vitro invasion analysis, senescent tumour cells exhibit high invasion ability as compared with non-senescent tumour cells through SASP expression. Collective invasion in PTC is led by senescent tumour cells characterized by generation of a C-X-C-motif ligand (CXCL)12 chemokine gradient in the front region. Furthermore, senescent cells increase the survival of cancer cells via CXCL12/CXCR4 signalling. An orthotopic xenograft in vivo model also shows higher lymphatic vessels involvement in the group co-transplanted with senescent cells and cancer cells. These findings suggest that senescent cells are actively involved in the collective invasion and metastasis of PTC.


Conflict of interest statement

The authors declare no competing financial interests.

Figures

Figure 1
Figure 1. Senescent tumour cells are located at the front region of invasion in BRAFV600E-expressing PTC.
(a) PTC frozen sections were stained with SA-β-Gal, HE or nuclear fast red as counterstains, and images of a normal follicle, centre and invasive area of cancer were acquired (Upper panel, thick bars indicate 1 mm and thin bars indicate 50 μm). Seventy cases of BRAFV600E-expressing PTC were stained with SA-β-Gal and the intensity was analysed and presented as none, weak, moderate or strong. The P value shown was calculated by χ2 test (Lower panel, bars indicate 100 μm). (b) BRAFV600E-expressing PTC frozen tissues were sectioned serially and stained for SA-β-Gal, p16INK4A and Ki67 (MIB-1). Upper panel shows the cancer centre area, and lower panel shows the cancer invasive area. (c) The senescent program is present in neoplastic epithelial cells of BRAFV600E-expressing PTC. p16INK4A, BRAFV600E (VE1) and TTF-1 expression was analysed in paraffin embedded tissues. Thick bars indicate 1 mm and thin bars indicate 100 μm in b,c.
Figure 2
Figure 2. Senescent tumour cells in the collective invasion.
(a) Collective invasion in BRAFV600E expressing PTC. Invasive region of BRAFV600E-expressing PTC with metastatic lymph nodes and tumour emboli in the lymphatic channel were immunostained with TTF-1, BRAFV600E, E-cadherin, D2-40 (lymphatic vessel marker, red color). (b) p16INK4A-immunopositive senescent tumor cells located at the front region of E-cadherin conserved collective invasion. (c) Twist1, Zeb1, E-cadherin, and N-cadherin expression was analyzed in paraffin embedded tissue sections from 20 cases of BRAFV600E-expressing PTC, with representative results are presented. Thick bars indicate 1 mm (a) and thin bars indicate 50 μm (a,b,c), respectively.
Figure 3
Figure 3. Senescent cells exhibit high invasive ability> viaSASP expression.
(a) Tumour cells were isolated from BRAFV600E-expressing PTC, and the invasion ability of senescent cells was then analysed. Tumour cells were seeded in 60-mm dishes or transwells and maintained for 24 h. Cells were stained with SA-β-Gal in 60-mm dishes or SA-β-Gal/eosin in transwell membranes, followed by analysis of percentage of senescent cells (n=3). (b) SASP expression in BRAFV600E-expressing PTC. SASP expression was analysed in BRAFV600E-expressing PTC and adjacent normal tissues by real-time PCR and presented as a dot graph (n=13). Values indicate the relative value compared to that of the normal follicle. In the case of MMP1, 25 cases were analysed. (c) RNA-sequencing analysis in the centre and invasive area of PTC. The central or invasive region of cancer tissues were obtained after surgical resection by a pathologist followed by analysis of target mRNA expression by RNA sequencing (n=3, average value, right panel) or real-time PCR (n=9, left lower panel). The values in RNA sequencing and real-time PCR indicate the Log2 ratio and the relative values of cancer invasive region compared with the centre of the cancer, respectively. (d) Immunohistochemical analysis of MMP1, MMP3, MMP9 and p16INK4A expression in BRAFV600E-expressing PTC (n=10), and analysed using H score. (e) BRAFV600E-induced senescence in primary normal thyrocytes. Normal thyrocytes were infected with control, BRAFV600E/shCon or BRAFV600E/shBRAF lentivirus for 10 days. SA-β-Gal staining (n=3), BRAF and p-Erk1/2 western blots were performed. (f) RNA-sequencing analysis in normal and BRAFV600E-induced senescent thyrocytes. Total RNA was isolated from normal or BRAFV600E-induced senescent thyrocytes, and RNA sequencing was performed. The value indicates the Log2 ratio compared with RNA expression of normal thyrocytes (n=2, average value). (g) MMPs expression was analysed in normal and BRAFV600E-induced senescent thyrocytes by real-time PCR (n=3, left panel) and western blotting (right panel). The P value shown (d) was calculated by Wilcoxon signed rank test and the others were calculated by Student's t-test. Error bars, s.d. Thick bars indicate 1 mm (c), and thin bars indicate 100 μm.
Figure 4
Figure 4. Senescent tumour cells involved in cancer invasion and lymph node metastasis.
(a) Schematic representation of the role of senescent tumour cells in collective invasion and lymph node metastasis. (b) Senescent tumour cells located in the front region of collective invasion. PTC frozen sections were stained with SA-β-Gal only (left upper) and SA-β-Gal/hematoxylin (left lower). The black dotted line indicates the margin of cancer (left upper panel), and the blue and red dotted lines indicate senescent and non-senescent tumour cells (right panel), respectively. ‘1' and ‘2' indicate the high-magnification fields of the original figure. (c) Senescent tumour cells in regional lymph nodes. Ten cases of primary PTC and their regional lymph nodes were analysed by SA-β-Gal (left panel), p16INK4A and BRAFV600E (right panel). (d) Senescent tumour cells in lymphatic channels. SA-β-Gal, BRAFV600E and p16INK4A expression in tumour emboli was analysed in lymphovascular vessels. Thick bars indicate 1 mm (c,d) and thin bars indicate 50 μm (d), 100 μm (b,c) left panel and 200 μm (c) right panel, respectively.
Figure 5
Figure 5. CXCL12/CXCR4 signalling in the collective invasion.
(a) Scheme of a leader-cell assay. PTC tissues were digested with collagenase to obtain small fragments of cancer tissues, and fragments were cultured in collagen I containing matrigel for 96 h, followed by SA-β-Gal staining (left panel). SA-β-Gal-positive migrating cells emerged from the tumour organoid (right panel). ‘1', ‘2' and ‘3' indicate the high-magnification field of the original figure. (b) CXCLs/CCLs and their receptor expression in cancer invasive region. Experimental scheme was same as Fig. 3c. Raw data of mRNA expression is summarized in Supplementary Table 3. (c) Expression of CXCLs and their receptors in BRAFV600E-expressing PTC. Expression of CXCLs and CXCRs was analysed in the normal region and PTC by real-time PCR and represented as a dot graph (n=13, left panel). The values indicate the relative value compared to that of a normal follicle. Expression of CXCL12 and CXCR4 was analysed in the centre and invasive area of cancer by real-time PCR and represented as a bar graph (n=9, right panel). ‘Cen' and ‘Inv' indicate the centre and invasive area of cancer, respectively. (d) Immunohistochemical analysis of CXCL12, CXCR4 and p16INK4A expression in BRAFV600E-expressing PTC (n=13). Normal, centre and collective invasive regions of cancer were serially sectioned, and CXCL12, CXCR4 and p16INK4A expression was analysed by H score. ‘N.S' indicates not significant. (e) Expression of CXCLs/CXCRs in BRAFV600E-induced senescent thyrocytes (n=2, average value). Experimental scheme was same as Fig. 3f. Secreted CXCL12 protein was measured by ELISA (n=3, right lower panel). The P value shown (d) was calculated by Wilcoxon signed rank test and the others were calculated by Student's t-test. Bars indicate 50 μm (a), 100 μm (d), respectively. Error bars, s.d.
Figure 6
Figure 6. Senescent cells lead collective invasion.
(a) In vitro cell-migration assay. Normal/SNU790-CXCR4, BRAFV600E/SNU790-CXCR4 and BRAFV600E-shCXCL12/SNU790-CXCR4 cells were seeded. After 24 h, cell migration was measured. One set of BRAFV600E/SNU790-CXCR4 cells was treated with 1μM of AMD3100. Bar graph indicates the average of independent measurements (n=3). (b) Transwell assay. SNU790-CXCR4 cells suspended in medium were seeded in transwell. Control, BRAFV600E, BRAFV600E/shCXCL12 or BRAFV600E/AMD3100 treated cells were seeded at the bottom. After 24 h, cells that invaded the lower surface of the filters were counted. The number of migrated cells was counted in the 40-fold magnification field, and presented in the bar graph (n=3, right panel). (c) Three-dimensional invasion assay. SNU790-CXCR4 cells were co-cultured with normal or BRAFV600E-induced thyrocytes on the top of collagen I containing matrigel for 48 h (upper panel). Cell invasion was assessed by HE staining (lower panel). Bar graph indicates the average of independent experiments (n=3). (d) mCherry lentivirus-infected SNU790-CXCR4 cells were co-cultured with GFP lentivirus-infected normal (upper panel), BRAFV600E (middle panel) or BRAFV600E/shCXCL12 thyrocytes (lower panel) on the top of collagen I containing matrigel for 48 h. Independent experiments were performed and data are presented in the bar graph (n=3). The P values were calculated by Student's t-test. Bars indicate 50 μm (c,d) and 100 μm (a,b), respectively. Error bars, s.d.
Figure 7
Figure 7. Senescent cells confer anoikis resistance.
(a) The epithelial marker E-cadherin is retained in cancer emboli in lymphatic channels. PTC specimens were serially immunostained with TTF-1 (brown colour in nuclei)/D2-40 (red colour in cytoplasm), E-cadherin, CXCR4, CXCL12 and p16INK4A. White triangles indicated D2-40 stained lymphatic vessels. (b) Metastatic tumour cells at lymph nodes were stained with CXCR4 and CXCL12, respectively. (c) Anoikis inhibitory function of senescent cells. Control, BRAFV600E/shCon, BRAFV600E/shCXCL12 or BRAFV600E/AMD3100 treated cells were co-cultured with thyroid carcinoma cells (SNU790-CXCR4) in HEMA-coated plates for 12 h, and cell death was determined by Calcein AM and EthD-1 staining, (d) caspase activity and (e) apoptosis related proteins expression. Independent experiments were performed and data are presented in the bar graph (n=3). Thick bars indicate 1 mm (b) and thin bars indicate 50 μm (ac), respectively. The P values were calculated by Student's t-test. Error bars, s.d.
Figure 8
Figure 8. Senescent cells involved in collective lymphovascular invasion in in vivo nude mice.
(a) Schematic representation of orthotopic transplantation. (b) Thyroid tumours developed in female nude mice. 1 × 10⁶ cells (9 × 10⁵ HTH83 cells+1 × 10⁵ normal or BRAFV600E-induced senescent thyrocytes) were transplanted into the thyroid gland of 9-week-old female nude mice. The mice were euthanized after 3 weeks and the incidence of (b) tumour development, as well as (c) the tumour size, were analysed. The P values were calculated by Mann–Whitney U-test. Circles indicate the tumour mass in the thyroid. (d) Lymphovascular invasion and regional lymph node metastasis in transplanted mice. Lymphovascular invasion and lymph node metastasis were analysed in nude mice developing cancer. Lymphovascular invasion is described as the number of lymphovascular invasion in cancer developing mice. Black arrowheads indicate a lymphatic channel. White arrows indicate tumour emboli in lymphatic channel. White arrowheads indicate a cancer-positive regional lymph node. (e) BRAFV600E-expressing senescent cells in the tumour mass and tumour emboli in a lymphovascular vessel. Statistical analyses were performed by Mann–Whitney U-test. Thick bars indicate 1 cm (b), 1 mm (c,d) and thin bars indicate 50 μm (e), 100 μm (d), respectively. Error bars, s.d.

References

    1. Hanahan D. & Weinberg R. A. Hallmarks of cancer: the next generation. Cell 144, 646–674 (2011). - PubMed
    1. Solinas G., Marchesi F., Garlanda C., Mantovani A. & Allavena P. Inflammation-mediated promotion of invasion and metastasis. Cancer Metastasis Rev. 29, 243–248 (2010). - PubMed
    1. Berx G. & van Roy F. Involvement of members of the cadherin superfamily in cancer. Cold Spring Harb. Perspect. Biol. 1, a003129 (2009). - PMC - PubMed
    1. Cavallaro U. & Christofori G. Cell adhesion and signalling by cadherins and Ig-CAMs in cancer. Nat. Rev. Cancer 4, 118–132 (2004). - PubMed
    1. Friedl P., Locker J., Sahai E. & Segall J. E. Classifying collective cancer cell invasion. Nat. Cell Biol. 14, 777–783 (2012). - PubMed

Publication types

MeSH terms