. 2017 May 10:8:15090.
doi: 10.1038/ncomms15090.

Antibody targeting intracellular oncogenic Ras mutants exerts anti-tumour effects after systemic administration

Affiliations

Antibody targeting intracellular oncogenic Ras mutants exerts anti-tumour effects after systemic administration

Seung-Min Shin et al. Nat Commun. .

Abstract

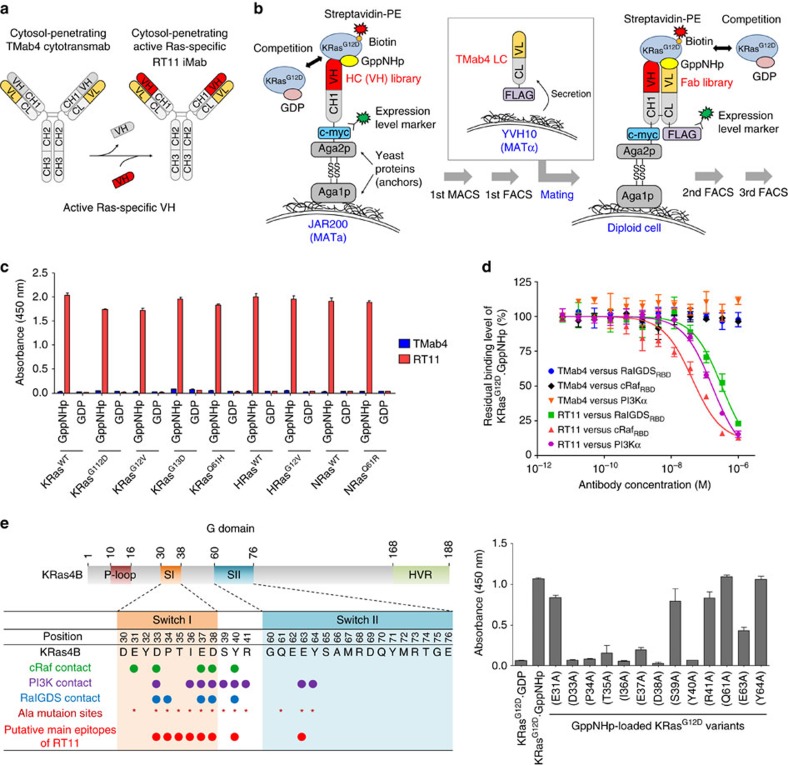
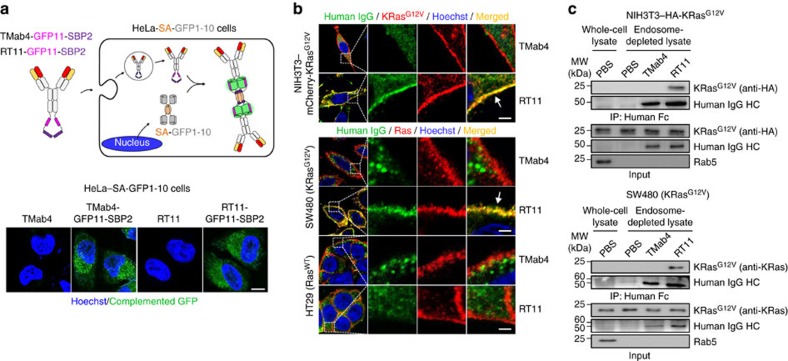
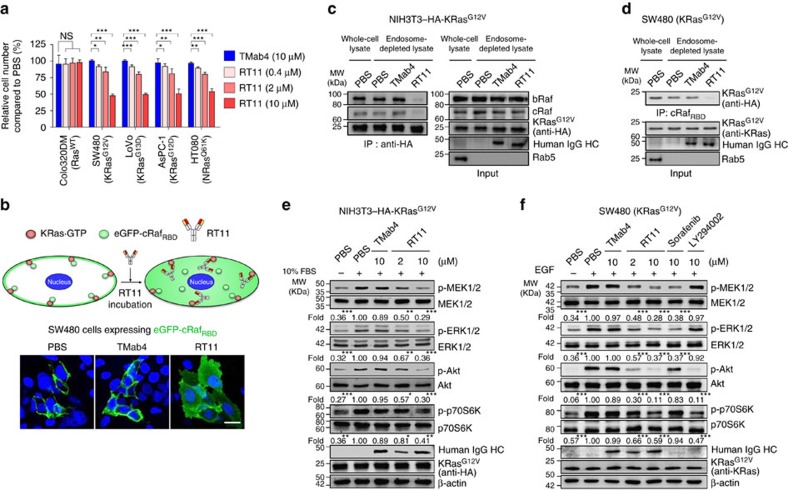
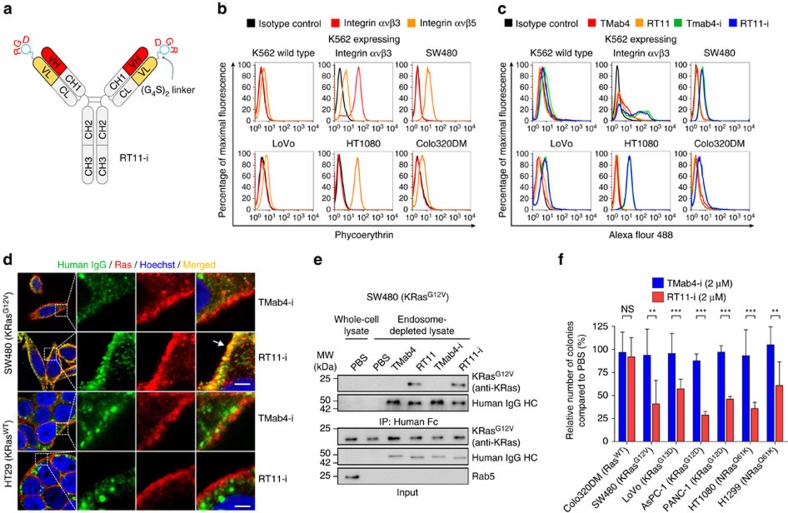
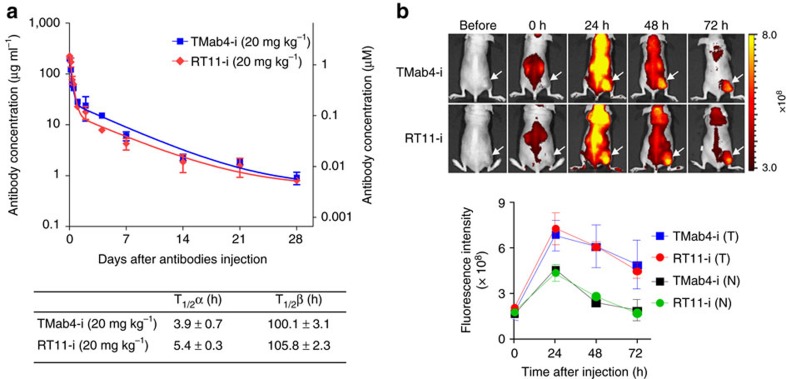
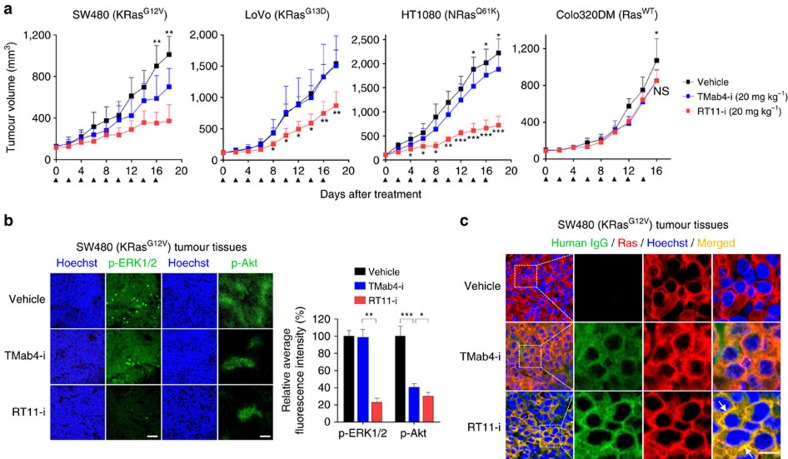
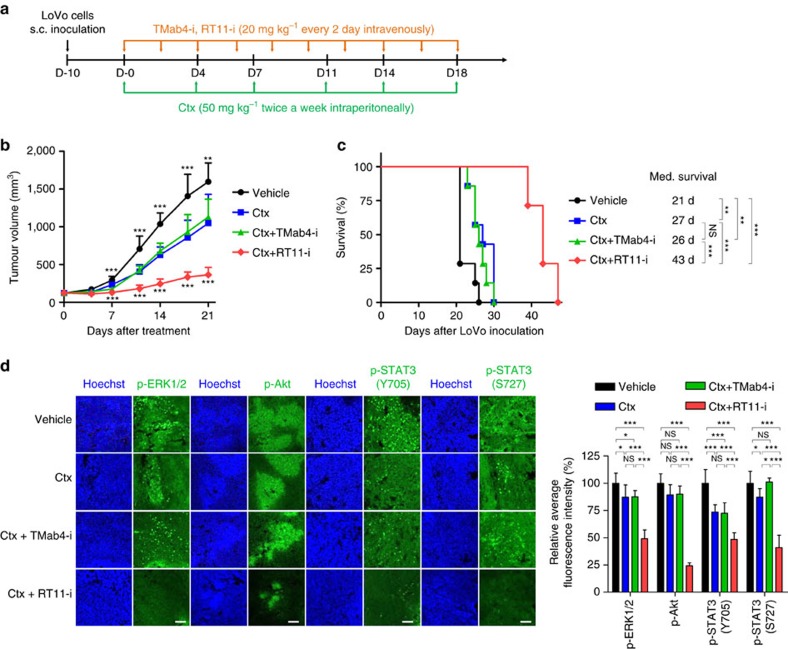
Oncogenic Ras mutants, frequently detected in human cancers, are high-priority anticancer drug targets. However, direct inhibition of oncogenic Ras mutants with small molecules has been extremely challenging. Here we report the development of a human IgG1 format antibody, RT11, which internalizes into the cytosol of living cells and selectively binds to the activated GTP-bound form of various oncogenic Ras mutants to block the interactions with effector proteins, thereby suppressing downstream signalling and exerting anti-proliferative effects in a variety of tumour cells harbouring oncogenic Ras mutants. When systemically administered, an RT11 variant with an additional tumour-associated integrin binding moiety for tumour tissue targeting significantly inhibits the in vivo growth of oncogenic Ras-mutated tumour xenografts in mice, but not wild-type Ras-harbouring tumours. Our results demonstrate the feasibility of developing therapeutic antibodies for direct targeting of cytosolic proteins that are inaccessible using current antibody technology.


Conflict of interest statement

S.M.S., D.K.C. and Y.S.K. are listed as inventors on pending patent applications (PCT/KR2015/007626 and PCT/KR2015/007627) related to technology described in this work. These remaining authors declare no competing financial interests.

Figures

Figure 1
Figure 1. Generation and characterization of active Ras specific RT11 iMab.
(a) A strategy to generate cytosol-penetrating and GTP-bound active Ras specific antibody, RT11 iMab. (b) Schematic of screening method to isolate VH-dependent active Ras form-specific binding iMab antibody. (c) ELISA showing the selective binding of RT11, but not TMab4, to the GppNHp-bound active form of the representative oncogenic Ras mutants over the GDP-bound inactive form. (d) Competition ELISA showing that RT11, but not TMab4, blocks interactions between KRasG12D·GppNHp and effector proteins, such as cRafRBD, RalGDSRBD, and PI3Kα (p110α/p85α). (e) Epitope mapping of RT11 by alanine-scanning mutagenesis. (Right) ELISA showing the binding of RT11 to KRasG12D alanine mutants. (Left) Comparison of the KRas4B residues directly involved in the interactions with cRaf, PI3K, and RalGDS with the putative main epitopes (red circle) of RT11, determined by alanine-scanning mutagenesis. In ce, error bars represent the mean±s.d. (n=3).
Figure 2
Figure 2. RT11 internalizes into the cytosol and binds to active Ras mutant in living cells.
(a) Cellular internalization and cytosol localization of GFP11-SBP2-fused RT11 and TMab4 antibodies, as assessed by confocal microscopy measuring complemented GFP signals (green) in HeLa-SA-GFP1-10 cells after treatment with 1 μM of the antibodies for 6 h. Scale bar, 20 μm. (b) Cellular internalization and co-localization of RT11 (green), but not TMab4 (green), with the inner plasma membrane-anchored active Ras (red) in mCherry-KRasG12V-transformed NIH3T3 and KRasG12V-harbouring SW480 cells, analysed by confocal microscopy. The RasWT-harbouring HT29 cells were also analysed as a control. The areas in the white boxes are shown at a higher magnification for better visualization. The arrow indicates the co-localization of RT11 with activated Ras. The cells were treated with 2 μM of antibody for 12 h. Scale bar, 5 μm. In a,b, nuclei are counterstained with Hoechst33342 (blue). (c) Immunoprecipitation (IP) of KRas mutant with RT11, but not TMab4, from endosome-depleted cell lysates of HA-KRasG12V-transformed NIH3T3 and SW480 cells, treated with 2 μM of antibody for 12 h before analysis. The endosome-depleted cell lysates were assessed by the absence of Rab5, an early endosome marker. In ac, images are representative of at least two independent experiments.
Figure 3
Figure 3. RT11 inhibits the growth of oncogenic Ras mutant tumour cells by blocking PPIs between Ras and effector proteins.
(a) Cellular proliferation assay, after cells were treated twice at 0 and 72 h with antibody at the indicated concentrations for 6 d. Error bars±s.d. (n=3). *P<0.05, **P<0.01, ***P<0.001 versus TMab4-treated cells; NS, not significant. (b) Intracellular distribution of eGFP-fused cRafRBD protein (green) in eGFP-cRafRBD-transformed SW480 cells, treated with antibody (2 μM) for 12 h before microscopic confocal analysis. Scale bar, 20 μm. (c,d) IP of endogenous Raf proteins (bRaf and cRaf) with HA-tagged KRasG12V from the endosome-depleted cell lysates of HA-KRasG12V-transformed NIH3T3 cells (c) and IP of endogenous KRasG12V with cRafRBD from the endosome-depleted cell lysates of SW480 cells (d). The cells were treated with 2 μM of RT11 and TMab4 for 12 h before analysis. (e,f) Inhibitory effect of RT11 on the downstream signalling of KRas-effector PPIs in HA-KRasG12V-transformed NIH3T3 cells (e) and SW480 cells (f), analysed by western blotting. The cells were serum-starved for 6 h before treatment with antibody, Raf kinase inhibitor sorafenib, or PI3K-Akt inhibitor LY294002 for 6 h in serum-free growth medium. Cells were washed and then stimulated with 10% FBS (e) and EGF (50 ng ml−1 in serum free-media) (f) for 10 min before cell lysis. The number below the panel indicates relative value of band intensity of phosphorylated proteins compared to that in the PBS-treated control after normalization to the band intensity of respective total protein for each sample. *P<0.05, **P<0.01, ***P<0.001 versus PBS-treated control cells. In bf, images are representative of at least two independent experiments.
Figure 4
Figure 4. Generation and characterization of RGD10 peptide-fused RT11-i iMab.
(a) Generation of integrin αvβ3/αvβ5-targeting RT11-i by genetic fusion of RGD10 peptide, using a (G4S)2 linker, to the N-terminus of the LC of RT11. (b,c) RT11-i and TMab4-i bind to cell surface-expressed integrin ανβ3 and ανβ5. In b, flow cytometric analysis of the cell surface expression levels of integrin ανβ3 and ανβ5 on WT K562, integrin ανβ3-transformed K562, and human tumour cells, analysed by PE-conjugated anti-human integrin ανβ3 and ανβ5 antibodies. In c, flow cytometric analysis of cell surface binding levels of the indicated antibodies, co-incubated at 100 nM with 300 IU ml−1 heparin for 1 h at 4 °C with the indicated cells before analysis. (d) Cellular internalization and co-localization of RT11-i, but not TMab4-i, with the inner plasma membrane-anchored active Ras·GTP in KRasG12V-harbouring SW480 cells. The RasWT-harbouring HT29 cells were also analysed as a control. The areas in the white boxes are shown at increased magnification for better visualization. The arrow indicates the co-localization of RT11-i with activated Ras. Nuclei were counterstained with Hoechst 33342 (blue). Scale bar, 5 μm. (e) IP of endogenous KRasG12V with RT11 or RT11-i, but not TMab4 and TMab4-i, from endosome-depleted cell lysates of SW480 cells. Images are representative of two independent experiments. In d,e, the cells were treated with 1 μM of antibodies for 12 h before analysis. (f) Inhibition of tumour cell soft agar colony formation by RT11-i compared to that with TMab4-i. Following treatment of cells with PBS, TMab4-i (2 μM), or RT11-i (2 μM) every 72 h for 2–3 weeks, the number of colonies (diameter>200 μm) was counted by BCIP/NBT staining, as shown in the pictures of representative soft agar plates (Supplementary Fig. 7f). The results are presented as percentages compared to the PBS-treated control. Error bars represent the mean±s.d. (n=3). **P<0.01, ***P<0.001; NS, not significant.
Figure 5
Figure 5. Pharmacokinetics and biodistribution of RT11-i and TMab4-i antibodies.
(a) Pharmacokinetic profiles of RT11-i and TMab4-i in non-tumour bearing mice. Serum concentrations of TMab-i and RT11-i were determined by ELISA in female BALB/c nude mice following a single intravenous injection of 20 mg kg−1 in a total volume of 200 μl. Error bars represent the mean±s.d. (n=3 per time point). The solid lines represent the fit of a two-compartment pharmacokinetic model to the data to estimate the initial rapid clearance phase (T1/2α) and later terminal serum clearance phase (T1/2β). The inset table shows the pharmacokinetic parameters. (b) Tumour-targeting ability of RT11-i and TMab4-i, evaluated by intravenously injecting Dylight755-labelled antibodies (20 μg per mouse) into SW480 xenograft tumour-bearing mice, followed by in vivo fluorescence imaging. Representative images are shown, which were acquired at the indicated times post-injection. Fluorescence intensities in the tumour tissue (T), as indicated by arrows, and normal tissues (N) were quantified by radiant efficiency (photons s−1 cm−2 steradian−1 μW−1 cm−2) using Living Image software. Error bars,±s.d. (n=5 per group).
Figure 6
Figure 6. RT11-i suppresses the in vivo growth of oncogenic Ras mutant tumour xenografts in mice.
(a) In vivo anti-tumour efficacy of RT11-i compared to that of vehicle and TMab4-i controls, analysed by measuring the tumour volume during treatment of female BALB/c nude mice harbouring the indicated tumour xenografts. Antibodies were intravenously dosed at 20 mg kg−1 every 2 d (indicated by the arrows). Error bars,±s.d. (n=8 per group). (b,c) Immunohistochemical images showing the levels of p-ERK1/2 and p-Akt (b) or cellular penetration and co-localization of antibodies with the active Ras form (c) in SW480 tumour tissues excised from mice following treatment described in a. Images are representative of three independent experiments. Nuclei were counterstained with Hoechst33342 (blue). Scale bar, 100 μm in b or 10 μm in c. In b, the right panel shows the percent relative fluorescence intensity compared to that of vehicle-treated control. Error bars,±s.d. of five random fields for each tumour (two tumours per group). In c, the areas in the white boxes are shown at a higher magnification for better visualization. The arrows indicate the co-localization of RT11-i with activated Ras. In a,b, statistical analysis was performed using a one-way analysis of variance followed by the Newman–Keuls post-test. *P<0.05, **P<0.01, ***P<0.001 versus TMab4-i; NS, not significant.
Figure 7
Figure 7. Co-treatment of RT11-i overcomes cetuximab resistance in KRas mutant colorectal LoVo tumours in mice.
(a) Outline of the RT11-i, TMab4-i, and/or cetuximab treatment regimen. (b) Tumour growth was analysed by measuring the tumour volume during treatment with vehicle, cetuximab (Ctx), Ctx plus TMab4-i or Ctx plus RT11-i in Lovo xenograft mice. Error bars,±s.d. (n=8 per group). Statistical analysis was performed using a one-way analysis of variance followed by the Newman-Keuls post-test. ***P<0.001 versus Ctx alone. (c) Kaplan–Meier survival curves with median survival time listed for LoVo xenograft mice for the vehicle, Ctx, Ctx+TMab4-i and Ctx+RT11-i treatment groups (n=8 per group). **P<0.01, ***P<0.001 by Gehan-Breslow-Wilcoxon test for significance. Animals were killed when tumours reached ∼1,000 mm3 in size. (d) Immunohistochemical analysis showing the levels of p-ERK1/2, p-Akt, p-STAT3 (Y705) and p-STAT3 (S727) in LoVo tumour tissues excised from mice following the treatment described in b. Nuclei were counterstained with Hoechst 33342 (blue). Scale bar, 100 μm. Images are representative of at least two independent experiments. The right panel shows the percent relative fluorescence intensity compared to that of the vehicle-treated control group. Error bars,±s.d. of five random fields for each tumour (two tumours per group). Statistical analysis was performed using a one-way analysis of variance followed by the Newman–Keuls post-test. *P<0.05, **P<0.01, ***P<0.001; NS, not significant.

Similar articles

Cited by

References

    1. Cox A. D., Fesik S. W., Kimmelman A. C., Luo J. & Der C. J. Drugging the undruggable RAS: Mission possible? Nat. Rev. Drug Discov. 13, 828–851 (2014). - PMC - PubMed
    1. Stephen A. G., Esposito D., Bagni R. K. & McCormick F. Dragging ras back in the ring. Cancer Cell 25, 272–281 (2014). - PubMed
    1. Milburn M. V. et al.. Molecular switch for signal transduction: structural differences between active and inactive forms of protooncogenic ras proteins. Science 247, 939–945 (1990). - PubMed
    1. Vetter I. R. & Wittinghofer A. The guanine nucleotide-binding switch in three dimensions. Science 294, 1299–1304 (2001). - PubMed
    1. Prior I. A., Lewis P. D. & Mattos C. A comprehensive survey of Ras mutations in cancer. Cancer Res. 72, 2457–2467 (2012). - PMC - PubMed

Publication types

MeSH terms