. 2017 May 10:8:15165.
doi: 10.1038/ncomms15165.

Analysis of renal cancer cell lines from two major resources enables genomics-guided cell line selection

Affiliations

Analysis of renal cancer cell lines from two major resources enables genomics-guided cell line selection

Rileen Sinha et al. Nat Commun. .

Abstract

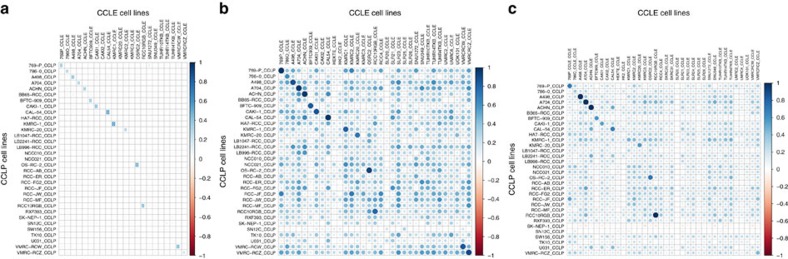
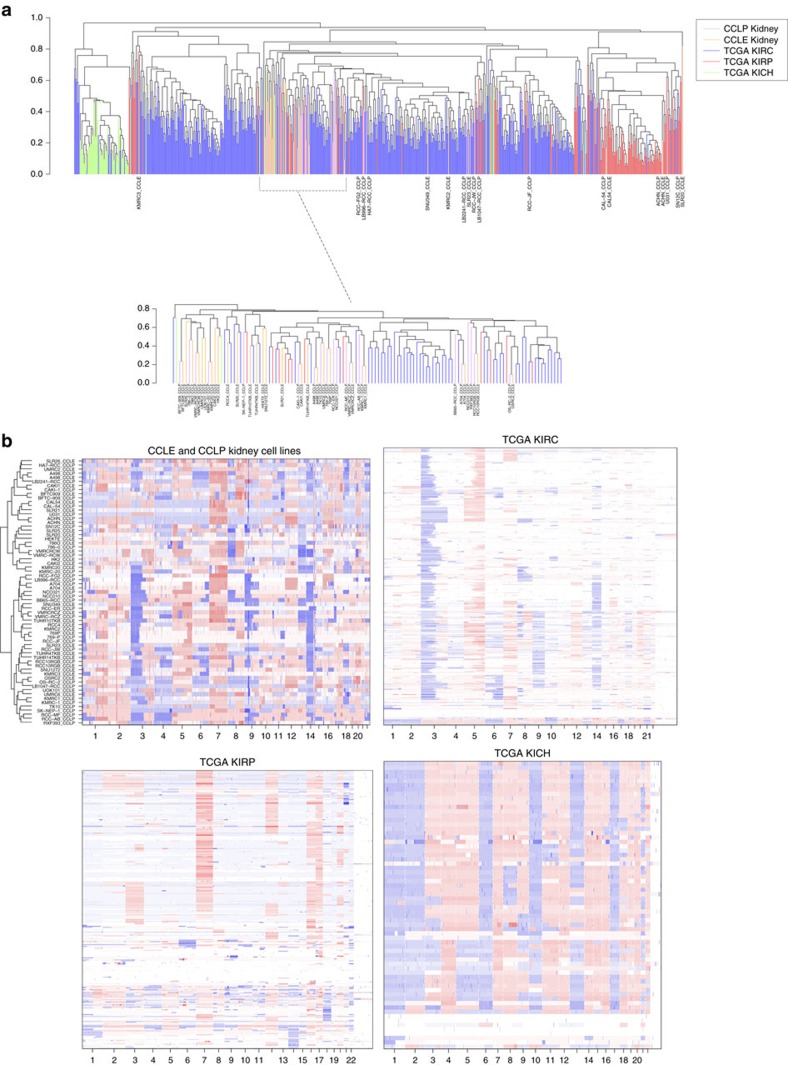
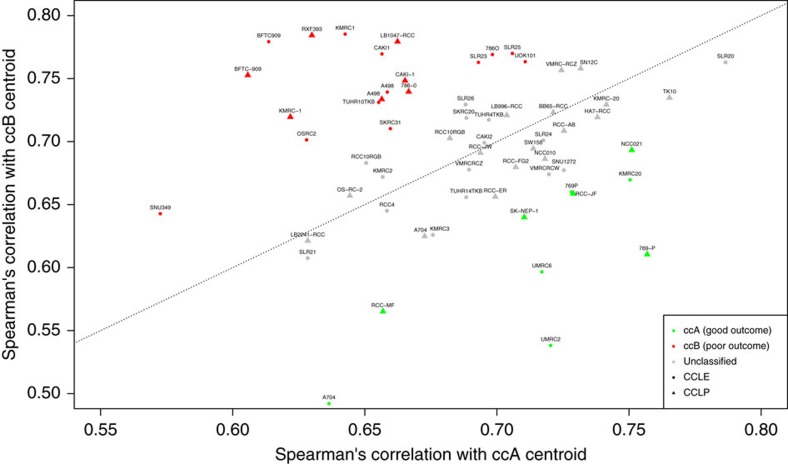
The utility of cancer cell lines is affected by the similarity to endogenous tumour cells. Here we compare genomic data from 65 kidney-derived cell lines from the Cancer Cell Line Encyclopedia and the COSMIC Cell Lines Project to three renal cancer subtypes from The Cancer Genome Atlas: clear cell renal cell carcinoma (ccRCC, also known as kidney renal clear cell carcinoma), papillary (pRCC, also known as kidney papillary) and chromophobe (chRCC, also known as kidney chromophobe) renal cell carcinoma. Clustering copy number alterations shows that most cell lines resemble ccRCC, a few (including some often used as models of ccRCC) resemble pRCC, and none resemble chRCC. Human ccRCC tumours clustering with cell lines display clinical and genomic features of more aggressive disease, suggesting that cell lines best represent aggressive tumours. We stratify mutations and copy number alterations for important kidney cancer genes by the consistency between databases, and classify cell lines into established gene expression-based indolent and aggressive subtypes. Our results could aid investigators in analysing appropriate renal cancer cell lines.


Conflict of interest statement

The authors declare no competing financial interests.

Figures

Figure 1
Figure 1. Comparison of CCLE and CCLP kidney cell lines using genomic data.
(a) Comparison of binary mutation data using the Jaccard similarity index (b). Comparison of CNAs using Pearson's correlation coefficient, and (c). Comparison of mRNA gene expression data using Pearson's correlation coefficient. Matching cell lines show higher similarity than non-matching cell lines for each data type, and the similarity between cell lines is appreciably higher using copy number or gene expression data than it is using mutation data.
Figure 2
Figure 2. Clustering RCC cell lines and tumours by CNAs into RCC subtypes.
(a) CNA-based clustering of 32 CCLP and 33 CCLE kidney cell lines and 728 TCGA kidney tumours (504 KIRC or clear cell, 158 KIRP or papillary and 66 KICH or chromophobe). Tumours clearly separate by subtype and the majority of cell lines cluster with clear cell renal tumours. No cell lines cluster with chromophobe tumours, but 3, ACHN, U031 and CAL54, cluster with papillary tumours. Two cell lines—SN12C and SLR21–are outliers and cluster away from all other tumours and cell lines on their own. (b) CNA landscape of CCLE and CCLP kidney cell lines–most of the clear cell renal cell lines show the characteristic 3p loss and VHL mutations (refer to Fig. 3), while several show other characteristic CNAs. ACHN, U031 and CAL54 show characteristic pRCC alterations, while SN12C and SLR21 are unlike any of the tumour subtypes. Cell lines are ordered according to the clustering in a, so cell lines with shared alterations are together. The CNA landscapes of the TCGA KIRC, KIRP and KICH data sets are also shown for comparison.
Figure 3
Figure 3. Mutations and CNAs in key kidney cancer genes in CCLP and CCLE cell lines.
While CCLP provides mutation data for all 24 genes, CCLE only covers 16. Both provide CNA data for 22 genes. (a) Four CCLE cell lines (ACHN, KMRC3, RCC10RGB and TUHR4TKB) did not have any mutations in these key kidney cancer genes. None of the 22 CCLE cell lines with mutation data had mutations in ARID1A, CDKN1A, FLCN1, NF2 or TSC1; while (b) none of the 33 CCLP cell lines with mutation data had mutations in ARID1A, FLCN, MICALCL, SLC1A3, STAG2 or TCEB1. CAL-54 and 769-P have identical mutation data for these genes in CCLE and CCLP; while (c) CAL-54, ACHN and 786-O have perfect agreement of CNA data for the 22 genes included.
Figure 4
Figure 4. Predicted expression-based subtype of CCLE kidney cell lines.
Most cell lines are not classified as either subtype with high confidence (grey)—of the remaining, more are classified as ccB (red) than as ccA (green).
Figure 5
Figure 5. Cell Line Xenografts.
Haematoxylin and eosin stain of tumour xenografts from the three most highly cited RCC cell lines (scale bar, 100 μm). (a) ACHN—xenografts show a poorly differentiated carcinoma with predominantly sarcomatoid differentiation. (b) A-498 xenografts consist of compact nests of tumour cells with clear cytoplasm, resembling the classical appearance of ccRCC. (c) 786-0 xenografts show predominantly sarcomatoid differentiation.

Comment in

References

    1. Ertel A., Verghese A., Byers S. W., Ochs M. & Tozeren A. Pathway-specific differences between tumor cell lines and normal and tumor tissue cells. Mol. Cancer 5, 55 (2006). - PMC - PubMed
    1. Stein W. D., Litman T., Fojo T. & Bates S. E. A Serial Analysis of Gene Expression (SAGE) database analysis of chemosensitivity: comparing solid tumors with cell lines and comparing solid tumors from different tissue origins. Cancer Res. 64, 2805–2816 (2004). - PubMed
    1. Gillet J. P. et al. Redefining the relevance of established cancer cell lines to the study of mechanisms of clinical anti-cancer drug resistance. Proc. Natl Acad. Sci. USA 108, 18708–18713 (2011). - PMC - PubMed
    1. Sandberg R. & Ernberg I. Assessment of tumor characteristic gene expression in cell lines using a tissue similarity index (TSI). Proc. Natl Acad. Sci. USA 102, 2052–2057 (2005). - PMC - PubMed
    1. Wang H. et al. Comparative analysis and integrative classification of NCI60 cell lines and primary tumors using gene expression profiling data. BMC Genomics 7, 166 (2006). - PMC - PubMed

Publication types