. 2017 May 10:8:15292.
doi: 10.1038/ncomms15292.

TRPV1 channels are critical brain inflammation detectors and neuropathic pain biomarkers in mice

Affiliations

TRPV1 channels are critical brain inflammation detectors and neuropathic pain biomarkers in mice

Maria Cristina Marrone et al. Nat Commun. .

Abstract

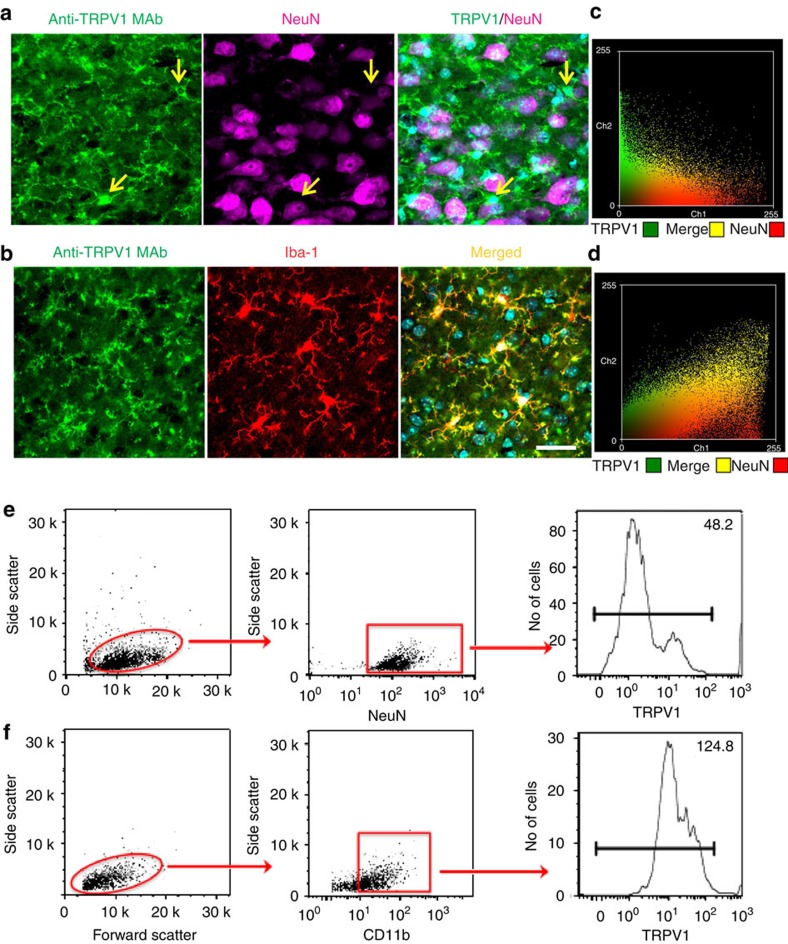
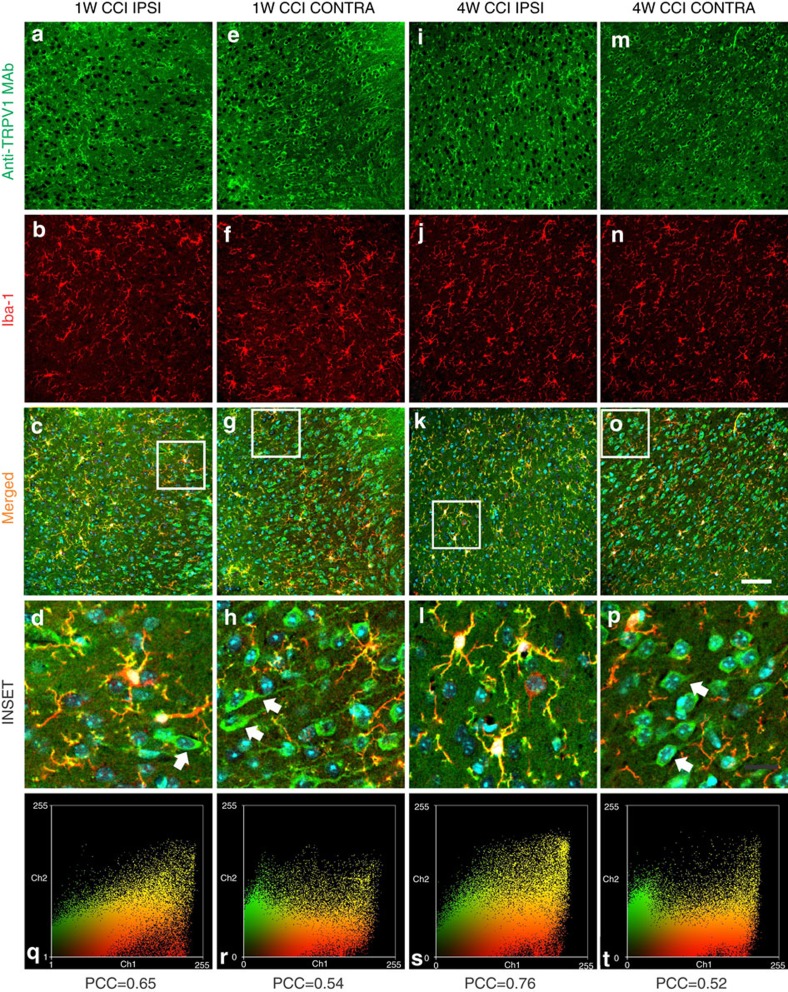
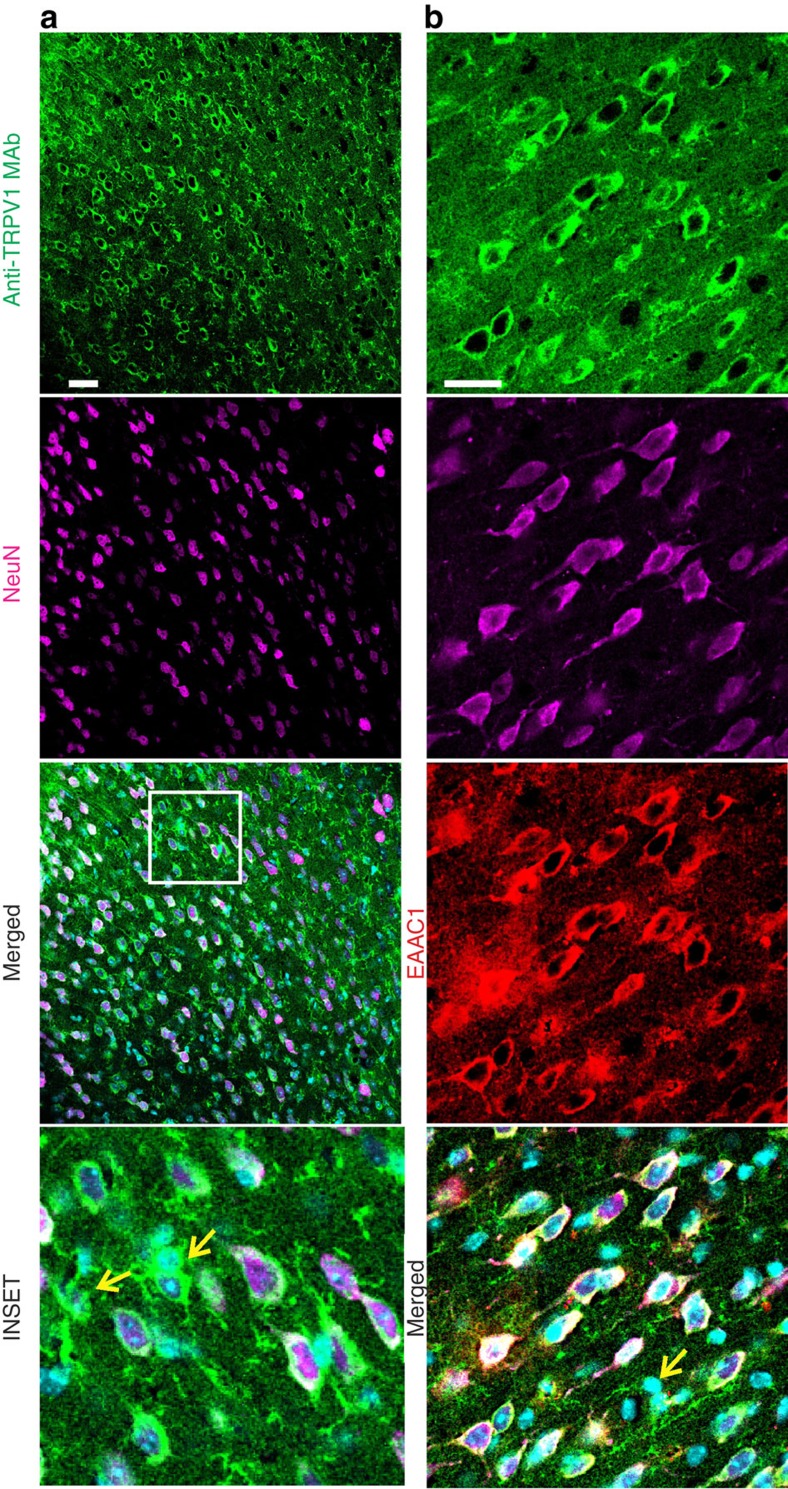
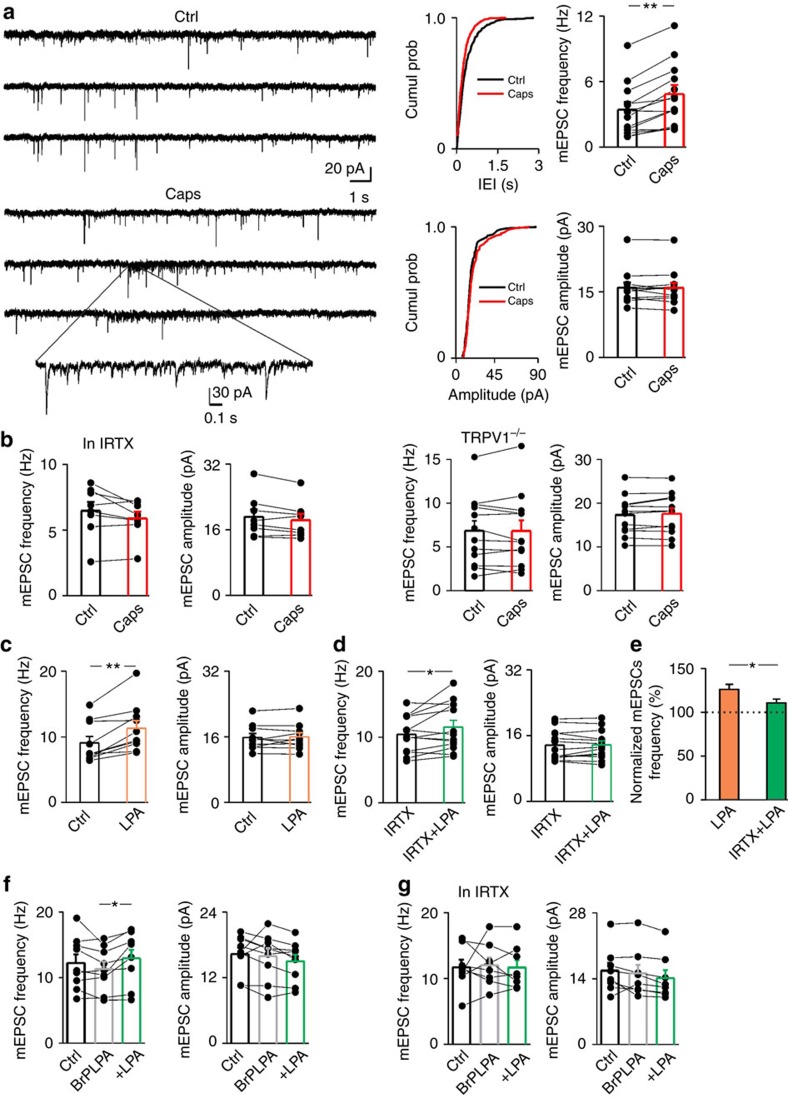
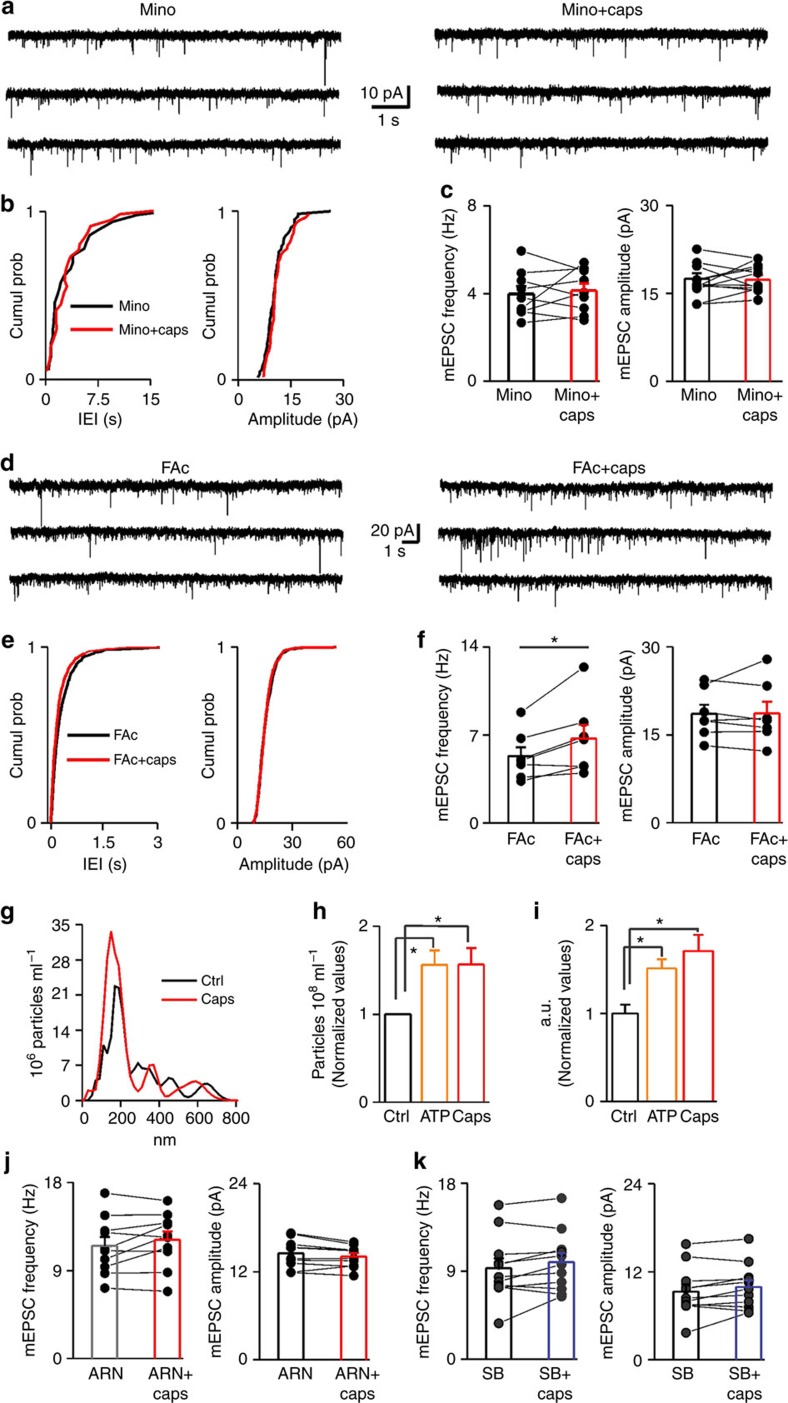
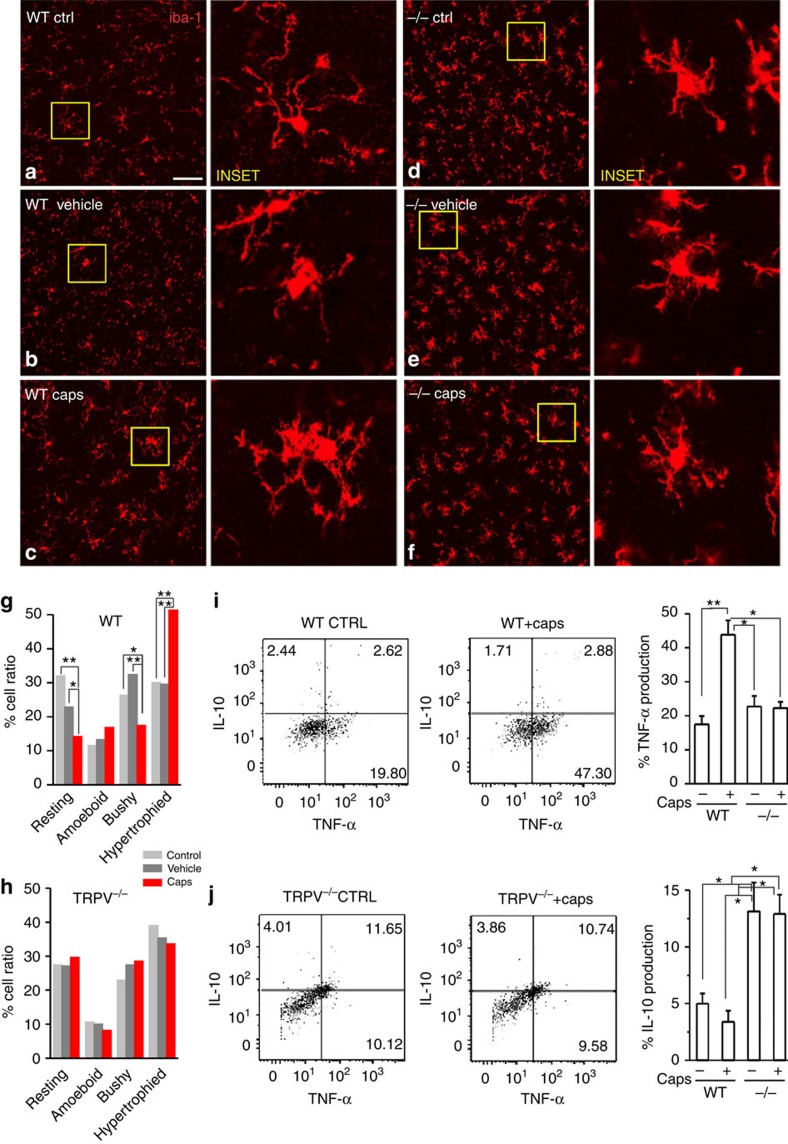
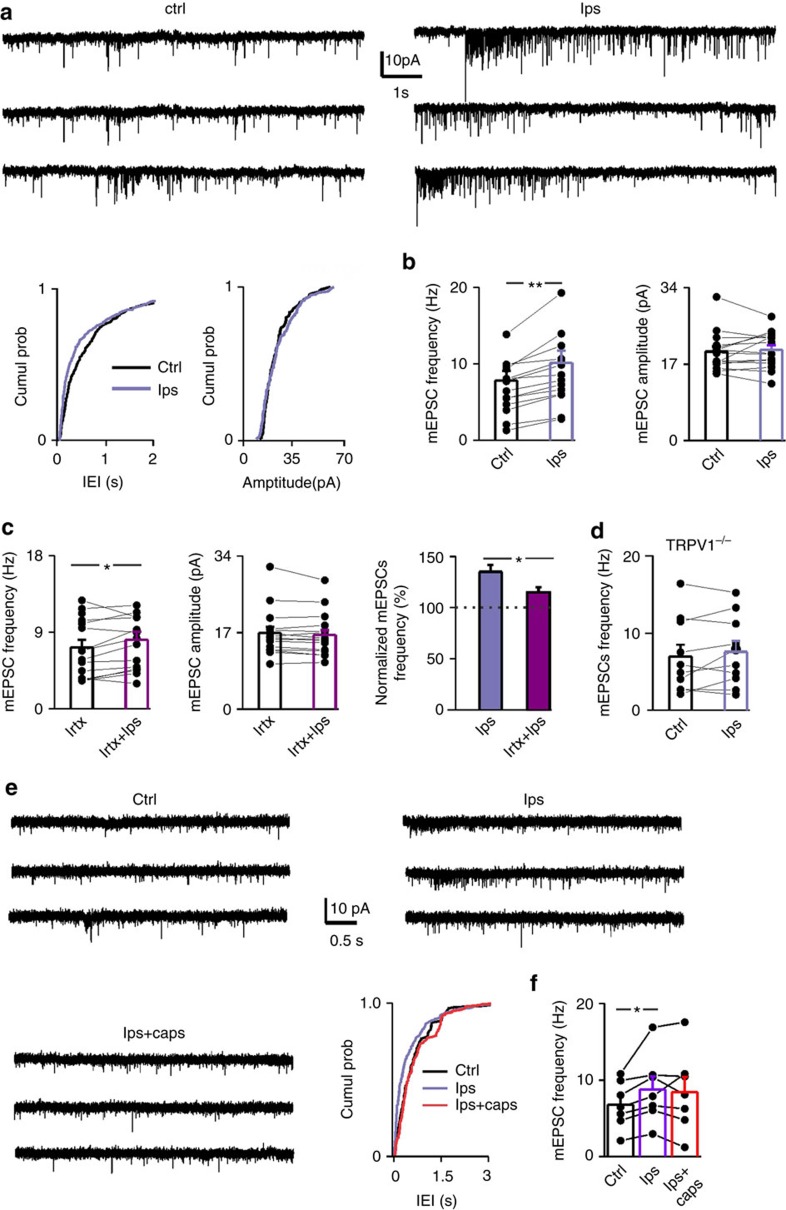
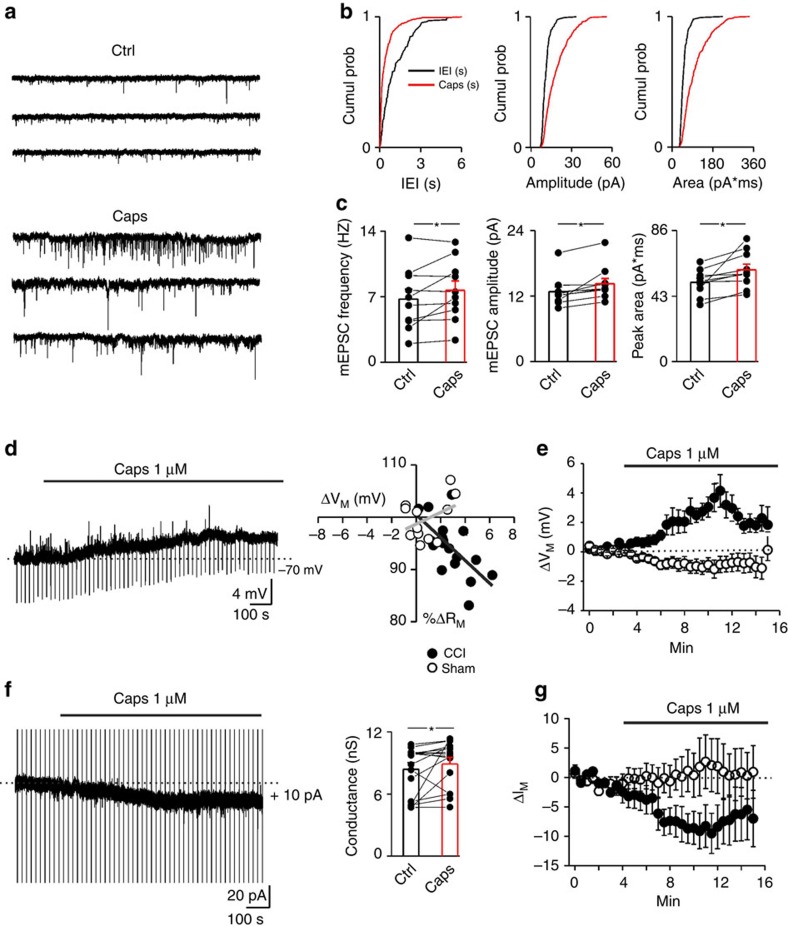
The capsaicin receptor TRPV1 has been widely characterized in the sensory system as a key component of pain and inflammation. A large amount of evidence shows that TRPV1 is also functional in the brain although its role is still debated. Here we report that TRPV1 is highly expressed in microglial cells rather than neurons of the anterior cingulate cortex and other brain areas. We found that stimulation of microglial TRPV1 controls cortical microglia activation per se and indirectly enhances glutamatergic transmission in neurons by promoting extracellular microglial microvesicles shedding. Conversely, in the cortex of mice suffering from neuropathic pain, TRPV1 is also present in neurons affecting their intrinsic electrical properties and synaptic strength. Altogether, these findings identify brain TRPV1 as potential detector of harmful stimuli and a key player of microglia to neuron communication.


Conflict of interest statement

The authors declare no competing financial interests.

Figures

Figure 1
Figure 1. TRPV1 protein expression in microglial and neuronal cells of the ACC of adult naive mice.
(a) Photomicrograph of double immunofluorescence for anti-TRPV1 MAb (green) and NeuN (magenta). The anti-TRPV1 MAb labels mainly fibers that surround neurons (NeuN positive cells) and sparse NeuN negative cytoplasm (arrows). (b) Anti-TRPV1 positive processes highly overlap with the microglial marker iba1 (in red) in the layer 2/3 of ACC. (a,b) DAPI, nuclear marker (in blue). (c,d) Graphic representation (scatter plot) of the correlation coefficient of Pearson (PCC) for quantifying the colocalization between the anti-TRPV1 and NeuN (in yellow, PCC=0.13) and anti-TRPV1 and Iba-1 (PCC=0.77). Note that higher PCC values correspond to a strong colocalization. (e,f) Neuronal and microglial cells were isolated from cortical tissue using specific magnetically labelled kits. According to physical parameters, obtained cells were gated on NeuN and CD11b for identification of neurons (e) and microglial cells (f) respectively. Surface expression of TRPV1 was analysed by means of flow cytometry. Data are representative of a single experiment and show the mean fluorescence intensity (MFI) of 3 independent pools of at least 3 mice.
Figure 2
Figure 2. TRPV1 distribution pattern in the ACC of CCI adult mice.
Beyond microglia cells (iba-1 positive, in red), the anti-TRPV1 MAb stains both the cytoplasm and apical processes of some iba1 immunonegative cells (white arrows in the INSET). This expression pattern was minor in the superficial cortical layers of the ipsilateral (IPSI; ad) than contralateral (CONTRA, eh) hemisphere of mice that underwent surgery from 1 week (1 W CCI mice). In 4-week CCI mice (il, mp), when the chronicization of pain becomes established, the anti-TRPV1 MAb labels both cytoplasm and apical processes of iba1 negative cells (green) of the CONTRA hemisphere (o,p). Note that this staining pattern is also present in the deeper layers of the ACC (o) while is absent in the IPSI hemisphere of 4 W CCI mice (k,l). (INSET) High-power views of cells from the box areas in all merged panels. (qt) Colour scatter plots representing the amount of colocalization (yellow) between the anti-TRPV1 (green) and iba-1 (red) in each condition. Smaller PCC values denote a higher expression of TRPV1 in the cytoplasm of iba1-immunonegative cells.
Figure 3
Figure 3. TRPV1 is also expressed in principal neurons of the ACC from CCI adult mice.
Contralateral ACC photomicrographs of 4 weeks CCI mice, from two independent experiments (a,b). (a) Anti-TRPV1 MAb labels both the cytoplasm and the apical dendrite of NeuN positive cells. The remnant TRPV1 positive fibers and cytoplasms probably belong to glial cells (yellow arrows). (b) Anti-TRPV1 MAb labels EAAC1 positive neurons and NeuN negative cells (yellow arrow).
Figure 4
Figure 4. TRPV1 activation increases mEPSCs onto pyramidal neurons of the ACC.
(a) Left, example traces of AMPAR mEPSCs recorded from a PN at −70 mV, in control and after 1 μM capsaicin (caps), in the presence of picrotoxin (100 μM). Below trace shows expanded trace recording during caps. Middle, cumulative distributions of mEPSC interevent interval (IEI) and amplitude from cell shown on the left (P<0.02 and P=0.32 respectively). Right, summary histograms and line series plots of mEPSC frequency and amplitude showing that capsaicin significantly increases the frequency but not the amplitude of mEPSCs (from 3.40±0.71 to 4.83±0.84 Hz, n=12, P<0.001; from 15.97±1.13 to 15.90±1.60 pA, n=12, P=0.83). Data are values from single cells (black filled circle) and mean±s.e.m. (b) Group data of mEPSC frequency and amplitude showing the lack of effect of capsaicin in the presence of the TRPV1 antagonist IRTX (left; from 6.46±0.68 to 5.88±0.50 Hz, n=8, P=0.11) or in cortical tissue from TRPV1−/− mice (right; 6.84±1.15 to 6.81±1.20 Hz, n=12, P=0.9). (c) Left, summary graph of mEPSC frequency and amplitude before (black bar; 9.10±0.96 Hz and 15.43±0.95 pA, n=10) and during 5 μM LPA (orange bar; 11.32±1.1 Hz and 15.38±1.07 pA, n=10). LPA significantly boost mEPSC frequency (P<0.002; Wilcoxon Signed Ranks Test). (d) Same as in previous graphs but in the presence of IRTX (IRTX 10.41±0.76.14, IRTX+LPA 11.54±1 Hz, n=13; P<0.05 Paired Sample T Test; IRTX 12.92±0.93,IRTX+LPA 13.01±0.93 pA, n=13). (e) Note that LPA is significantly less effective when TRPV1 is inhibited (P<0.05, Two-sample T test) (*P<0.05, **P<0.001). (f,g) In the presence of LPA1-4 metabotropic receptors antagonist BrP-LPA, LPA increases glutamatergic transmission by TRPV1 activation. (f) Left, summary graphs of mEPSC frequency and amplitude before (black bar; 12.21±1.32 Hz and 16.31±1.9 pA, n=9), during BrP-LPA (5 μM; grey bar; 11.32±1.1 Hz and 15.95±1.4 pA, n=9) and with LPA (green bar; 12.94±1.3 Hz and 15.00±1.2 pA, n=9). (g), same as in f but with the addition of IRTX (ctrl 11.71±1.14 Hz, BrLPA 12.03±1.15 Hz, BrLPA+LPA 11.67±1.16 Hz, n=8; ctrl 15.70±1.70 pA, BrLPA 15.16±1.80 pA, BrLPA+LPA 14.31±1.60 pA, n=8). (*P<0.05, Paired Sample t-Test).
Figure 5
Figure 5. TRPV1 is functionally expressed in cortical microglia and modulates synaptic transmission by microvesicles shedding.
(a) Example recording of mEPSCs before (left) and during (right) capsaicin in the presence of minocycline. (b) Cumulative probability plots comparing minocycline (black line) and minocycline plus capsaicin (red line) on mEPSC IEI and amplitude of the recording showed above (P=0.25 and P=0.31, KS test). (c) Bar histograms of group data showing the lack of capsaicin-mediated increase of mEPSC rate when microglia activation is blocked by minocycline (from 3.98±0.35 to 4.13±0.33 Hz, n=9, P=0.53; from 17.54±0.94 to 17.34±0.79 pA, n=9, P=0.70, Paired Sample t-Test). Group data are presented as single value and mean±s.e.m. (d) Example recording of mEPSCs before (left) and during (right) capsaicin in the presence of 1 mM FAc. (e) Cumulative probability plots comparing FAc (black line) and minocycline plus capsaicin (red line) on mEPSC IEI and amplitude of the recording showed above (P<0.01 and P=0.28, KS test). (f) Summary data of both mEPSC frequency and amplitude recorded in the presence of FAc before and during capsaicin application (FAc 5.30±0.72 Hz, FAc+caps 6.70±1.10 Hz, *P<0.05 Paired t-test; FAc 18.58±1.55 pA, FAc+caps 18.63±1.98 pA, n=7, P=0.89 Paired Sample t-Test). (g) Representative size profile of EVs released constitutively (black line) or upon capsaicin challenge (red line) from 5 × 10⁵ murine microglia in 500 μl of serum free medium during a period of 10 min. (h) Histogram showing the fold increase of total EV concentration detected by Nanosight upon stimulation with ATP or capsaicin (Kruskal-Wallis test, P=0,035). (i) Histogram showing the fold increase of MVs shed selectively from the plasma membrane and measured by a spectrophotometric assay under the same stimuli (Holm-Sidak's, P<0,05). (j) Group data showing that addition of ARN14988 reduces capsaicin-mediated increase of mEPSC frequency in cortical slices (from 11.51±0.92 to 12.12±0.88 Hz, P=0.15; from 14.52±0.61 to 14.10±0.46 pA, P=0.06, Paired Sample t-Test, n=10). (k) Summary graph of mEPSC frequency (left) and amplitude (right) in the presence of 2 μM SB203580 before (black bar) and after capsaicin (blue bar) (from 9.30±1.00 to 9.93±0.90 Hz, P=0.08; from 10.67±0.47 to 10.75±0.49 pA, n=11, and P=0.89, Paired Sample t-Test and Wilcoxon Signed Rank Test, respectively). Data are values from single cells and/or mean±s.e.m. *P<0.05.
Figure 6
Figure 6. The presence or absence of TRPV1 influences microglia phenotype.
(af) Sections of cortical tissue from WT and TRPV1−/− mice, fixed after exposure to ACSF (a,d), ACSF plus vehicle (DMSO; b,e) and ACSF plus 1μM capsaicin (c,f) and immune-processed for iba-1 to stain microglia cells (in red). INSETs are zoom images taken from an area delimited by the yellow square for each condition. (g), Bar graph of percentage of cortical microglia cell phenotype (resting, ameboid, bushy and hypertrophied), in control (grey bars), vehicle- (dark grey bars) and capsaicin- treated (red bars) cortical sections from WT mice. Capsaicin treatment causes a significant shift from ramified and bushy to hypertrophied morphology. (h), Same as in ‘g' but in cortical sections from TRPV1−/− mice. In these tissues capsaicin fails to induce morphological changes of microglia cells. Note that microglia cells in −/− tissues are already hypertrophied in control conditions (df,h). *P<0.05, **P<0.01 Fisher exact test. Acutely isolated CD11b+ microglial cells from WT (i) and TRPV1−/− mice (j) were cultured in the absence (−) or presence (+) of capsaicin (1 μM) for 10 min, washed and then incubated with Brefeldin A for 6 h to allow cytokine accumulation in vesicles. Intracellular production of TNF-α and IL-10 was analysed by means of flow cytometry. Data represent percentage of cytokine production±s.e.m. of 3 independent pools of at least 3 mice. *P<0.05, **P<0.01 (Bonferroni's multiple comparison test following parametric one-way Anova). Note that ‘Percentage of TNFalpha/IL-10 production' means the ‘Percentage of TNFalpha producing cells'.
Figure 7
Figure 7. TRPV1 tonically controls LPS-mediated effects.
(a) Example recording of mEPSCs in control (ctrl) and during LPS exposure (500 ng ml−1). Below the cumulative probability plot of mEPSC interevent interval and amplitude (P<0.01 and P=0.24, respectively, KS test). (b) Population plot of mEPSC frequency before (black bar and filled circle) and during LPS (violet bar and filled circle), showing that LPS, similarly to capsaicin, increases selectively the mEPSC frequency (from 7.67±1.32 to 10.09±1.73 Hz, n=14, P<0.001 Paired Sample Wilcoxon Signed Rank test) without a significant effect on the amplitude (from 20.05±1.30 to 19.76±1.32 pA, P=0.5 Paired Sample t-Test). (c) As in b, but in the presence of 300 nM IRTX (from 6.8±1.06 to 7.78±1.19 Hz, n=14, P<0.01 Paired Sample Wilcoxon Signed Rank test; from 17.47±1.17 to 17.11±1.23 pA, P=0.09 Paired Sample Wilcoxon Signed Rank test). Right, the percentage increase of mEPSC frequency by LPS in the presence of the TRPV1 antagonist IRTX, is significantly reduced compared with the rate enhancement induced by LPS applied alone (P=0.01 Mann–Whitney test). (d) Population data of mEPSC frequency in control and during LPS obtained from PNs of TRPV1−/− mice (from 7.36±1.90 to 7.69±1.81 Hz, n=9, P=0.52 Two Samples t-Test). (e) Trace records from a PN in control condition (ctrl), in LPS and LPS plus capsaicin. Following LPS perfusion, capsaicin is no longer able to further facilitate glutamatergic neurotransmission. Right below, cumulative distribution probability of the interevent intervals from the same neuron (ctrl versus LPS P>0.0001, LPS versus caps P<0.0001, ctrl versus caps P=0.54). (f) Summary graph of mEPSC frequency before (black bar), during LPS (violet bar) and LPS+caps (red bar) (ctrl 6.69±1.15 LPS 8.78±1.68 Hz, LPS+caps 8.45±1.97 Hz, n=7,ctrl versus LPSP<0.05, LPS versus LPS+caps P=0.68, ctrl versus LPS+caps P=0.15 Paired Sample t-Test;. Data are values from single cells and/or mean±s.e.m. *P<0.05, **P<0.001.
Figure 8
Figure 8. Neuronal TRPV1 stimulation directly modulates layer 2/3 pyramidal neuron synaptic strength in CCI mice.
(a) Example recording of mEPSCs before and during capsaicin from a CCI pyramidal neuron. Note that capsaicin increases both the frequency and amplitude of mEPSCs. (b) Cumulative probability plots comparing the IEI (left panel), amplitude (middle panel) and area (right panel) of control mEPSCs with those recorded in capsaicin, (KS-test P<0.001). (c) Summary graph of mEPSC frequency (left), amplitude (middle) and peak area (right) before (black bar, solid circle) and during capsaicin (red bar, solid circles) (frequency from 6.73±1.05 to 7.66±1.02 Hz, P=0.05 Paired Sample t-Test; amplitude from 12.90±0.84 to 14.26±0.95 pA, P<0.01 Paired Sample Wilcoxon Signed Rank test; Area from 52.03±2.67 to 60.20±3.74 pA*ms, P<0.05 Paired Sample t- test; n=10). (d) Left, current-clamp recording of a pyramidal neuron responding to capsaicin with depolarization and reduced RM. Negative deflections are membrane potential responses to negative current injections (60pA). Right, plot of %ΔRM (normalized to pre- capsaicin values) versus ΔVM (membrane potential values in capsaicin subtracted from baseline ones) in all tested neurons from CCI and sham mice (n=18 and n=12, filled and white symbols, respectively). These data were analysed by performing a linear fit to evaluate the strength of association between the two variables, through the coefficient of determination r2. In sham, ΔRM values do not correlate with variations in ΔVM (r2=0.07) while in PNs from CCI mice, capsaicin-induced changes of VM correlate with a RM with a value of r2=0.36. (e), Summary time plot of subtracted membrane potential (ΔVM) of CCI and sham PNs in response to capsaicin (P<0.001, Two Sample t-Test). (f) Left, example of voltage-clamp recording (at −70mV) of a CCI PN responding to capsaicin with an inward shift of the holding current. Vertical deflections (truncated in the figure) are membrane current responses to voltage steps to test passive properties and recording stability. Right, population graph of membrane conductance in control (black bar) and during capsaicin perfusion (red bar; n=12; *P<0.05 Paired Sample Wilcoxon Signed Rank test). (g), Summary plot of ΔIM (membrane current values during capsaicin subtracted to baseline values) versus time for PNs from sham and CCI mice (n=12 and n=14, respectively; P<0.001, Mann–Whitney test).

Similar articles

Cited by

References

    1. Caterina M. J. et al.. The capsaicin receptor: a heat-activated ion channel in the pain pathway. Nature 389, 816–824 (1997). - PubMed
    1. Acs G., Biro T., Acs P., Modarres S. & Blumberg P. M. Differential activation and desensitization of sensory neurons by resiniferatoxin. J. Neurosci. 17, 5622–5628 (1997). - PMC - PubMed
    1. Bohlen C. J. et al.. A bivalent tarantula toxin activates the capsaicin receptor, TRPV1, by targeting the outer pore domain. Cell 141, 834–845 (2010). - PMC - PubMed
    1. Szallasi A. & Blumberg P. M. Vanilloid (Capsaicin) receptors and mechanisms. Pharmacol. Rev. 51, 159–212 (1999). - PubMed
    1. Van Der Stelt M. & Di Marzo V. Endovanilloids. Putative endogenous ligands of transient receptor potential vanilloid 1 channels. Eur. J. Biochem. 271, 1827–1834 (2004). - PubMed

Publication types