. 2017 Sep;95(9):1712-1729.
doi: 10.1002/jnr.24067. Epub 2017 May 10.

Sustained activation of ERK1/2 MAPK in Schwann cells causes corneal neurofibroma

Affiliations

Sustained activation of ERK1/2 MAPK in Schwann cells causes corneal neurofibroma

Paola Bargagna-Mohan et al. J Neurosci Res. 2017 Sep.

Abstract

Recent studies have shown that constitutive activation of extracellular signal-regulated kinases 1 and 2 (ERK1/2) in Schwann cells (SCs) increases myelin thickness in transgenic mice. In this secondary analysis, we report that these transgenic mice develop a postnatal corneal neurofibroma with the loss of corneal transparency by age six months. We show that expansion of non-myelinating SCs, under the control of activated ERK1/2, also drive myofibroblast differentiation that derives from both SC precursors and resident corneal keratocytes. Further, these mice also harbor activated mast cells in the central cornea, which contributes to pathological corneal neovascularization and fibrosis. This breach of corneal avascularity and immune status is associated with the growth of the tumor pannus, resulting in a corneal stroma that is nearly four times its normal size. In corneas with advanced disease, some axons became ectopically myelinated, and the disruption of Remak bundles is evident. To determine whether myofibroblast differentiation was linked to vimentin, we examined the levels and phosphorylation status of this fibrotic biomarker. Concomitant with the early upregulation of vimentin, a serine 38-phosphorylated isoform of vimentin (pSer38vim) increased in SCs, which was attributed primarily to the soluble fraction of protein-not the cytoskeletal portion. However, the overexpressed pSer38vim became predominantly cytoskeletal with the growth of the corneal tumor. Our findings demonstrate an unrecognized function of ERK1/2 in the maintenance of corneal homeostasis, wherein its over-activation in SCs promotes corneal neurofibromas. This study is also the first report of a genetically engineered mouse that spontaneously develops a corneal tumor.

Keywords: AB_10013383; AB_141637; AB_2107448; AB_2216097; AB_2223021; AB_2257290; AB_2315112; AB_306067; AB_444319; AB_476744; AB_628437; ERK; Schwann cells; corneal fibrosis; neurofibroma; soluble vimentin.


Conflict of interest statement

CONFLICT OF INTEREST

The authors have no conflicts of interest.

Figures

Figure 1
Figure 1
Ocular manifestations of CnpCre;MekDD/+ mouse line. A: Representative image of a 6.3 M control mouse eye. B: Representative image of a 6.3 M CnpCre;MekDD/+ (Mutant) mouse eye. C–D: Epifluorescence analysis of 6.3 M control (C), and CnpCre;MekDD/+ (D) (Mutant) mouse corneal sections stained with 4',6-diamidino-2-phenylindole (DAPI, blue). Magnification 10×, scale bar= 215 µm. Epith= epithelium; Str= Stroma; Endo= endothelium. n= 3 for each group.
Figure 2
Figure 2
Transmission electron microscopy analysis of corneas from control and CnpCre;MekDD/+ mice. A: Representative image of a 6.3 M control cornea, showing a stratified epithelium (Epith), and stroma. Panel i: Higher magnification of the basal epithelial layer, the basement membrane (BM), and partial stroma. Panel ii: Higher magnification of a spindle-like fibroblast (black arrow), embedded in collagen fibers. Note the presence of a corneal nerve (asterisk). B: Representative image of a 6.3 M CnpCre;MekDD/+ (Mutant) cornea (n=3). Between an irregular epithelium (Epith) and stroma, the thick tumor pannus is observed (dotted parenthesis) overlying the normal stroma. Panel i: Enlarged blood vessel (BV). Panel ii: Border (marked by dotted line) between pannus and stroma revealing a large blood vessel (BV) in the pannus. Panel iii: Disrupted collagen fibers (asterisks) in close proximity to more normal appearing collagen (black arrows). Panel iv: Higher magnification of the basal epithelial layer showing degeneration of the basement membrane (black arrows). Each image displays its scale bar measurements.
Figure 2
Figure 2
Transmission electron microscopy analysis of corneas from control and CnpCre;MekDD/+ mice. A: Representative image of a 6.3 M control cornea, showing a stratified epithelium (Epith), and stroma. Panel i: Higher magnification of the basal epithelial layer, the basement membrane (BM), and partial stroma. Panel ii: Higher magnification of a spindle-like fibroblast (black arrow), embedded in collagen fibers. Note the presence of a corneal nerve (asterisk). B: Representative image of a 6.3 M CnpCre;MekDD/+ (Mutant) cornea (n=3). Between an irregular epithelium (Epith) and stroma, the thick tumor pannus is observed (dotted parenthesis) overlying the normal stroma. Panel i: Enlarged blood vessel (BV). Panel ii: Border (marked by dotted line) between pannus and stroma revealing a large blood vessel (BV) in the pannus. Panel iii: Disrupted collagen fibers (asterisks) in close proximity to more normal appearing collagen (black arrows). Panel iv: Higher magnification of the basal epithelial layer showing degeneration of the basement membrane (black arrows). Each image displays its scale bar measurements.
Figure 3
Figure 3
Immunofluorescence analysis of Schwann cell markers in CnpCre;MekDD/+ corneas from mice of different age groups. A: Representative images of corneal sections stained for GFAP (red), and EGFP expression (green). Enlarged inserts display overlap of GFAP with EGFP. B: Representative images of corneal sections stained for S-100 (red), and EGFP expression (green). C: Representative images of corneal sections stained for KROX-20 (red) with overlap of EGFP expression (green). D: Representative images of corneas stained for MBP (red) and EGFP expression (green) at 8.0 M. Enlarged inserts display overlap of MBP with EGFP. 10× magnification, scale bar = 215 µm. Epith= epithelium; Str= stroma; Endoth= endothelium. Nuclei stained with DAPI (blue). n= 3–6/group.
Figure 3
Figure 3
Immunofluorescence analysis of Schwann cell markers in CnpCre;MekDD/+ corneas from mice of different age groups. A: Representative images of corneal sections stained for GFAP (red), and EGFP expression (green). Enlarged inserts display overlap of GFAP with EGFP. B: Representative images of corneal sections stained for S-100 (red), and EGFP expression (green). C: Representative images of corneal sections stained for KROX-20 (red) with overlap of EGFP expression (green). D: Representative images of corneas stained for MBP (red) and EGFP expression (green) at 8.0 M. Enlarged inserts display overlap of MBP with EGFP. 10× magnification, scale bar = 215 µm. Epith= epithelium; Str= stroma; Endoth= endothelium. Nuclei stained with DAPI (blue). n= 3–6/group.
Figure 4
Figure 4
Sustained activation of ERK1/2 induces corneal nerve myelination in CnpCre;MekDD/+ mice. Transmission electron microscopy (TEM) analysis of corneal nerve, and Schwann cells in 6.3 M control (panel A) and CnpCre;MekDD/+ mouse corneas (panels B, C; n= 3). B: Note the presence of myelinated axons (a large oblong-shaped structure next to a small round structure, arrows) ensheathed by myelinating Schwann cells. C: Numerous axons (thick short arrows) with some ensheathed by an electron dense cell, and other axons showing disruption from their compact organization in close proximity to a blood vessel (bv). The fine arrow points to a myelinated axon. Asterisks demark the nucleus of Schwann cells (B, C). D: IHC analysis of 8.0 M CnpCre;MekDD/+ mouse cornea stained with anti-βIII-tubulin antibody (red) with overlap of EGFP (green). N = 3. Magnification 30×, scale bar = 35 µm. In the enlarged images of the dotted area in panel D the arrows point to EGFP-positive Schwann cell (green) wrapping nerves (red). Magnification 60×, scale bar = 35 µm.
Figure 5
Figure 5
Sustained activation of ERK1/2 recruits mast cell into corneas of the CnpCre;MekDD/+ mouse line. Representative images of CnpCre;MekDD/+ mouse corneal sections stained with hematoxlin and eosin (H&E) in mutant mice from different age groups. Dotted rectangles represent the enlarged images of the central corneas stained with Giemsa dye. Giemsa-negative staining at 2.2 M in mutant corneas (A). Giemsa-positive mast cells present in the central cornea at 4.0 M (B, asterisks) and 6.3 M (C, asterisks). Panel C represents a TEM image of a mast cell. D: Scatter plot of mast cell numbers present in the central corneas of control (CONT), and CnpCre;MekDD/+ (MUT) mice at different postnatal ages (12 sections/group).
Figure 6
Figure 6
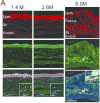
Sustained activation of ERK1/2 induces age-dependent up-regulation of vimentin in the CnpCre;MekDD/+ mouse corneas. Immunofluorescence analysis of control, and CnpCre;MekDD/+ (Mutant) mouse corneas stained for vimentin (red) and EGFP (green) at early (2.6 M), and late time points (8.0 M). Enlarged inserts in panel B display overlap of vimentin with EGFP at 2.6 M and 8.0 M. Magnification 10×, scale bar = 215 µm. Epith= epithelium; Str= stroma; Endoth= endothelium. Nuclei stained with DAPI (blue). n= 3–4/group.
Figure 7
Figure 7
Sustained activation of ERK1/2 induces age-dependent up-regulation of α-SMA in the CnpCre;MekDD/+ mouse corneas. Immunofluorescence analysis of control and CnpCre;MekDD/+ (Mutant) mouse corneas stained with α-SMA antibody (red) with overlap of EGFP expression (green) at early and late time points. Enlarged inserts display overlap of α-SMA with EGFP at 2.6 M. The 8 M mutant corneas show extensive overlap of α-SMA with EGFP (asterisks). Magnification 10×, scale bar = 215 µm. Epith= epithelium; Str= stroma; Endoth= endothelium. Nuclei stained with DAPI (blue). n= 3–5/group.
Figure 8
Figure 8
Sustained activation of ERK1/2 induces age-dependent up-regulation of vimentin expression. Representative western blot analysis of soluble (A) and insoluble extracts (B) from control (Cont) and CnpCre;MekDD/+ (Mut) samples at early, and late time points. Blots were probed with antibodies against vimentin (clone V9), and β-actin was used as loading control. Scatter plots of data from densitometric quantification of soluble (C) and insoluble vimentin (D) normalized to β-actin levels using ImageJ software. Western blots are the mean of 3 independent experiments from analysis employing n=9 mice/group.
Figure 9
Figure 9
Sustained activation of ERK1/2 induces age-dependent up-regulation of phosphorylated vimentin in the CnpCre;MekDD/+ mouse line. Immunofluorescence analysis of control, and CnpCre;MekDD/+ (Mutant) mouse corneas stained with pSer38Vim antibody (red) with overlap of EGFP expression (green) at different postnatal time points. Enlarged inserts in panel B display overlap of pSer38Vim with EGFP at different post-natal time points. At 10× magnification, the scale bar = 215 µm. At 30× magnification, scale bar = 70 µm. Epith= epithelium; Str= stroma; Endoth= endothelium. Nuclei stained with DAPI (blue). n= 3–6/group.
Figure 10
Figure 10
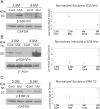
Sustained activation of ERK1/2 regulates pSer38Vim solubility in CnpCre;MekDD/+ mouse line. Representative western blot analysis of soluble (A) and insoluble (B) fractions from control (Cont), and CnpCre;MekDD/+ (Mut) samples at different post-natal time points. Blots were probed with antibodies against pSer38Vim (A,B). GAPDH or β-actin was used as loading controls. Representative western blot analysis of soluble fractions from control (Cont), and CnpCre;MekDD/+ (Mut) samples at different post-natal time points probed for p-ERK1/2 expression (C). Scatter plots of data from densitometric quantification of soluble pSer38Vim (A), and insoluble pSer38Vim (B) normalized to GAPDH or β-actin levels using ImageJ software. Scatter plots of densitometric quantification of pERK/12 normalized to GAPDH (C). Western blots are the mean of 3 independent experiments from analysis employing n=9 mice/group.
Figure 11
Figure 11
Activated Schwann cells express vimentin and p-ERK1/2. A: Representative western blot analysis of soluble fractions from control (Cont) and PDGF-treated Schwann cells. Blots were probed with antibodies against pSer38Vim, and p-ERK1/2. Total ERK1/2 (ERK1/2) used as loading control. Scatter plot of data from densitometric quantification of soluble pSer38Vim, and p-ERK1/2, normalized to total ERK1/2 using ImageJ software. Western blot data are the mean of 3 independent cell culture experiments. B: Immunoprecipitation analysis of Schwann cells. Equal amount of soluble cell lysates from control and PDGF-treated cells were immunoprecipitated with anti-pERK1/2 antibody, and then protein blots were probed with anti-pSer38Vim antibody followed by total ERK antibody.

Similar articles

Cited by

References

    1. Ambati BK, Nozaki M, Singh N, Takeda A, Jani PD, Suthar T, Albuquerque RJ, Richter E, Sakurai E, Newcomb MT, Kleinman ME, Caldwell RB, Lin Q, Ogura Y, Orecchia A, Samuelson DA, Agnew DW, St Leger J, Green WR, Mahasreshti PJ, Curiel DT, Kwan D, Marsh H, Ikeda S, Leiper LJ, Collinson JM, Bogdanovich S, Khurana TS, Shibuya M, Baldwin ME, Ferrara N, Gerber HP, De Falco S, Witta J, Baffi JZ, Raisler BJ, Ambati J. Corneal avascularity is due to soluble VEGF receptor-1. Nature. 2006;443(7114):993–997. - PMC - PubMed
    1. Bargagna-Mohan P, Lei L, Thompson A, Shaw C, Kasahara K, Inagaki M, Mohan R. Vimentin Phosphorylation Underlies Myofibroblast Sensitivity to Withaferin A In Vitro and during Corneal Fibrosis. PLoS One. 2015;10(7):e0133399. - PMC - PubMed
    1. Bargagna-Mohan P, Paranthan RR, Hamza A, Zhan CG, Lee DM, Kim KB, Lau DL, Srinivasan C, Nakayama K, Nakayama KI, Herrmann H, Mohan R. Corneal anti-fibrotic switch identified in genetic and pharmacological deficiency of vimentin. J Biol Chem. 2012;287(2):989–1006. - PMC - PubMed
    1. Belmonte C, Acosta MC, Gallar J. Neural basis of sensation in intact and injured corneas. Exp Eye Res. 2004;78(3):513–525. - PubMed
    1. Brunet A, Roux D, Lenormand P, Dowd S, Keyse S, Pouyssegur J. Nuclear translocation of p42/p44 mitogen-activated protein kinase is required for growth factor-induced gene expression and cell cycle entry. EMBO J. 1999;18(3):664–674. - PMC - PubMed

Publication types

Substances