. 2017 Jul 10;35(20):2251-2259.
doi: 10.1200/JCO.2017.73.0143. Epub 2017 May 10.

AKT Inhibition in Solid Tumors With AKT1 Mutations

Affiliations

AKT Inhibition in Solid Tumors With AKT1 Mutations

David M Hyman et al. J Clin Oncol. .

Erratum in

  • Errata.
    [No authors listed] [No authors listed] J Clin Oncol. 2019 Feb 1;37(4):360. doi: 10.1200/JCO.18.02209. J Clin Oncol. 2019. PMID: 30695659 Free PMC article. No abstract available.

Abstract

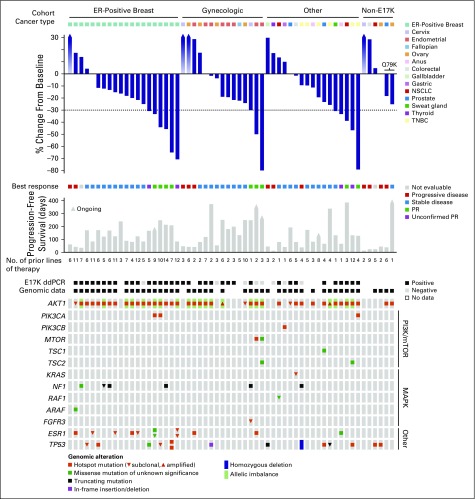
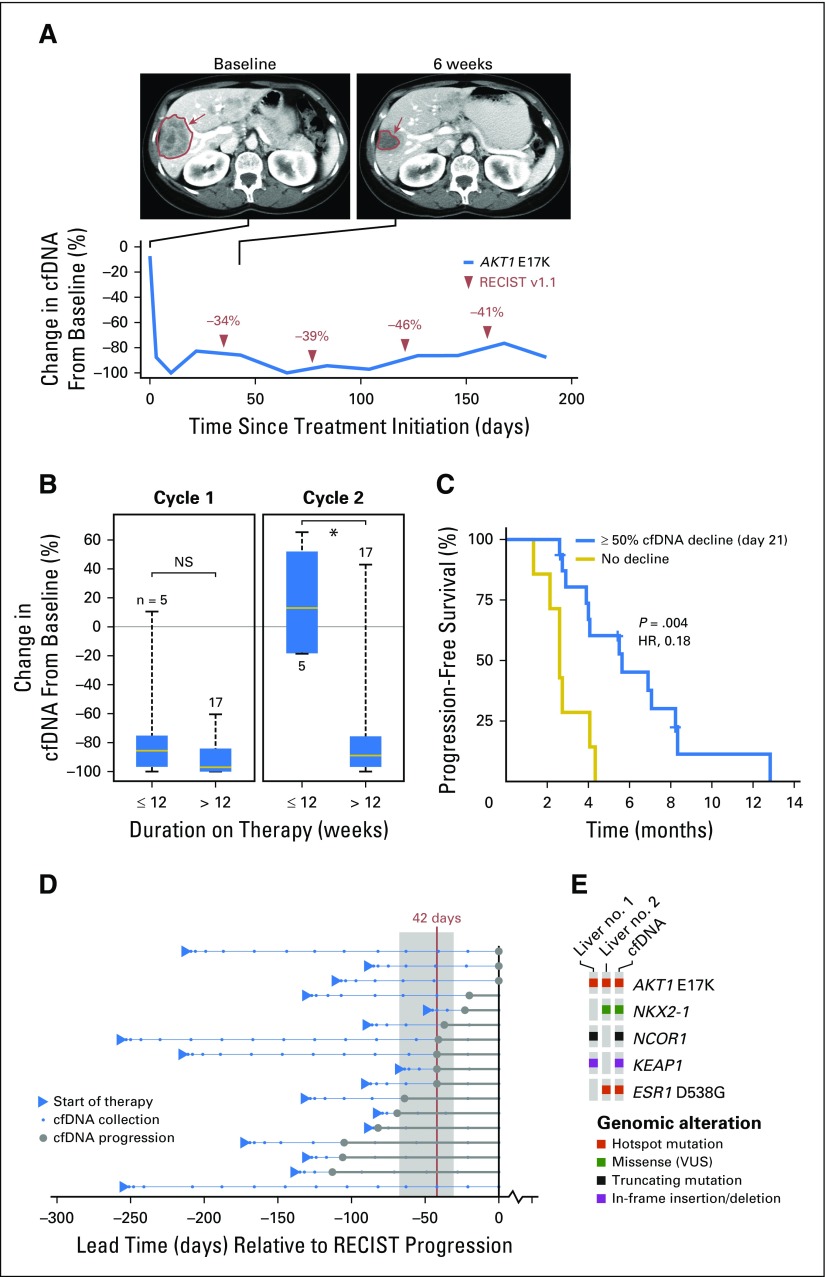
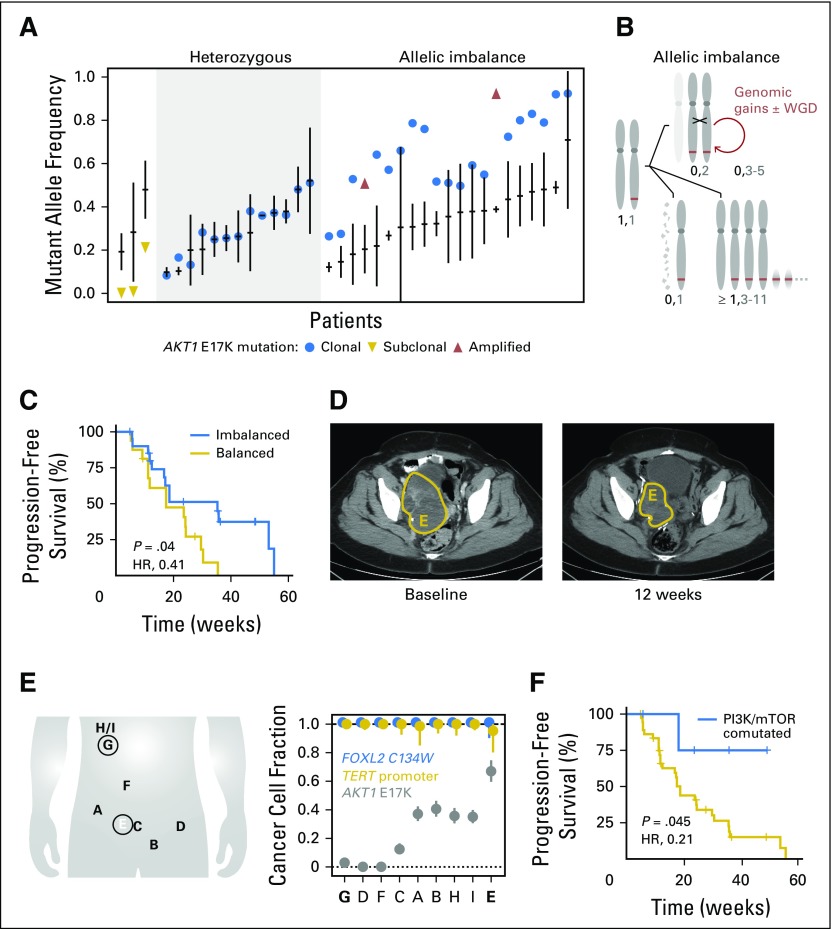
Purpose AKT1 E17K mutations are oncogenic and occur in many cancers at a low prevalence. We performed a multihistology basket study of AZD5363, an ATP-competitive pan-AKT kinase inhibitor, to determine the preliminary activity of AKT inhibition in AKT-mutant cancers. Patients and Methods Fifty-eight patients with advanced solid tumors were treated. The primary end point was safety; secondary end points were progression-free survival (PFS) and response according to Response Evaluation Criteria in Solid Tumors (RECIST). Tumor biopsies and plasma cell-free DNA (cfDNA) were collected in the majority of patients to identify predictive biomarkers of response. Results In patients with AKT1 E17K-mutant tumors (n = 52) and a median of five lines of prior therapy, the median PFS was 5.5 months (95% CI, 2.9 to 6.9 months), 6.6 months (95% CI, 1.5 to 8.3 months), and 4.2 months (95% CI, 2.1 to 12.8 months) in patients with estrogen receptor-positive breast, gynecologic, and other solid tumors, respectively. In an exploratory biomarker analysis, imbalance of the AKT1 E17K-mutant allele, most frequently caused by copy-neutral loss-of-heterozygosity targeting the wild-type allele, was associated with longer PFS (hazard ratio [HR], 0.41; P = .04), as was the presence of coincident PI3K pathway hotspot mutations (HR, 0.21; P = .045). Persistent declines in AKT1 E17K in cfDNA were associated with improved PFS (HR, 0.18; P = .004) and response ( P = .025). Responses were not restricted to patients with detectable AKT1 E17K in pretreatment cfDNA. The most common grade ≥ 3 adverse events were hyperglycemia (24%), diarrhea (17%), and rash (15.5%). Conclusion This study provides the first clinical data that AKT1 E17K is a therapeutic target in human cancer. The genomic context of the AKT1 E17K mutation further conditioned response to AZD5363.


Figures

Fig 1.
Fig 1.
Integrated treatment outcome and genomics of AKT1 E17K–mutant solid tumors. Data are shown for 58 patients and grouped by membership in the AKT1 E17K–mutant breast, gynecologic, and other solid tumor cohorts followed by patients with non-E17K AKT1 mutations. From top to bottom: Best change from baseline in the target lesion diameter according to Response Evaluation Criteria in Solid Tumors (RECIST) version 1.1 (gradient arrows reflect not evaluable); duration of therapy (days); and genomic annotation from pretreatment tumor tissue or cell-free DNA (cfDNA) sequencing. All genes in the mutational heat map, including AKT1, reflect results from pretreatment centrally determined genomic data rather than local testing. Twelve patients enrolled lacked genomic data (track: Genomic data). Individual mutations are shown as annotated in the accompanying legend, and subclonality was determined as described in the Data Supplement. Individual annotation tracks annotate the cancer type, best response, the detection of AKT1 E17K by droplet digital polymerase chain reaction (ddPCR) analysis in baseline plasma samples, and the existence of pretreatment genomic data from either tumor tissue or cfDNA sequencing. ER, estrogen receptor; NSCLC, non–small-cell lung cancer; PR, partial response; TNBC, triple-negative breast cancer.
Fig 2.
Fig 2.
Noninvasive monitoring of treatment response in cell-free DNA (cfDNA). (A) Imaging at baseline and 6 weeks after treatment initiation indicates a response (in red) to AZD5363 in an E17K-mutant, estrogen receptor (ER) –positive, human epidermal growth factor receptor 2 (HER2) –negative breast cancer that was confirmed molecularly with an initial decrease in, and persistently low levels of, the AKT1 E17K burden in cfDNA. (B) Tumor burden, indicated by a greater than 50% decrease in AKT1 E17K–mutant allele fraction in circulating cfDNA, was evident in all but one patient (95.5%) by day 11 of treatment cycle 1 but did not correlate with outcome as measured by a duration of therapy of greater than 12 weeks (left). Data are shown for 23 patients with longitudinal cfDNA samples collected throughout treatment and who were positive for AKT1 E17K by droplet digital polymerase chain reaction analysis at baseline. (C) A decline of circulating AKT1 E17K of greater than 50% at day 21 compared with before treatment was correlated with response to AKT inhibition (hazard ratio [HR], 0.18; P = .004). (D) In evaluable patients (Data Supplement), cfDNA progression (increase in AKT1 E17K allele fraction of > 50% above nadir) preceded radiographic progression by a median of 42 days (range, 0 to 113 days) Each line is a patient, all cfDNA collection time points are shown normalized to the date of Response Evaluation Criteria in Solid Tumors (RECIST) progression, and the arrowheads indicate the start of therapy. Filled circles correspond to the time point of cfDNA progression, as defined earlier, and the vertical line indicates median lead time of cfDNA progression relative to radiologic progression (shaded area is the 95% CI of lead times). The bottom-most patient had a radiologic progression without AKT1 E17K increase in cfDNA. (E) Broader next-generation sequencing of pretreatment cfDNA in one patient captured the complete mutational profile of genetically heterogeneous individual tumor sites. NS, not significant; VUS, variant of unknown significance.
Fig 3.
Fig 3.
Clonality of the sensitizing biomarker. (A) For 37 patients with sufficient baseline sequencing data, AKT1 E17K–mutant allele frequency is shown (filled circle), as is the median allele frequency of all somatic mutations detected in each patient (horizontal line; vertical line is the median absolute deviation) from pretreatment tumor tissue or cell-free DNA (cfDNA) sequencing. Patients with focal amplification of AKT1 E17K are indicated by upward-pointing triangles, whereas patients possessing subclonal AKT1 E17K are indicated by downward-pointing triangles. Patients are grouped as having a heterozygous AKT1 E17K (left) or possessing high mutant allele fraction (right). (B) Schematic of the acquisition of AKT1 E17K–mutant (thick line) allele imbalance in this study cohort, beginning from a heterozygous mutation in a diploid genome and chromosome 14 (leftmost; maternal and paternal chromosomes are indicated). Allelic imbalance is in the form of copy-neutral loss of heterozygosity that duplicates the mutant allele (top) and can be followed by other serial genetic changes including genomic gains and whole-genome duplication (WGD) or either heterozygous loss of the wild-type copy (bottom left) or whole chromosome or more focal gains of the mutant allele (Data Supplement). (C) AKT1 E17K–mutant allele imbalance by any of the mechanisms described in panel B is associated with improved progression-free survival (PFS) in response to AKT inhibition (median PFS, 8.2 v 4.1 months in patients whose tumors exhibited allelic imbalance of AKT1 E17K v those without it, respectively; hazard ratio [HR], 0.41; P = .04). (D) A patient with an ovarian granulosa cell tumor received AZD5363 for 8 months and achieved a best response of 24% tumor regression (right pelvic tumor regression shown), a notable response that was far greater than what would have been predicted based on the frequency of the sensitizing AKT1 mutation. (E) Sequencing of eight metastatic sites sampled before therapy revealed that whereas the earliest occurring lesions were clonal (FOXL2 and TERT), the AKT1 mutation was variably subclonal across the lesions and was present at highest cellular fraction (67%, subclonal) in the right pelvic tumor that achieved the best response to AZD5363 therapy (labeled E in panel D). (F) The presence of coincident activating mutations in either up- or downstream effectors of PI3K/mTOR signaling in AKT1 E17K–mutant tumors was associated with improved PFS (median PFS, not reached v 4.3 months without such lesions; HR, 0.21; P = .045).

References

    1. Shaw RJ, Cantley LC. Ras, PI(3)K and mTOR signalling controls tumour cell growth. Nature. 2006;441:424–430. - PubMed
    1. Vivanco I, Sawyers CL. The phosphatidylinositol 3-kinase AKT pathway in human cancer. Nat Rev Cancer. 2002;2:489–501. - PubMed
    1. Engelman JA. Targeting PI3K signalling in cancer: Opportunities, challenges and limitations. Nat Rev Cancer. 2009;9:550–562. - PubMed
    1. Samuels Y, Wang Z, Bardelli A, et al. High frequency of mutations of the PIK3CA gene in human cancers. Science. 2004;304:554. - PubMed
    1. Sansal I, Sellers WR. The biology and clinical relevance of the PTEN tumor suppressor pathway. J Clin Oncol. 2004;22:2954–2963. - PubMed

MeSH terms