. 2017 Jun 20;8(25):41348-41363.
doi: 10.18632/oncotarget.17298.

Ephrin-B2/Fc promotes proliferation and migration, and suppresses apoptosis in human umbilical vein endothelial cells

Affiliations

Ephrin-B2/Fc promotes proliferation and migration, and suppresses apoptosis in human umbilical vein endothelial cells

Li-Chun Zheng et al. Oncotarget. .

Abstract

Tumor growth and metastasis are angiogenesis dependent. Angiogenic growth involves endothelial cell proliferation, migration, and invasion. Ephrin-B2 is a ligand for Eph receptor tyrosine kinases and is an important mediator in vascular endothelial growth factor-mediated angiogenesis. However, research offer controversial information regarding effects of ephrin-B2 on vascular endothelial cells. In this paper, proteome analyses showed that ephrin-B2/Fc significantly activates multiple signaling pathways related to cell proliferation, survival, and migration and suppresses apoptosis and cell death. Cytological experiments further confirm that ephrin-B2/Fc stimulates endothelial cell proliferation, triggers dose-dependent migration, and suppresses cell apoptosis. Results demonstrate that soluble dose-dependent ephrinB2 can promote proliferation and migration and inhibit apoptosis of human umbilical vein endothelial cells. These results also suggest that ephrinB2 prevents ischemic disease and can potentially be a new therapeutic target for treating angiogenesis-related diseases and tumors.

Keywords: ephrin-B2; human umbilical vein endothelial cell; migration; proliferation; proteomic analysis.


Conflict of interest statement

CONFLICTS OF INTEREST

The authors declare no conflicts of interest.

Figures

Figure 1
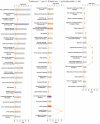
Figure 1. Differentially expressed proteins mainly participate in cell growth and proliferation, death and survival, cell movement, and other biological functions
(A) Molecular and cellular functions involving differentially expressed global proteins; (B) Molecular and cellular functions involving differentially expressed phosphorylated proteins. p-value was calculated using right-tailed Fisher's exact test to assess association level. Functions were arranged according to -log(p-value). Threshold line indicating significant level was set at p = 0.05, or -log(p-value) = 1.3 means. The number on top of bar represents differentially expressed proteins involved in specific molecular pathways.
Figure 2
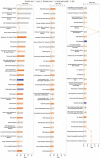
Figure 2. Signaling pathways associated with differentially expressed global proteins
Among signaling pathways associated with differentially expressed global proteins, eNOS signaling exhibited the highest correlation and z-score (2.236), indicating pathway activation. p-value was calculated using right-tailed Fisher's exact test to assess association level. p < 0.05 or -log(p-value) > 1.3 (the main axis or bar chart) signifies significant association. Threshold line indicating significant level was set at p = 0.05 or -log(p-value) = 1.3 means. Z-score is calculated according to expression level (up or down) of corresponding molecules in experiments and expected expression value (up or down) in pathways. Z-scores ≥ 2 or ≤ -2 indicate that signaling pathway was statistically and significantly activated (colored in yellow) or inhibited (colored in blue). The ratio denotes proportion of differentially expressed genes in total signaling pathway genes; such ratio is provided as reference for significance assessment.
Figure 3
Figure 3. Signaling pathways associated with differentially expressed phosphorylated proteins
Signaling by Rho GTPases exhibited the highest correlation among signaling pathways. p-value was calculated using right-tailed Fisher's exact test to assess association level. p < 0.05 or -log(p-value) > 1.3 (the main axis or bar chart) signifies significant association. Threshold line indicating significant level was set at p = 0.05, or -log(p-value) = 1.3 means. Z-score was calculated per expression level (up or down) of corresponding molecules in experiments and expected expression value (up or down) in pathways. Z-scores ≥ 2 or ≤ -2 indicate that signaling pathway was statistically and significantly activated (colored in yellow) or inhibited (colored in blue). The ratio denotes proportion of differently expressed genes in total signaling pathway genes. This ratio was provided as reference for significance assessment.
Figure 4
Figure 4. Ephrin-B2 promotes HUVECs proliferation
(A) Ephrin-B2 significantly promoted endothelial cell proliferation at concentration of 0.3 or 1 μg/mL. Cell viability was detected using CCK-8 assay [mean ± SEM, n = 6, **p < 0.01, ***p < 0.001, ****p < 0.0001, by analysis of variance (ANOVA) and Dunnett's multiple comparison test]. (B) Effect of ephrin-B2 on cell cycle of HUVECs. Cells were treated with 1 μg/mL ephrin-B2/Fc for 24 h and then analyzed using cytometry (n = 3, mean ± SEM, **p < 0.01, ***p < 0.001, ****p < 0.0001 vs. control using Student's t-test). (C and D) Western blot showed the effect of ephrin-B2 on c-Myc and NPM protein expression levels. Bands were quantified using Quantity One software (mean ± SEM; ns, *p < 0.05, **p < 0.01, ***p < 0.001, and ****p < 0.0001 vs. control using ANOVA and Dunnett's multiple comparison test).
Figure 5
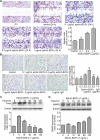
Figure 5. Ephrin-B2 promotes HUVEC migration
(A) Wound-healing assay. Consistently shaped wounds were created after 12 h of serum starvation. Cells were cultured for 24 h in serum-free medium containing different ephrin-B2/Fc concentrations or PBS, fixed by 4% paraformaldehyde, and stained using crystal violet. Images were captured under the microscope (100 times magnification), and in each well, six different scraped areas were randomly selected and analyzed. Cells treated by 0.3 or 1 μg/mL ephrin-B2 showed higher migration ratio (n = 3, mean ± SEM; ns, *p < 0.05, **p < 0.01 vs. control using ANOVA and Dunnett's multiple comparison test). (B) Transwell assay. A total of 35,000 cells were cultured on the upper chamber using serum-free medium containing different ephrin-B2/Fc concentrations (0, 0.1, 0.3, 1, and 3 μg/mL), which were poured onto the bottom chamber as migration stimulator. Six hours later, migrated cells were fixed, stained, photographed, and then counted according to normal methods. Cells dose-dependently migrated under low concentrations (n = 3, mean ± SEM; ns, *p < 0.05 and ***p < 0.001 vs. control using ANOVA and Dunnett's multiple comparison test). (C and D) Western blot showed the effects of ephrin-B2 on Twist and MMP9 protein expression levels. Bands were quantified using Quantity One software (mean ± SEM; ns, *p < 0.05 and ***p < 0.001 vs. control using ANOVA and Dunnett's multiple comparison test).
Figure 6
Figure 6. Ephrin-B2 inhibits HUVEC apoptosis
(A) Cell apoptosis assay by CCK-8. Cell apoptosis was induced 4 h after incubation with different concentrations of H2O2. Cell survival ratios were then tested at OD450 nm. Relatively significant level of apoptosis was observed at concentration of 0.3 mmol/L (n = 3, mean ± SEM; ns, *p < 0.05, ***p < 0.001 vs. control using ANOVA and Dunnett's multiple comparison test). (B) Different concentrations of ephrin-B2/Fc (0.1, 0.3, and 1 μg/mL) contribute to protecting HUVECs from apoptosis, which is induced by H2O2 (0.3 mmol/L). Cells were cultured in serum-free medium containing different concentrations of ephrin-B2/Fc or PBS for 2 h then incubated with H2O2 for 4 h. Cell survival ratios were also tested on OD450 nm. Cells treated by 1 μg/mL ephrin-B2 showed higher survival ratio (n = 3, mean ± SEM; ns, **p < 0.01 vs. control using ANOVA and Dunnett's multiple comparison test). (CD) Western blot showed the effects of ephrin-B2 on Bcl-2 and cleaved caspase 3 protein expression levels. Bands were quantified using Quantity One software (mean ± SEM; ns, **p < 0.01, ***p < 0.001 and ****p < 0.0001vs. control using ANOVA and Dunnett's multiple comparison test).
Figure 7
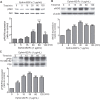
Figure 7. Effects of ephrin-B2 on signaling pathways in HUVECs
HUVECs were treated with 1 μg/mL ephrin-B2 for 5, 15, and 30 min and for 1 and 2 h. Expression levels of pAkt (A), eNOS (B), and pP38 (C) were detected by Western blot. Intensity of each band was quantified by Quantity One software (mean ± SEM; ns, **p < 0. 01 and ***p < 0.001, ****p < 0.0001, vs. control using ANOVA and Dunnett's multiple comparison test). β-actin was used as internal control.

Similar articles

Cited by

References

    1. Folkman J. Tumor angiogenesis: therapeutic implications. N Engl J Med. 1971;285:1182–6. doi: 10.1056/NEJM197111182852108. - DOI - PubMed
    1. Folkman J. What is the evidence that tumors are angiogenesis dependent? J Natl Cancer Inst. 1990;82:4–6. - PubMed
    1. Paez-Ribes M, Allen E, Hudock J, Takeda T, Okuyama H, Vinals F, Inoue M, Bergers G, Hanahan D, Casanovas O. Antiangiogenic therapy elicits malignant progression of tumors to increased local invasion and distant metastasis. Cancer Cell. 2009;15:220–31. doi: 10.1016/j.ccr.2009.01.027. - DOI - PMC - PubMed
    1. Wang J, Li G, Wang Y, Tang S, Sun X, Feng X, Li Y, Bao G, Li P, Mao X, Wang M, Liu P. Suppression of tumor angiogenesis by metformin treatment via a mechanism linked to targeting of HER2/HIF-1alpha/VEGF secretion axis. Oncotarget. 2015;6:44579–92. doi: 10.18632/oncotarget.6373. - DOI - PMC - PubMed
    1. Ebos JM, Kerbel RS. Antiangiogenic therapy: impact on invasion, disease progression, and metastasis. Nat Rev Clin Oncol. 2011;8:210–21. doi: 10.1038/nrclinonc.2011.21. - DOI - PMC - PubMed

MeSH terms

LinkOut - more resources