. 2017 May 18;545(7654):317-322.
doi: 10.1038/nature22070. Epub 2017 May 10.

Selectivity determinants of GPCR-G-protein binding

Affiliations

Selectivity determinants of GPCR-G-protein binding

Tilman Flock et al. Nature. .

Abstract

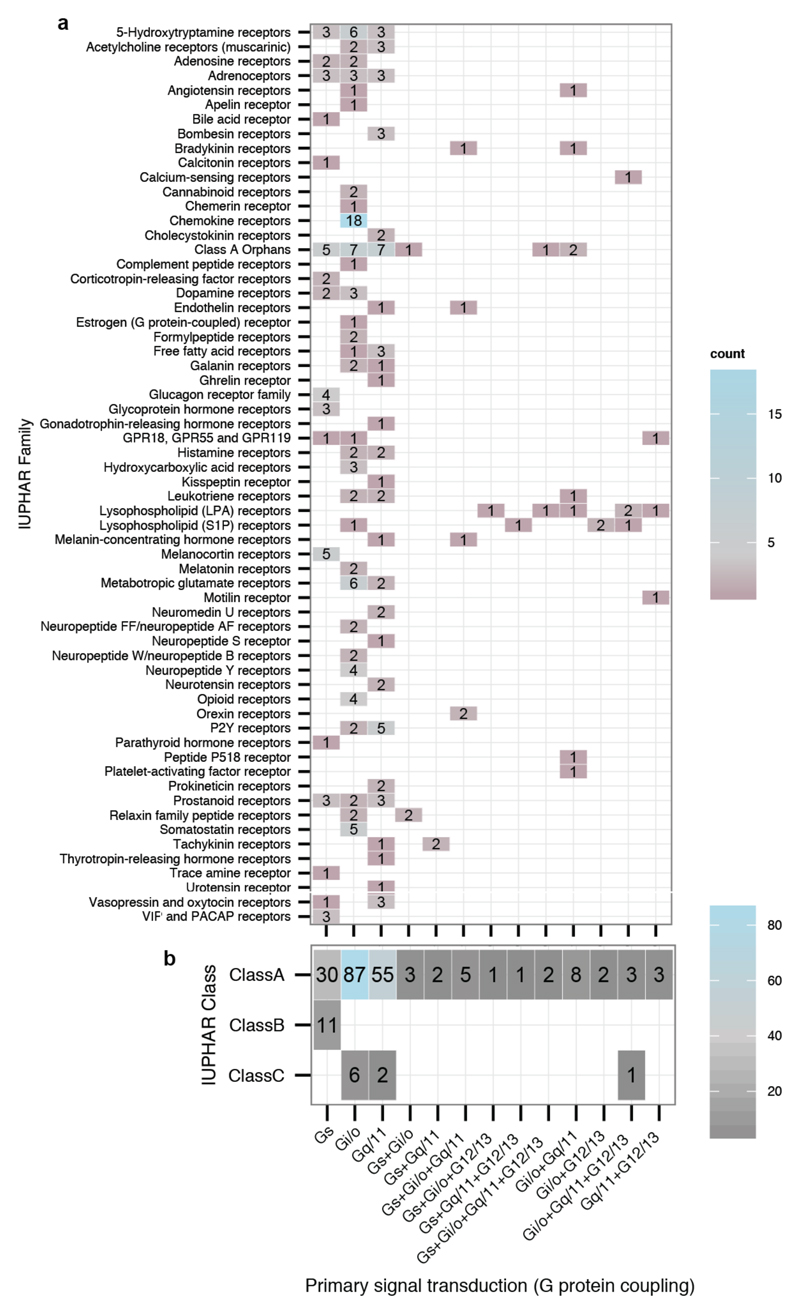
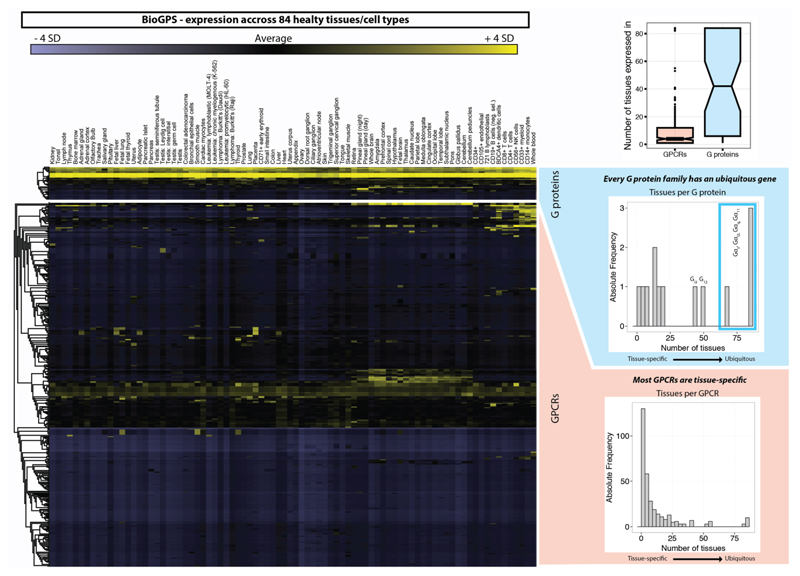
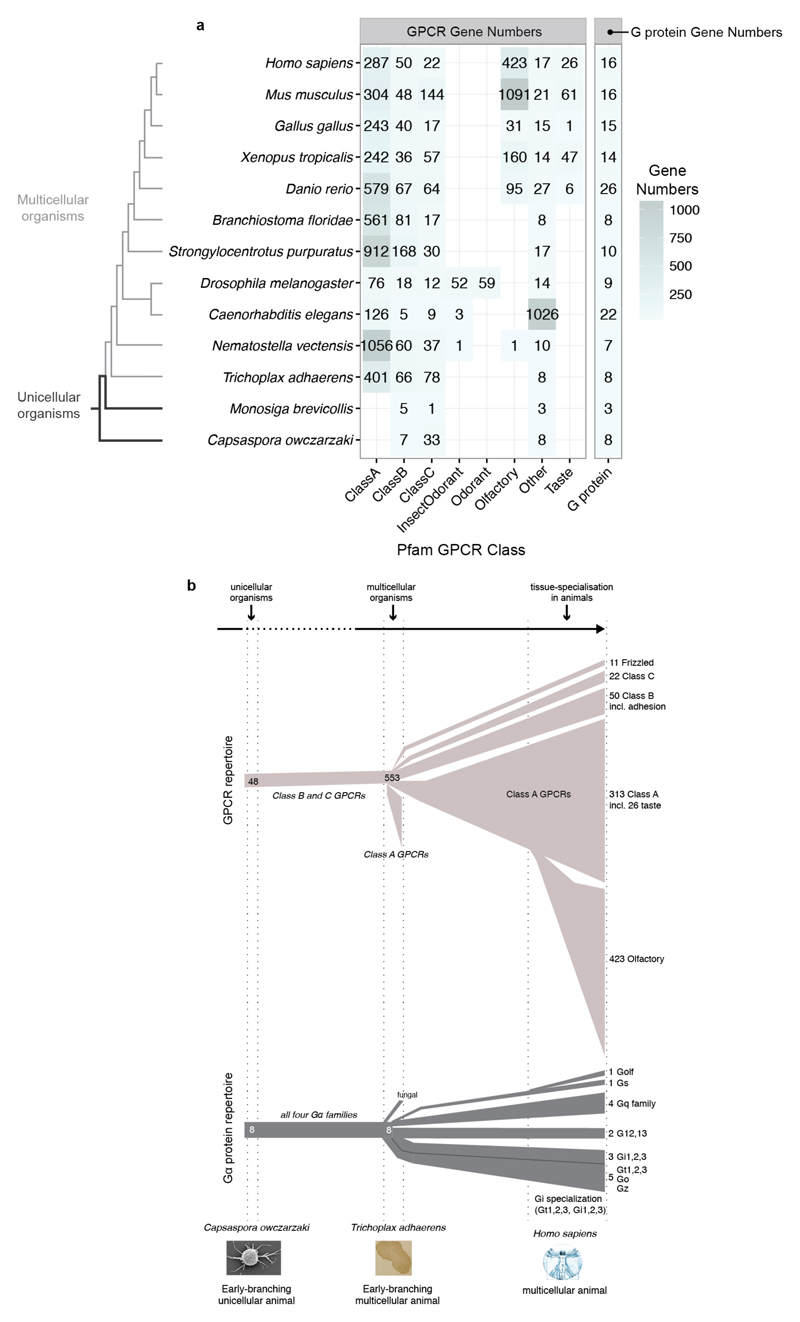
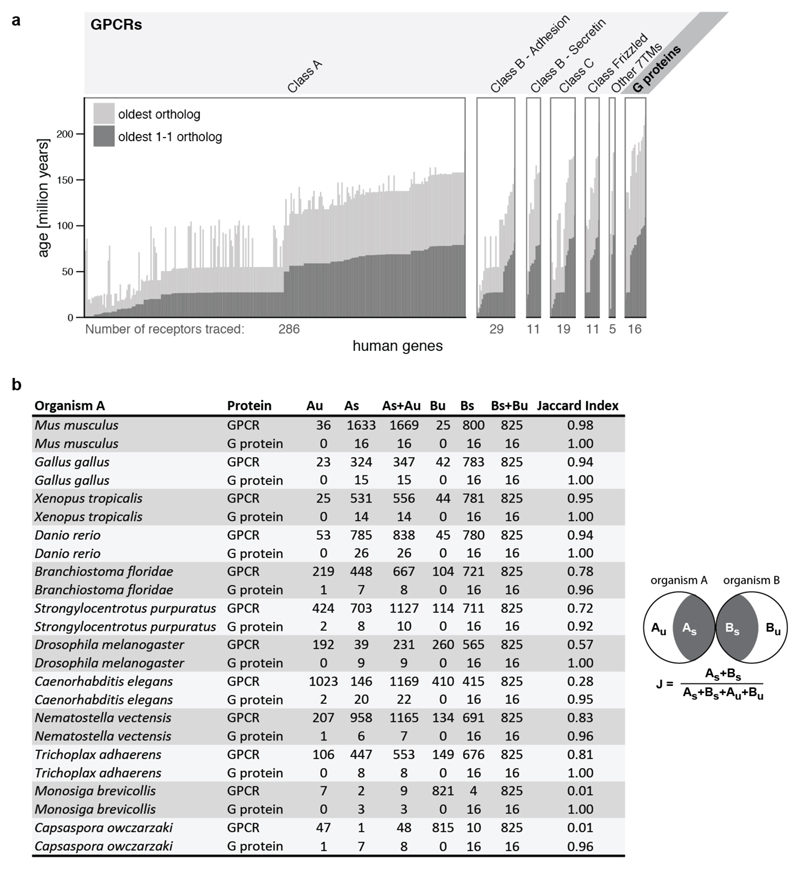
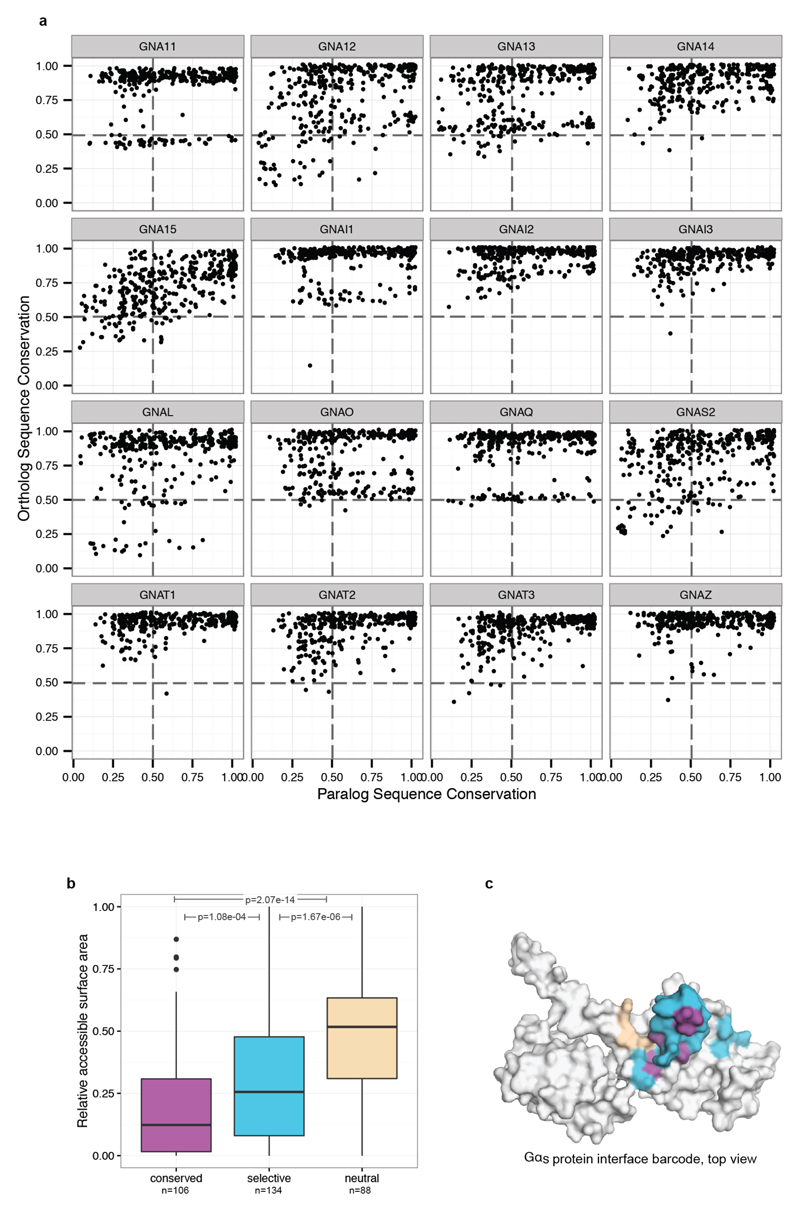
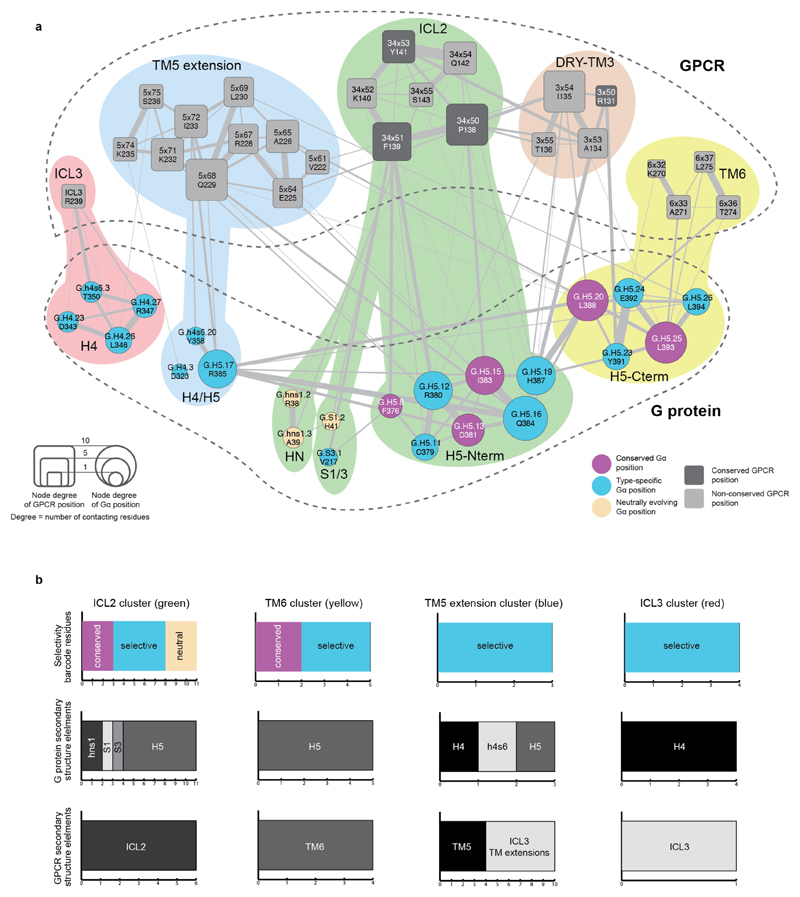
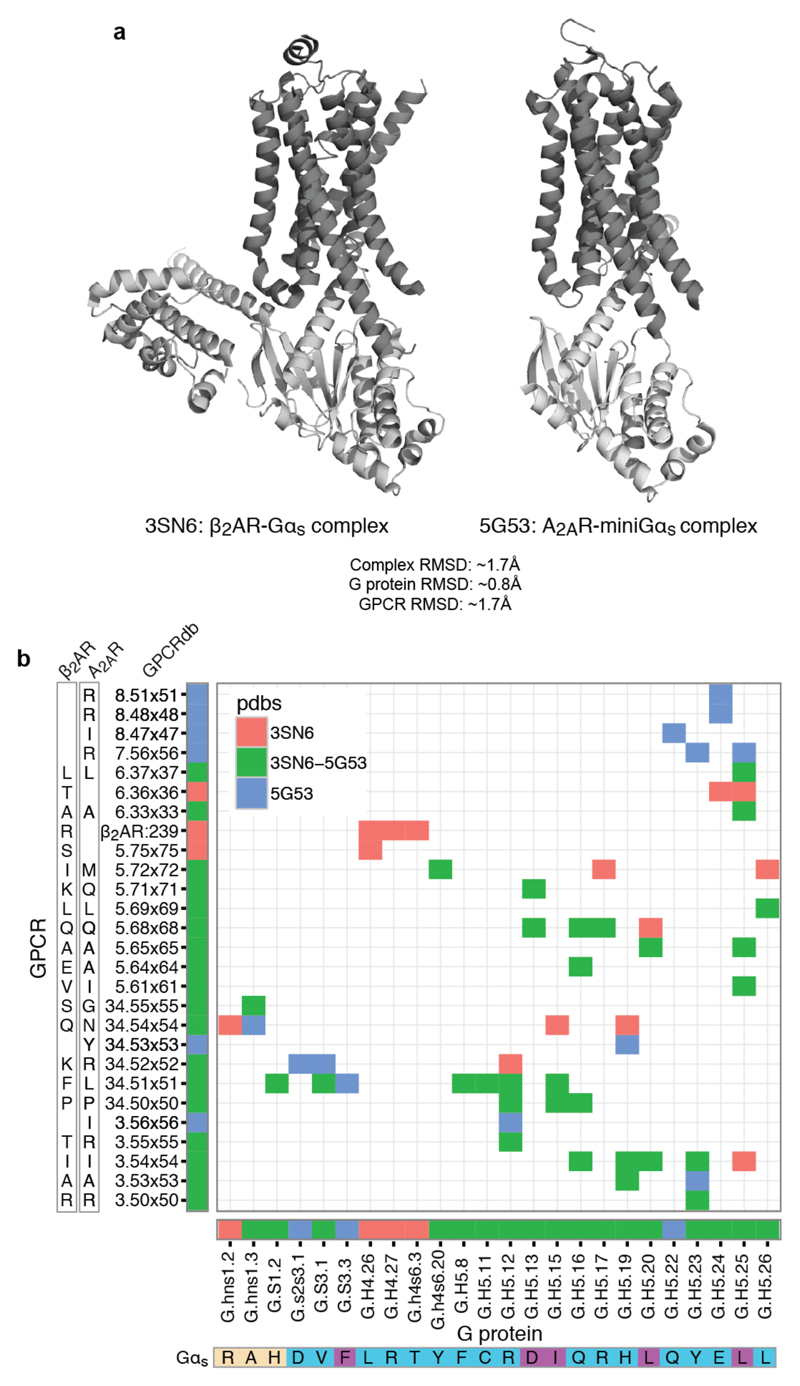
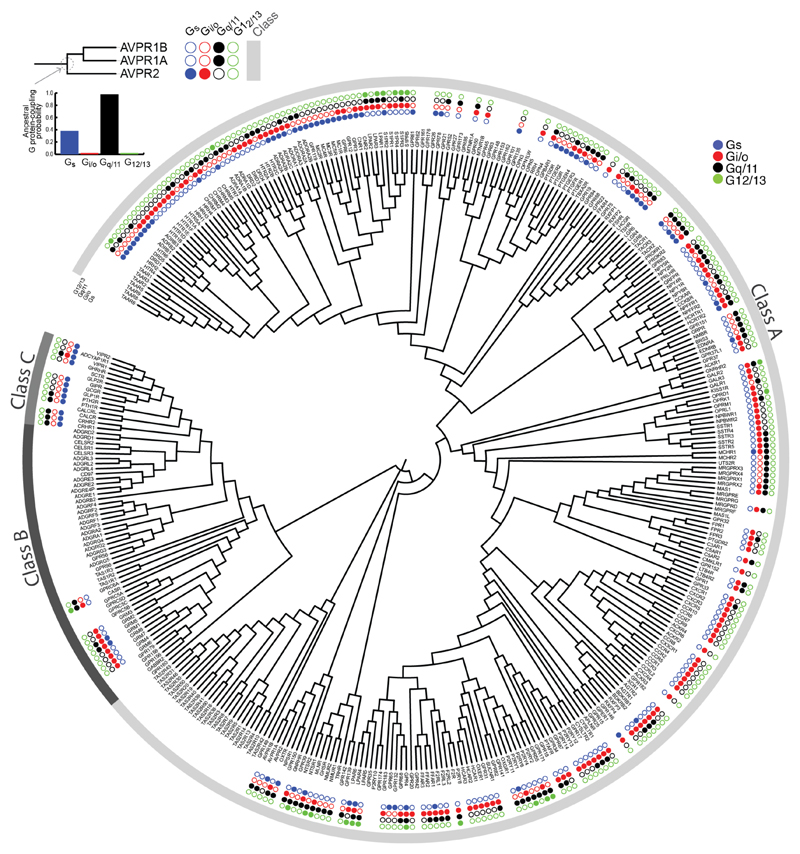
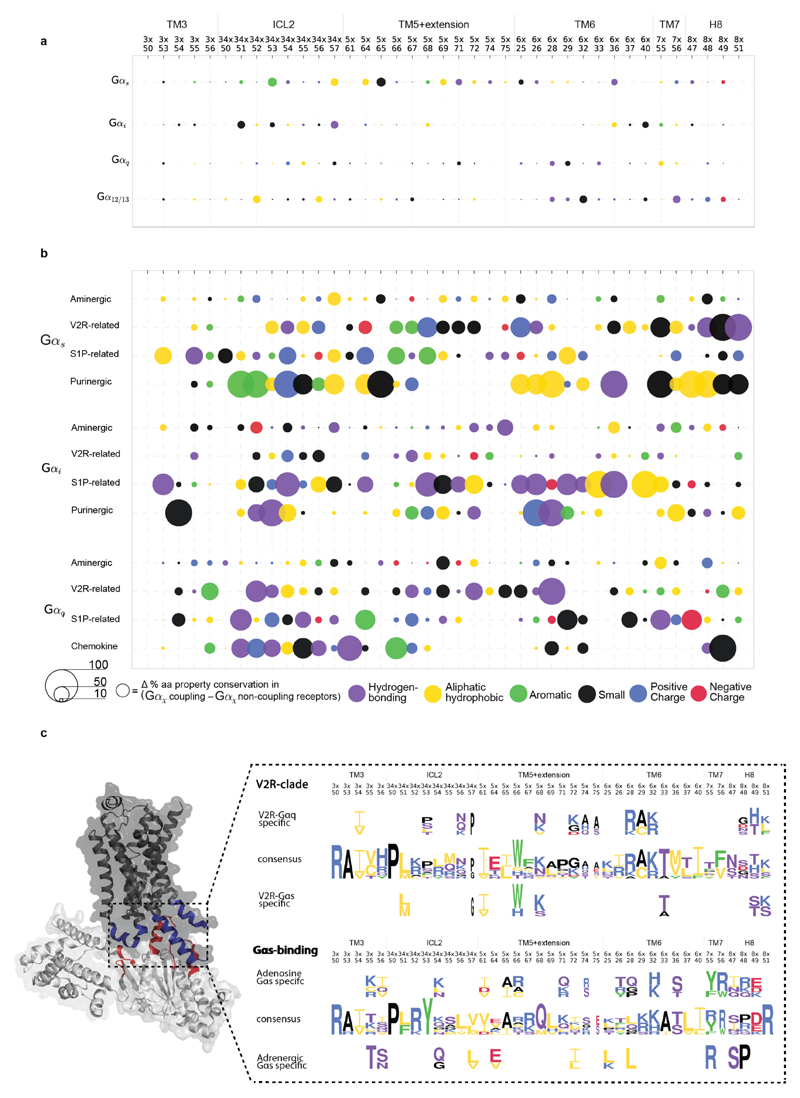
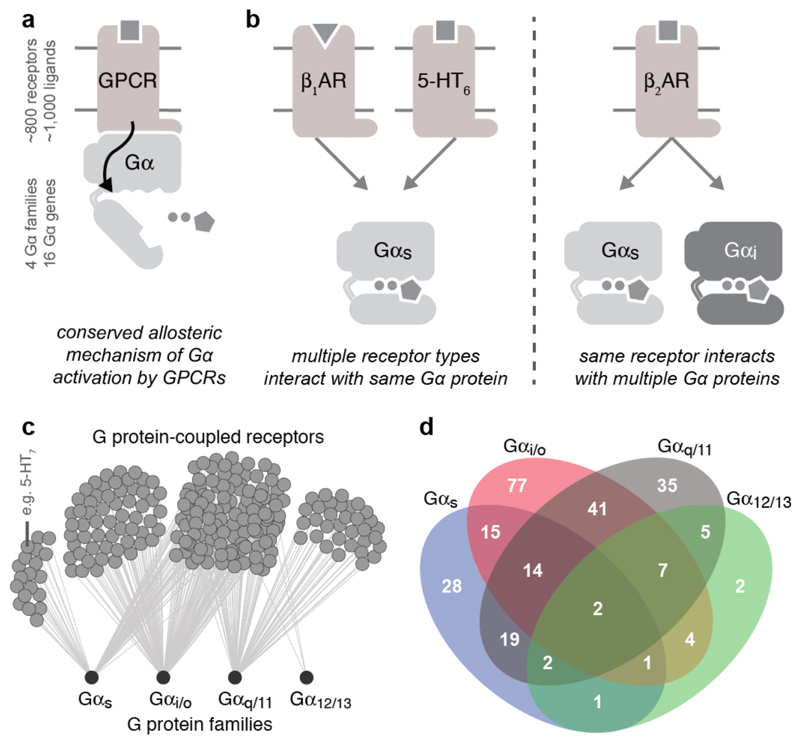
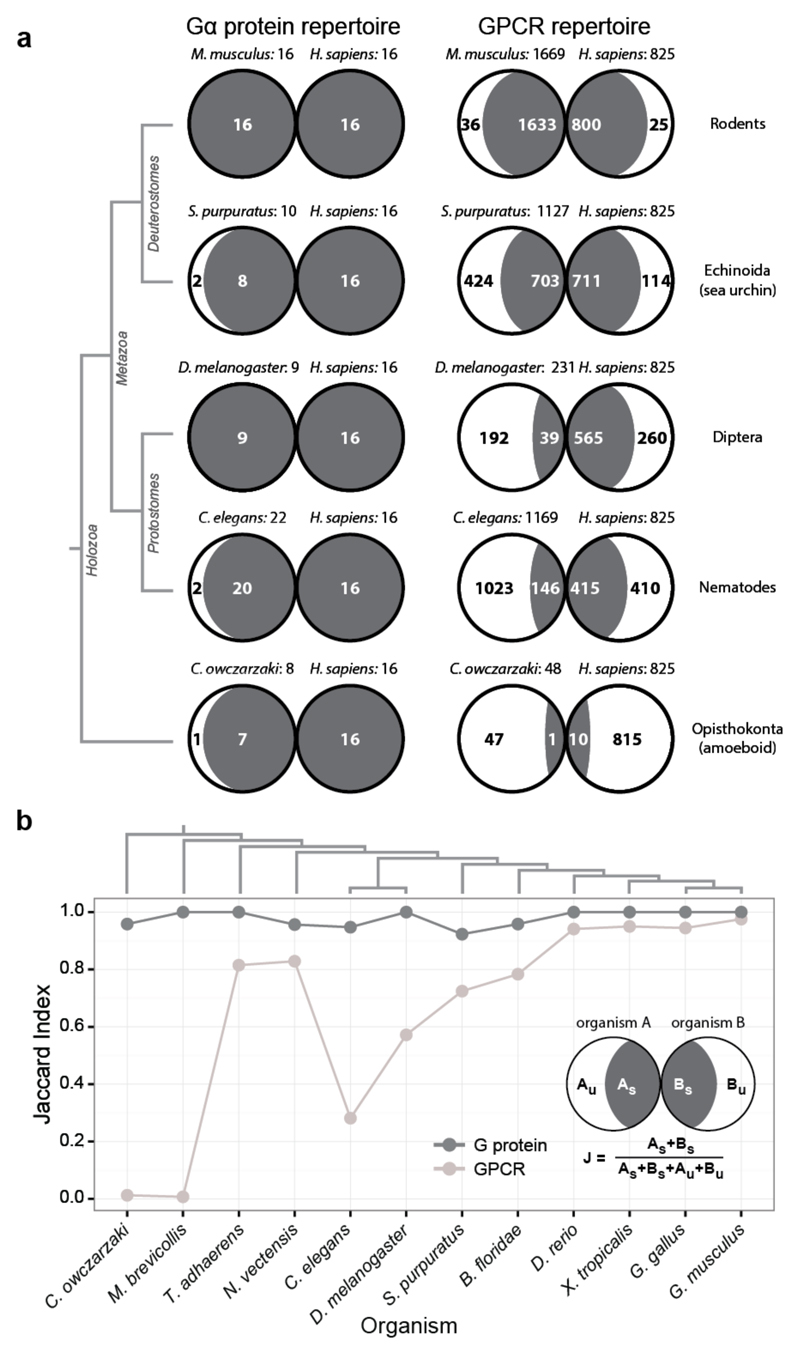
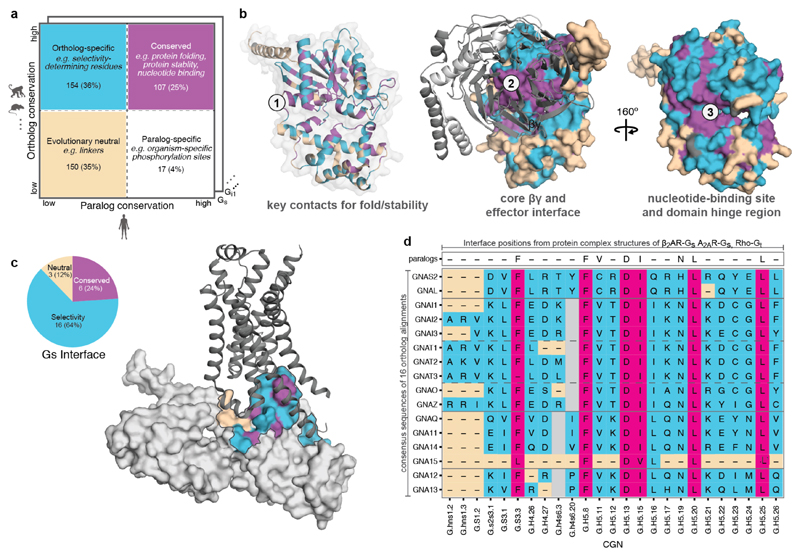
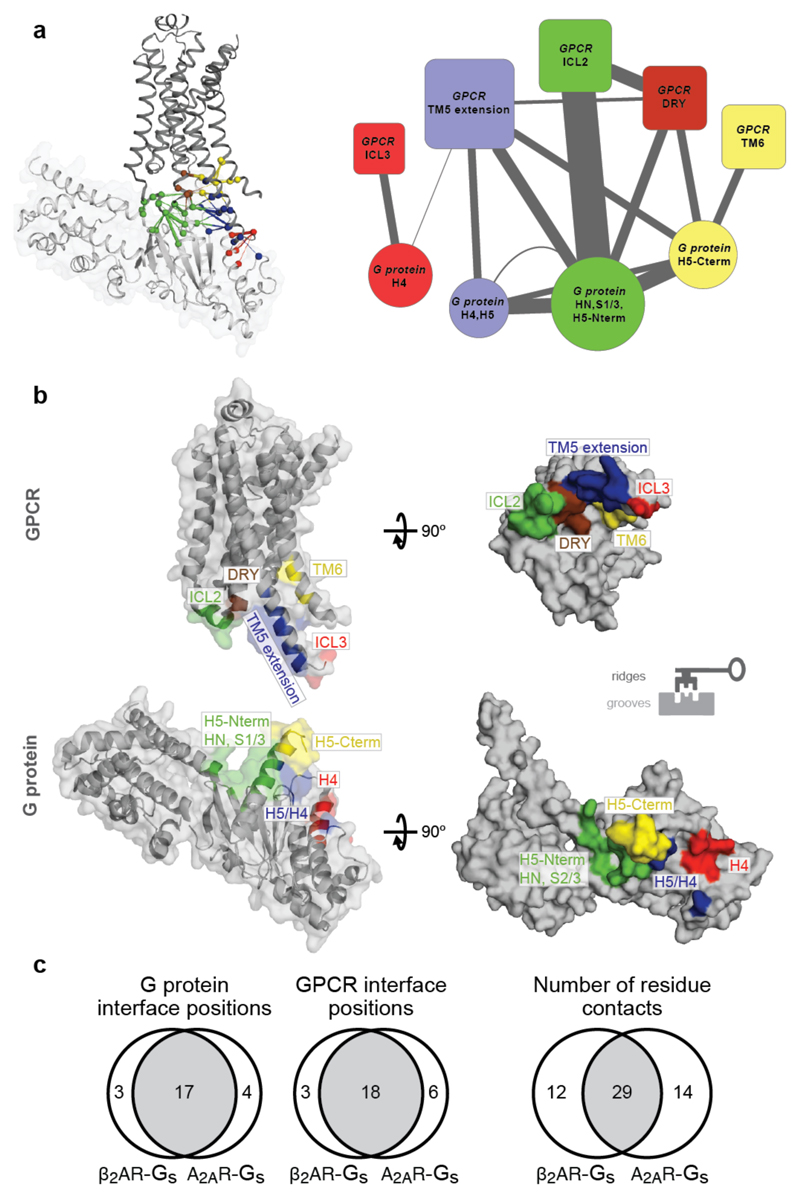
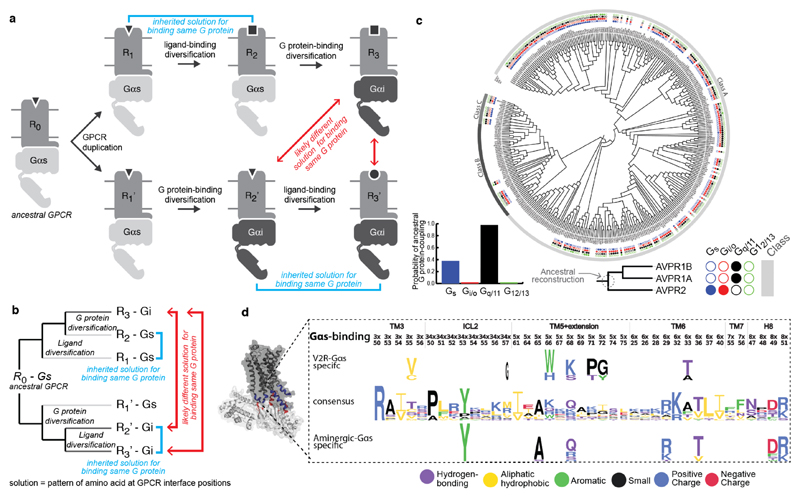
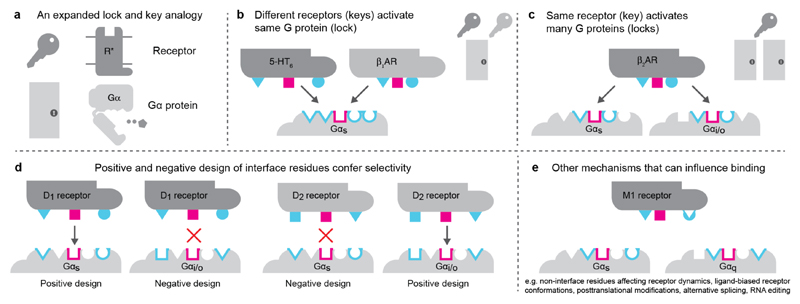
The selective coupling of G-protein-coupled receptors (GPCRs) to specific G proteins is critical to trigger the appropriate physiological response. However, the determinants of selective binding have remained elusive. Here we reveal the existence of a selectivity barcode (that is, patterns of amino acids) on each of the 16 human G proteins that is recognized by distinct regions on the approximately 800 human receptors. Although universally conserved positions in the barcode allow the receptors to bind and activate G proteins in a similar manner, different receptors recognize the unique positions of the G-protein barcode through distinct residues, like multiple keys (receptors) opening the same lock (G protein) using non-identical cuts. Considering the evolutionary history of GPCRs allows the identification of these selectivity-determining residues. These findings lay the foundation for understanding the molecular basis of coupling selectivity within individual receptors and G proteins.


Conflict of interest statement

The authors declare no competing financial interests.

Figures

Extended Data Figure 1
Extended Data Figure 1. G protein-coupling properties of human GPCRs.
a, Number of GPCRs with distinct primary signal transduction (G protein-coupling) for each GPCR family as annotated in the IUPHAR/BPS Guide to Pharmacology database (GtoPdb). Only ‘primary transduction’, as defined by the database, is shown here. Note that Fig. 1c and Fig. 1d show both primary and secondary coupling. b, Number of GPCRs with distinct primary signal transduction properties grouped by GPCR class.
Extended Data Figure 2
Extended Data Figure 2. Gene expression profile of human GPCRs and G proteins.
The gene expression level (transcriptome) of human G proteins (top) and GPCRs (bottom) across 84 healthy tissues or cell types is shown. The right insets show histograms of the number of G proteins (blue) or GPCRs (red) that are expressed in one or multiple tissues. This highlights that at least one member of each G protein subfamily (Gs, Gi/o, Gq/11, G12/13) is ubiquitously expressed in all tissues. Other subtypes such as the Gt proteins are more tissue-specific. GPCRs on the other hand appear much more tissue-specific and are only expressed in single or few tissues, except for some ubiquitously expressed GPCRs such as chemokine receptors. Normalized expression data was derived from BioGPS (http://biogps.org).
Extended Data Figure 3
Extended Data Figure 3. Asymmetric evolution of GPCR and Gα protein repertoires.
a, The GPCR and Gα protein repertoires (unique genes) across 13 representative organisms determined using Pfam domain annotations (see Methods and Supplementary Table). The number of Class A receptors slightly differs from the IUPHAR/BPS Guide to Pharmacology database as Class A taste receptors are classified as a separate Pfam family. b, Illustration of the lineage-specific expansion and differentiation of the GPCR and G protein repertoires during evolution. The numbers of G proteins and GPCRs are shown for Capsaspora owczarzaki (an early-branching unicellular sister group of metazoans), Trichoplax adhaerens (one of the oldest known multicellular organism), and humans.
Extended Data Figure 4
Extended Data Figure 4. ‘Phylogenetic age’ of human GPCRs and Gα proteins.
a, Estimation of the ‘phylogenetic age’ of human GPCRs and G proteins by identifying the most distant one-to-one orthologs (dark grey) or any ortholog (light grey) from 215 organisms in the OMA (Orthologous MAtrix) database. The ‘phylogenetic age’ was determined by the branching times of human and the oldest organisms that share either a 1-1 ortholog or any ortholog (one-many or many-one or many-many) with the human gene (Methods). The classification of GPCRs follows the IUPHAR receptor classification. b, Complete table of the GPCR and G protein repertoire and the phylogenetic ‘overlap’ of the protein repertoires. Jaccard Similarity Index (Methods) for the GPCR and G protein repertoires in the 12 completely sequenced genomes from the different eukaryotic lineages. The subscript U and S for organisms A and B refer to the number of unique and shared genes, respectively.
Extended Data Figure 5
Extended Data Figure 5. Conservation of residue positions among orthologs and paralogs in Gα proteins.
a, Jitterplots showing the degree of sequence conservation (sequence identity) of each CGN (common G protein numbering) position in Gα proteins. The plots show the degree of conservation in each one-to-one ortholog alignment for each Gα subtype versus the conservation of the human paralog alignment (alignments are provided as Supplementary Data and can be visualised to identify which amino acids were fixed at what time points during evolution). b, The boxplot shows the distribution of the relative accessible surface area of residue positions in each group for Gs (PDB: 1gp2). c, The conserved positions at the interface of the β2AR-Gs (PDB: 3sn6) form central clusters (magenta) and tend to be surrounded by selectivity determining positions (blue). The average distance among positions are: conserved-to-conserved: 9.84 Å; conserved-to-specific: 11.23 Å; specific-to-specific: 12.20 Å.
Extended Data Figure 6
Extended Data Figure 6. Integration of sequence and structure-derived information to understand how GPCRs read the G protein selectivity barcode.
G protein selectivity barcode (Fig. 3d) mapped onto the GPCR-G protein interface clusters obtained using the β2AR-Gs complex structure (Fig. 4; Methods) highlights which regions of the GPCR contact selectivity-determining residues on the G protein. Nodes represent GPCR (rounded squares) and G protein (circles) positions. The edges and their width represent the number of atomic contacts between residues. The size of the nodes is relative to their node degree (number of contacts to other nodes; which is a measure of how central a node is). Residues within the cluster are grouped and coloured differently in the background (red, blue, green, brown and yellow). b, Statistics highlighting the results from integrating the G protein barcode analysis (sequence-based analysis) with the structural clustering analysis (structure-based analysis). The number of residues in Gαs with a particular sequence conservation property in each cluster (i.e. universally conserved, neutrally evolving, selectivity determining position) is shown. The number of residues that map to the different GPCR and G protein secondary structure elements are shown for both GPCR and G protein based on the β2AR-Gs complex structure (PDB: 3sn6).
Extended Data Figure 7
Extended Data Figure 7. Comparison of the interface contacts and the contacting residues between β2AR-Gs and A2AR-mini Gs.
a, Comparison of the overall structure of both complex structures shows that the two receptors bind the G protein in a similar binding mode. RMSD values are provided in the figure. b, Detailed comparison of the residue contacts between equivalent positions of β2AR and A2AR receptor with equivalent positions of Gs and the mini-Gs construct used to obtain the complex structures. The exact residue and the GPCRdb numbering scheme for the receptor and the CGN system for the G protein are shown on the axes. Contacts (coloured cells in the matrix) and positions (horizontal and vertical coloured bars next to the axes) that are common or unique to the β2AR or A2AR Gs complex are shown in different colours. The G protein selectivity barcode as in Fig. 3 is shown in the bottom of the matrix. This analysis suggests that while the same positions of the G protein and GPCRs may be involved in the recognition, distinct residues (both positions and the amino acid residue) on the two different receptors contact them. In other words, the same selectivity barcode presented by Gαs is read differently by receptors belonging to different sub-types.
Extended Data Figure 8
Extended Data Figure 8. Phylogenetic tree of GPCRs and mapping of ancestral reconstruction of coupling selectivity.
A phylogenetic tree of human Class A, B and C GPCRs was derived from a full-length GPCR multiple sequence alignment that was created in-house (Methods). Concentric circles illustrate the G protein-coupling selectivity of each GPCR: the four dots depict both primary and secondary G protein coupling (from inside to outside: Gs, Gi/o, Gq/11, G12/13). The inset on the top left shows a magnification of one clade in the phylogenetic tree. G protein coupling of each ancestral node was reconstructed by considering only the primary coupling of the receptors (Methods).
Extended Data Figure 9
Extended Data Figure 9. Selectivity patterns at the GPCR-G protein interface.
a, Using the phylogenetic history to define receptor clades with a common ancestor uncovers distinct conserved properties of amino acids at specific interface positions on the receptor. The figure shows molecular property signatures (ability of residues at a given G protein interface position to mediate a distinct type of molecular interaction) on the intracellular interface of GPCRs. Each circle represents a property (coloured) and its distinctiveness (sizing) within the receptors that couple to the given G protein subtype (vs. those that do not). There is no conserved sequence pattern in all the receptors that couple to the same Gα protein. b, Receptors that form a phylogenetic clade exhibit distinct molecular property signatures (Methods). The legend (bottom) shows the colour scheme used for amino acids with different properties. c, Sequence pattern determined by Spial (Methods) of the interface positions (left). (top) V2R-clade and βARs (which belong to different groups) both couple to Gαs. However, the common ancestor of the V2R related receptor coupled to Gαq (suggesting alteration of selectivity) whereas the common ancestor of aminergic receptors coupled to Gαs (suggesting inheritance of selectivity). An analysis of the equivalent interface positions on the receptor that contact the Gα protein shows that V2R independently accumulated a different set of mutations in the same region to selectively couple to Gαs and hence arrived at a different sequence pattern to read the selectivity barcode on Gαs. (bottom) Adenosine-clade and βARs (which belong to different groups) both couple to Gαs and have complex evolutionary histories (Extended Data Fig. 8). An analysis of the equivalent interface positions on the receptor that contact the Gα protein shows that A2AR independently accumulated a different set of mutations in the same region to couple to Gαs and hence arrived at a different sequence pattern to read the same selectivity barcode on Gαs (see also Extended Data Fig. 7b). Mutagenesis of the A2b receptor has shown that the positions 3x50, 3x54, 5x69, 6x36 and 6x37 affect the coupling of Gαs, Gαq, Gα12, Gα13, Gα14, Gαi1, Gαi2 and Gα152 (see also Supplementary Table 1).
Extended Data Figure 10
Extended Data Figure 10. Webserver for analysis of GPCR-G protein selectivity analysis considering evolutionary factors.
Summary of the features in GPCRdb, describing the receptor-G protein binding interface. These features allow users to investigate various aspects of receptor-G protein binding selectivity and G protein specific information for all the human GPCRs and G proteins.
Figure 1
Figure 1. Selectivity in GPCR-G protein signalling.
a, GPCRs activate G proteins through a conserved mechanism. b, The same G protein can be activated by different receptors, and the same receptor can couple to different G proteins. c, Network representation of the currently available G protein coupling data. d, Numbers of receptors coupling to different (sets of) G proteins.
Figure 2
Figure 2. Asymmetric evolution of the GPCR and Gα protein repertoire.
a, GPCR and G protein repertoires of human and five organisms from different lineages (see Extended Data Fig. 4b). Fraction of proteins in each organism that are related (dark grey) or unique (white) is shown. b, Evolutionary dynamics (Jaccard similarity index) of GPCRs (light grey) and G proteins (dark grey) between human and 12 organisms. The subscript U and S for organisms A and B refer to the number of unique and shared genes, respectively. The higher fraction of human receptors shared with Trichoplax adhaerens and Nematostella vectensis highlights that these organisms shared a complex gene repertoire with human, which was lost in some other lineages (e.g. insects).
Figure 3
Figure 3. Subtype-specific residues and Gα selectivity barcode.
a, Comparing the G protein paralogs alignment with the respective orthologs alignment can disentangle positions involved in shared function (magenta), sub-type specific function (cyan), organism-specific function (white) and under relaxed functional constraint (beige). b, Mapping the data onto the GDP bound conformation of a Gα protein (PDB: 1gp2). c, Mapping the data onto the Gαs –β2AR interface (PDB: 3sn6; βγ). The numbers of residues in each group (β2AR-Gαs interface positions) are shown in the pie chart. d, For the inferred G protein interface positions (CGN system21), the consensus sequence and the nature of the position (conserved, neutral, selective) are shown for each G protein (Gα selectivity barcode).
Figure 4
Figure 4. Residue contacts at the GPCR–G protein interface.
a, (left) Residue contact network of all residues at the β2AR-Gαs interface (PDB: 3sn6). Residues in the different clusters (Methods) are shown in red, blue, green, brown and yellow. (right) Meta-network highlighting the connectivity between the clusters. Node size reflects number of amino acids in the cluster, and edge weight denotes number of residue contacts between clusters. b, Mapping the structure-derived interface clusters shows complementary “ridges” and “grooves” at the receptor-G protein interface. c, Comparison of residues and residue contacts shared between the β2AR-Gs and A2A-Gsmini structures (Extended Data Fig. 7).
Figure 5
Figure 5. Evolutionary history of GPCRs and selectivity determining positions on the receptor.
a, Gene duplication model for the evolution of ligand and G protein selectivity of GPCRs. b, Phylogenetic tree representation of the events in the gene duplication model. c, A phylogenetic tree of human Class A, B and C GPCRs showing the G protein-coupling selectivity of each GPCR (Extended Data Fig. 8). The four dots (filled or empty) depict both primary and secondary G protein coupling. G protein coupling of each ancestral node was reconstructed by considering the primary coupling of the receptors (V2R clade receptors shown as example). d, Sequence pattern (Methods) of the aminergic and V2R-clade interface positions suggests independent accumulation of mutations to couple to Gαs. Various single point mutations in the V2 receptor (no structure available) support that several of these positions are crucial for selectivity (Supplementary Table 1).
Figure 6
Figure 6. Lock and key analogy for GPCR-G protein selectivity.
a, Receptors are analogous to keys and G proteins are analogous to locks on doors. b, Members of different GPCR families can find distinct solutions to bind the same G protein. The conserved core of the interface (magenta) allows for a common binding mode and activation mechanism, while specificity/selectivity is achieved through interaction with some parts of the family-specific G protein barcode residues (cyan). c, Some GPCRs can be promiscuous (master keys) and interact with multiple G proteins (i.e. open multiple locks). d, G protein interface is more static (fixed lock) whereas the GPCR interfaces are more dynamic during evolution. Positive and negative design of the receptor interface positions through mutations may give rise to specificity (i.e. adjusting the cuts of keys so that they only open certain locks but not others). e, Other factors can modify the GPCR interface and binding selectivity.

Comment in

  • Coding GPCR-G protein specificity.
    Furness SG, Sexton PM. Furness SG, et al. Cell Res. 2017 Oct;27(10):1193-1194. doi: 10.1038/cr.2017.92. Epub 2017 Jul 11. Cell Res. 2017. PMID: 28695889 Free PMC article.

References

    1. Bjarnadottir TK, et al. Comprehensive repertoire and phylogenetic analysis of the G protein-coupled receptors in human and mouse. Genomics. 2006;88:263–273. - PubMed
    1. Anantharaman V, Abhiman S, de Souza RF, Aravind L. Comparative genomics uncovers novel structural and functional features of the heterotrimeric GTPase signaling system. Gene. 2011;475:63–78. - PMC - PubMed
    1. Southan C, et al. The IUPHAR/BPS Guide to PHARMACOLOGY in 2016: towards curated quantitative interactions between 1300 protein targets and 6000 ligands. Nucleic Acids Res. 2016;44:D1054–1068. - PMC - PubMed
    1. Isberg V, et al. Generic GPCR residue numbers - aligning topology maps while minding the gaps. Trends Pharmacol Sci. 2015;36:22–31. - PMC - PubMed
    1. Neves SR, Ram PT, Iyengar R. G protein pathways. Science. 2002;296:1636–1639. - PubMed

Publication types

Substances