. 2017 May 18;545(7654):360-364.
doi: 10.1038/nature22323. Epub 2017 May 10.

Intratumoural heterogeneity generated by Notch signalling promotes small-cell lung cancer

Affiliations

Intratumoural heterogeneity generated by Notch signalling promotes small-cell lung cancer

Jing Shan Lim et al. Nature. .

Abstract

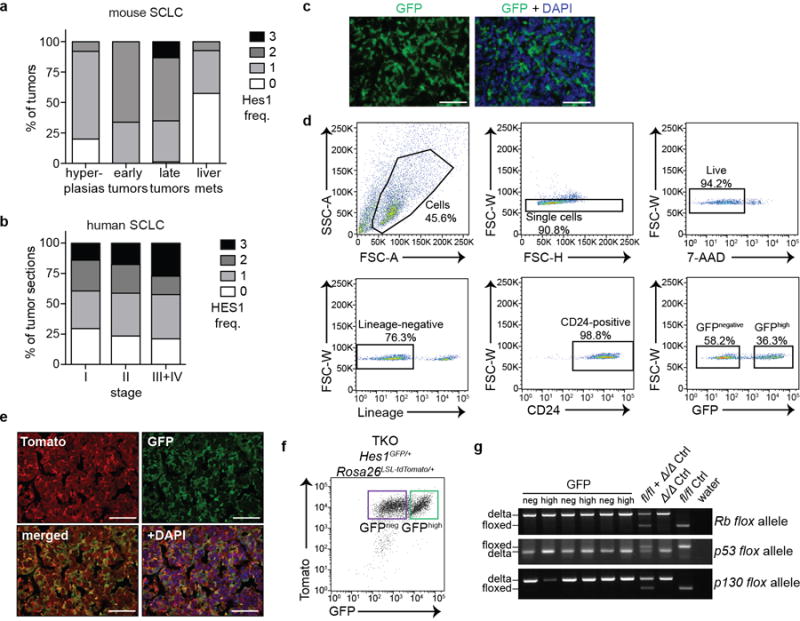
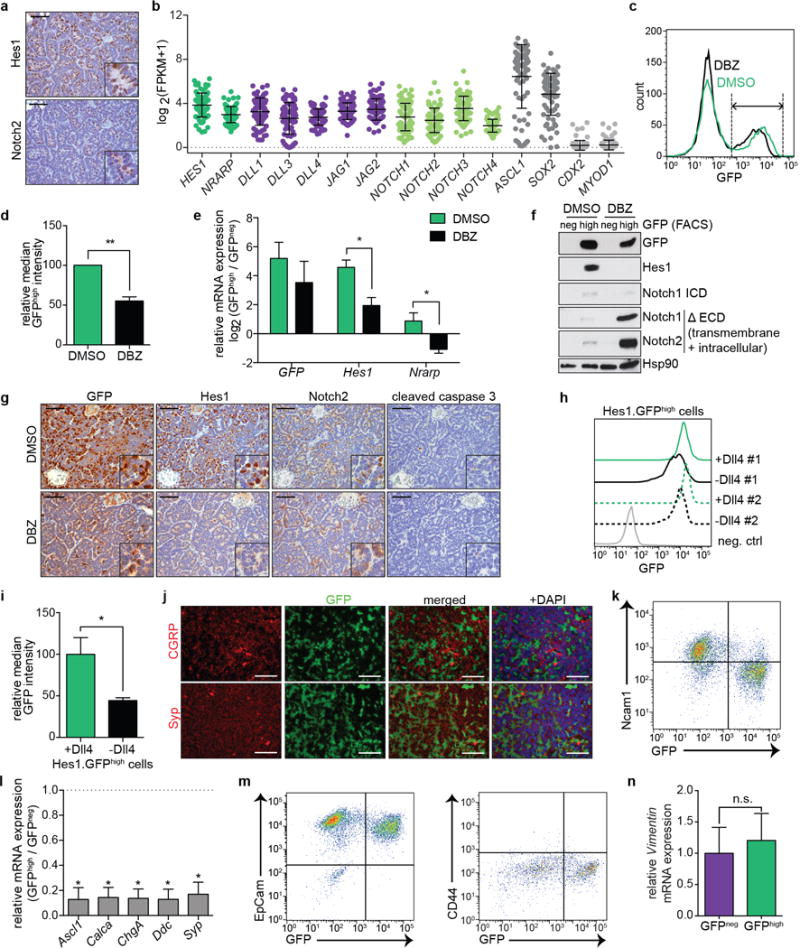
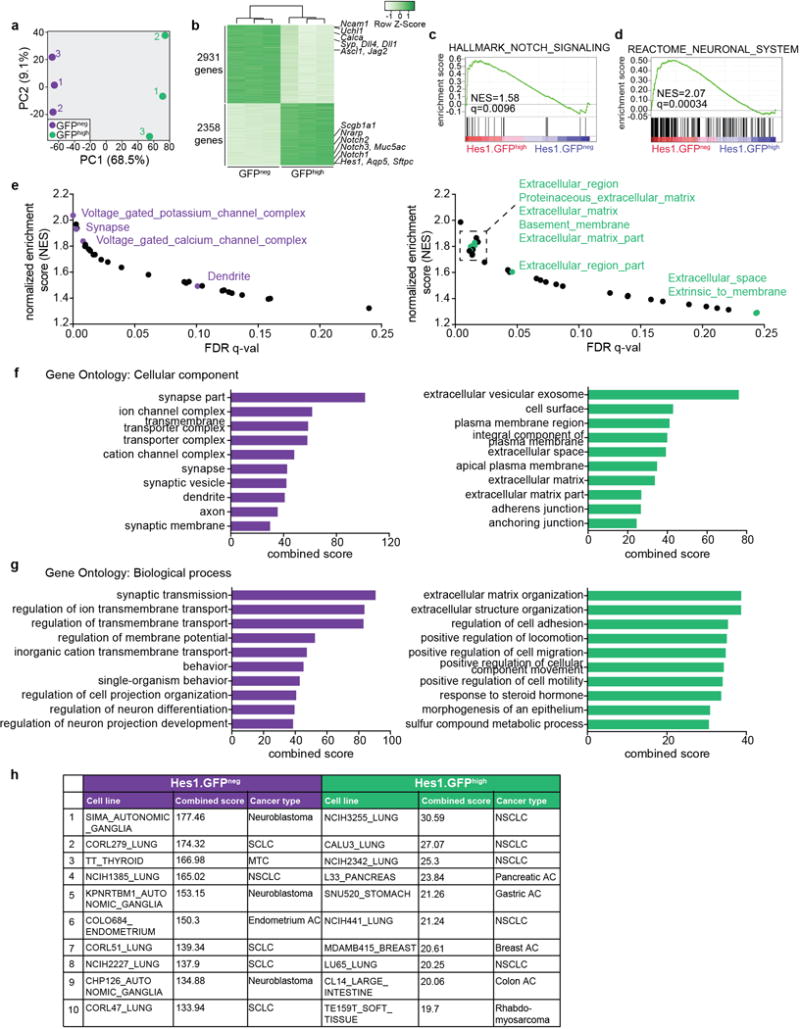
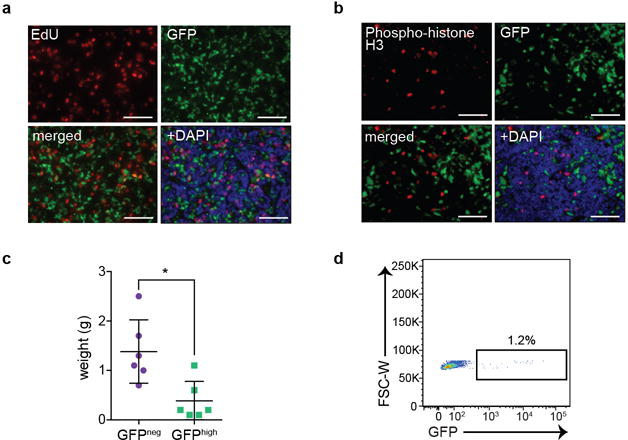
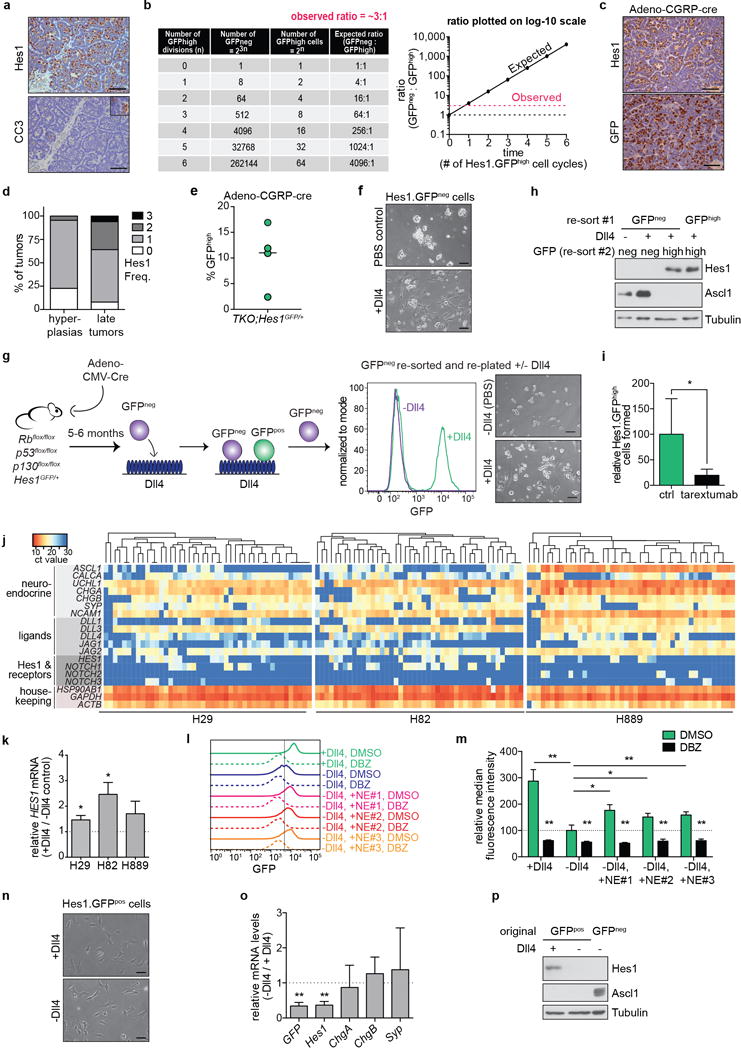
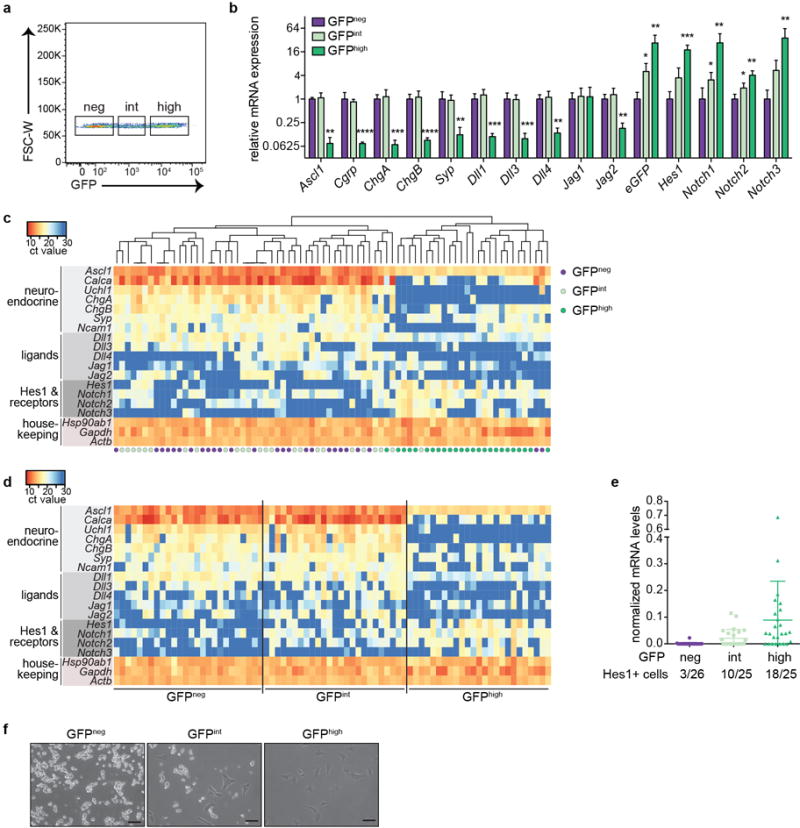
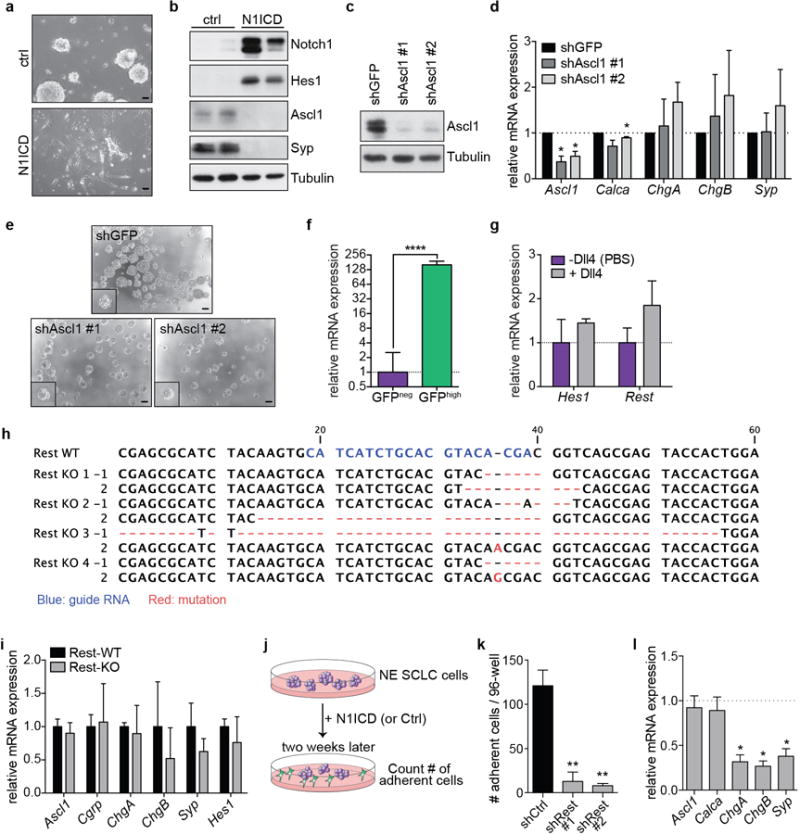
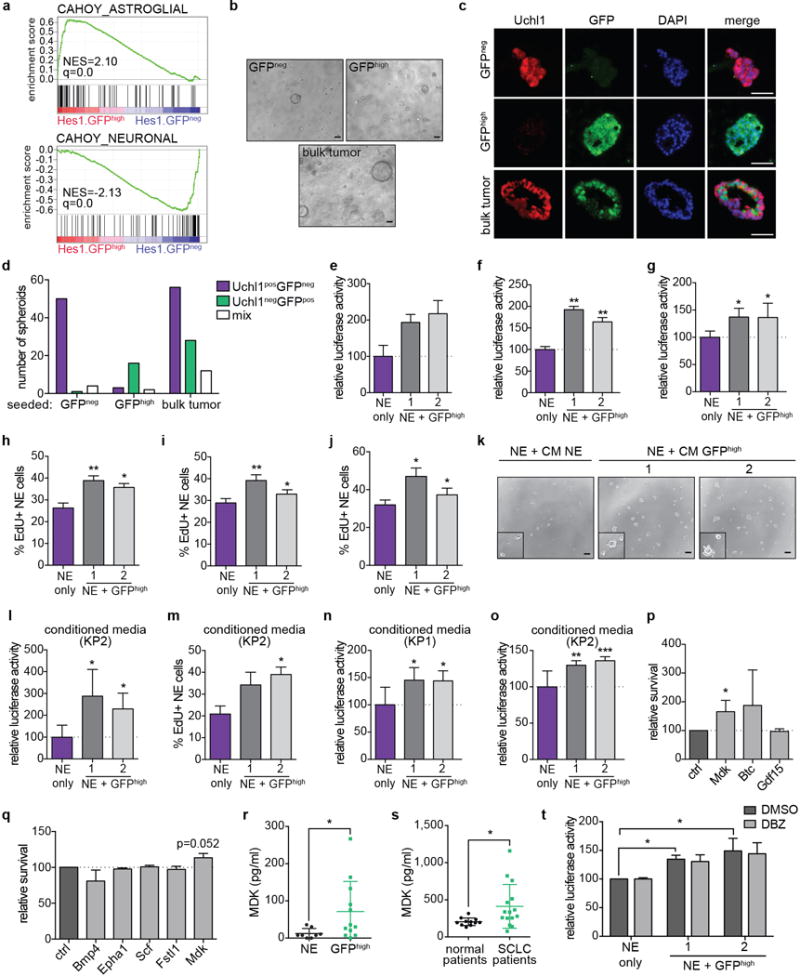
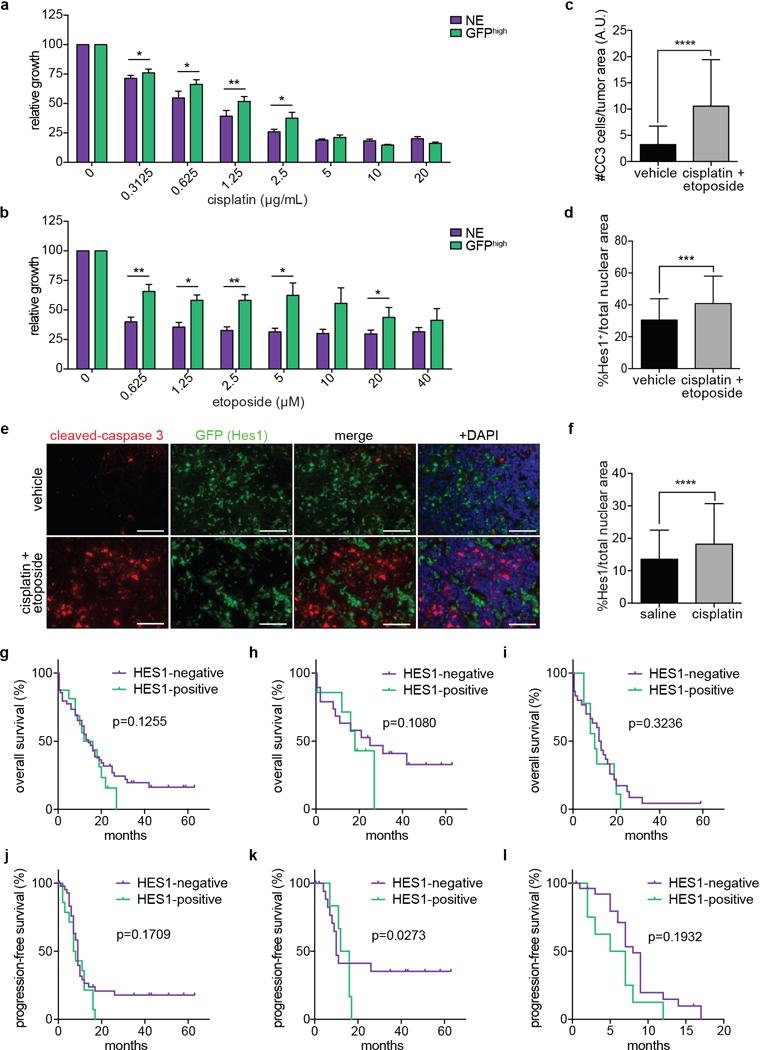
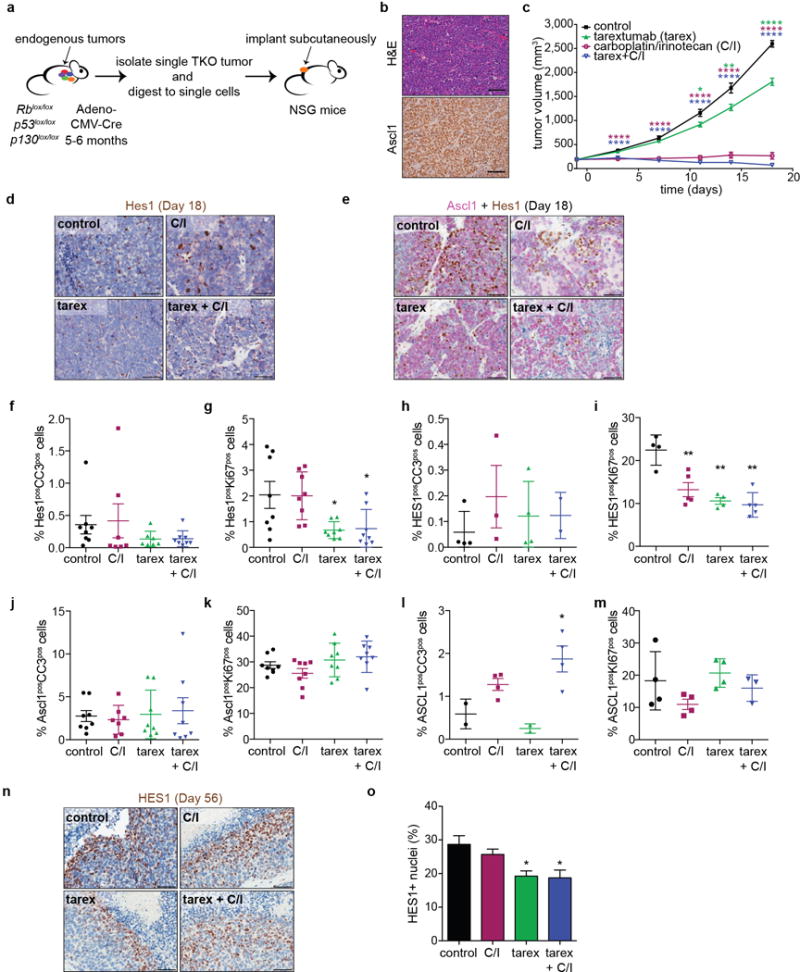
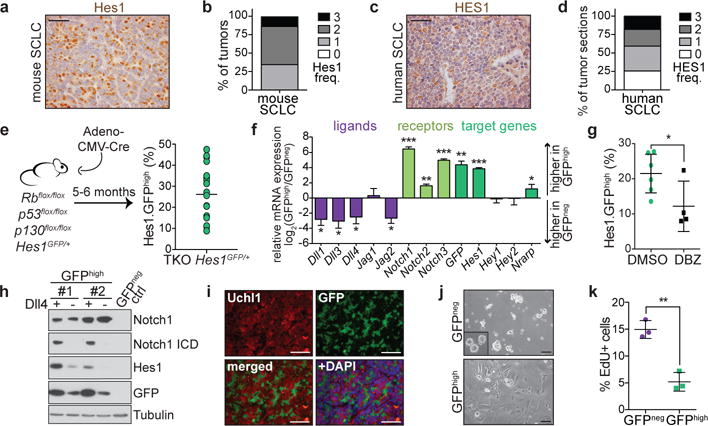
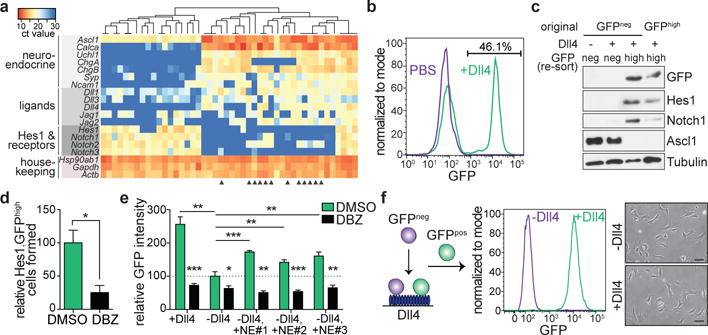
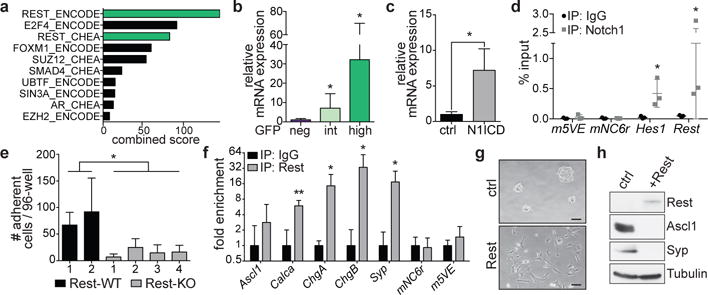
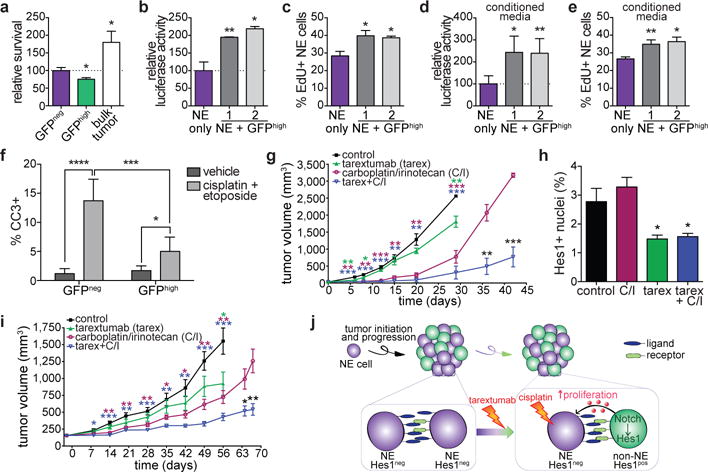
The Notch signalling pathway mediates cell fate decisions and is tumour suppressive or oncogenic depending on the context. During lung development, Notch pathway activation inhibits the differentiation of precursor cells to a neuroendocrine fate. In small-cell lung cancer, an aggressive neuroendocrine lung cancer, loss-of-function mutations in NOTCH genes and the inhibitory effects of ectopic Notch activation indicate that Notch signalling is tumour suppressive. Here we show that Notch signalling can be both tumour suppressive and pro-tumorigenic in small-cell lung cancer. Endogenous activation of the Notch pathway results in a neuroendocrine to non-neuroendocrine fate switch in 10-50% of tumour cells in a mouse model of small-cell lung cancer and in human tumours. This switch is mediated in part by Rest (also known as Nrsf), a transcriptional repressor that inhibits neuroendocrine gene expression. Non-neuroendocrine Notch-active small-cell lung cancer cells are slow growing, consistent with a tumour-suppressive role for Notch, but these cells are also relatively chemoresistant and provide trophic support to neuroendocrine tumour cells, consistent with a pro-tumorigenic role. Importantly, Notch blockade in combination with chemotherapy suppresses tumour growth and delays relapse in pre-clinical models. Thus, small-cell lung cancer tumours generate their own microenvironment via activation of Notch signalling in a subset of tumour cells, and the presence of these cells may serve as a biomarker for the use of Notch pathway inhibitors in combination with chemotherapy in select patients with small-cell lung cancer.


Conflict of interest statement

M.M.F., B.C., G.O., J.C., Y.W.L., A.M.K., T.H., and C.L.M. are employees of OncoMed Pharmaceuticals, a privately held and financed company, and declare competing financial interests.

Figures

Extended Data Figure 1
Extended Data Figure 1. SCLC tumors harbor a population of Hes1-positive tumor cells
a, Quantification of the frequency (Freq.) of Hes1pos cells in TKO tumors at different stages of tumor development. Scores: 0 (0%), 1 (1-20%), 2 (20-60%), 3 (>60%). Hyperplasias (n=26, from 5 mice, defined by area < 16,600 μm2) and early tumors (n=69, from 5 mice) were analyzed 3 months after Ad-CMV-Cre); late tumors (n=83, from 5 mice) and liver metastases (n=54, from 5 mice) were analyzed 6-7 months after Ad-CMV-Cre (data for the late tumors are shown for comparison and are the same as in Fig. 1b). b, As in a, for human SCLC tumor microarray sections and segregated by clinical stage. H-scores: stage I (123.9; n=71 sections), stage II (135.3; n=68 sections), stages III+IV (148.5; n=33 sections). c, Representative immunofluorescence (IF) for GFP in TKO Hes1GFP/+ SCLC tumors. d, Representative flow cytometry plots of cells isolated from pooled tumors from a TKO Hes1GFP/+ mouse. Arrows depict the sequential gating strategy for enriching for single, live (by exclusion of 7-aminoactinomycin D (7-AAD)) and lineage (CD45, CD31, TER-119)-negative cells. CD24 labels >98% of Cre-recombined cells and thus further enriches for tumor cells. e, IF of a TKO Rosa26lox-stop-lox-tdTomato;Hes1GFP/+ tumor section showing co-localization of GFP and Tomato signals. f, Flow cytometry shows that GFPhigh cells in pooled tumors from a TKO Rosa26lox-stop-lox-tdTomato;Hes1GFP/+ mouse infected with Ad-CMV-Cre are positive for Tomato expression (representative of n=2 mice). g, Genotyping PCR analysis for recombination (Δ) or the unrecombined (floxed) alleles at the Rb, p53 and p130 loci in GFPneg and GFPhigh tumor cells sorted from 3 TKO Hes1GFP/+ mice. DNA from fl/fl and/or Δ/Δ cells serve as controls. Scale bars, 50 μm.
Extended Data Figure 2
Extended Data Figure 2. Hes1-positive SCLC cells are Notch-pathway-active, epithelial, and do not express neuroendocrine markers
a, Representative IHC for Hes1 and Notch2 in serial TKO tumor sections. b, RNA-sequencing data of human SCLC tumors (from), with positive (ASCL1 and SOX2) and negative (CDX2, MYOD1) controls for expression in SCLC (n=81 tumors). c-g, TKO Hes1GFP/+ mice were treated with DMSO control (n=5 mice) or DBZ (n=4 mice). c, Representative flow cytometry of GFP in pooled tumors from one mouse per condition. Dotted lines delineate the GFPhigh population. d, Quantification of relative median GFP intensity of GFPhigh cells. e, qRT-PCR of sorted GFPneg and GFPhigh cells. f, Immunoblot analysis of sorted GFPneg and GFPhigh cells. At these exposure levels, GFP is detected but not Hes1 in DBZ-treated GFPhigh cells, possibly due to different half lives of the proteins (>24 hours for GFP compared to <1 hour for Hes1,). For Notch, an antibody that detects Notch1 cleaved specifically before V1744 (Notch1 ICD) or antibodies that detect the transmembrane+intracellular (excluding the extracellular region, ΔECD) regions of Notch1 or Notch2 were used. g, Representative IHC in treated tumors. h, Flow cytometry of two GFPhigh cell lines (n=2 biological replicas) grown on dishes coated with Dll4 or 72 hours after removal from Dll4. Negative control: GFPneg cell line. i, Quantification of relative median GFP intensity from (h) (n=2 biological replicas). j, Immunofluorescence for GFP and NE markers (CGRP and Syp) in TKO Hes1GFP/+ tumors. k, Flow cytometry of the NE marker Ncam1 and GFP in a TKO Hes1GFP/+ tumor (representative of n=3 biological replicas). The quadrants delineate the negative gates for the GFP and Ncam1 signals and show that GFPhigh cells are mostly negative for Ncam1 expression. l, qRT-PCR analysis of NE genes in GFPhigh cells relative to GFPneg cells (sorted from pooled tumors from n=3 mice, with n=3 technical replicas each). m, Flow cytometry analysis of the epithelial marker EpCAM and GFP (left) or CD44 and GFP (right) in a TKO Hes1GFP/+ tumor (representative of n=3 biological replicas). n, qRT-PCR of Vimentin in GFPneg and GFPhigh cells (n=4 mice). *P < 0.05; **P < 0.01. Statistical significance was determined by two-tailed unpaired (d,e) or paired (i,l,n) Student’s t-test. Data are represented as mean ± s.d. Scale bars, 50 μm.
Extended Data Figure 3
Extended Data Figure 3. Notch-active SCLC cells have switched to a non-neuroendocrine fate
a, Principal component analysis of normalized microarray gene expression values of GFPneg and GFPhigh tumor cells sorted from 3 TKO Hes1GFP/+ mice. The first two principal components accounting for 77.6% of the total variance are shown. b, Heatmap for differentially expressed genes in GFPneg and GFPhigh tumor cells by microarray. c, Gene set enrichment analysis (GSEA) for a Notch pathway signature enriched in GFPhigh cells. d, GSEA for a neuronal gene set (from the MSigDB C2 curated gene sets collection) enriched in GFPneg cells. e, GSEA of differentially expressed genes in GFPneg and GFPhigh cells. Gene sets enriched at FDR q-value <0.25 in the MSigDB C5 cellular component ontology are plotted as a function of normalized enrichment score (NES) against the q-value. Left: Gene sets enriched in GFPneg cells; gene sets related to neuronal signatures are highlighted in purple. Right: Gene sets enriched in GFPhigh cells; gene sets related to the extracellular region are highlighted in green. f,g, Enrichr analysis for cellular component (f) or biological process (g) gene ontology (GO) terms significantly enriched in GFPneg or GFPhigh cells. The top ten GO terms ranked by combined score are shown. h, Enrichr analysis for cell lines in the Cancer Cell Line Encyclopedia (CCLE) that closely resemble GFPneg or GFPhigh cells. The top ten GO terms ranked by combined score are shown. MTC: medullary thyroid carcinoma, a NE tumor of the thyroid; AC: adenocarcinoma.
Extended Data Figure 4
Extended Data Figure 4. Non-neuroendocrine, Notch-active cells in SCLC tumors are slower-growing than the neuroendocrine cells
a,b, Co-immunofluorescence for GFP and EdU (a) or phospho-histone H3 (b) in TKO Hes1GFP/+ tumors. c, Weight of tumors formed from freshly sorted GFPneg and GFPhigh tumor cells implanted subcutaneously in immunocompromised NSG mice (n=6 tumors each; two-tailed unpaired Student’s t-test). d, Flow cytometry of GFP in a tumor formed from freshly sorted GFPneg cells implanted subcutaneously in immunocompromised NSG mice (representative of n=6 biological replicas). *P < 0.05. Data are represented as mean ± s.d. Scale bars, 50 μm.
Extended Data Figure 5
Extended Data Figure 5. Non-neuroendocrine, Notch-active cells in SCLC tumors are generated from neuroendocrine tumor cells
a, Representative IHC for Hes1 and cleaved caspase-3 (CC3) in serial TKO tumor sections. Inset: higher magnification of a positive control for CC3 (tumor from a mouse treated with chemotherapy). b, Predicted numbers and ratio of GFPneg and GFPhigh tumor cells if the two populations divide independently of each other, and GFPneg cells cycle approximately 3 times faster than GFPhigh cells. c, Representative IHC in serial sections from TKO Hes1GFP/+ tumors initiated by Adeno-CGRP-Cre. d, Quantification of the frequency (Freq.) of Hes1pos cells in TKO hyperplasias (n=23, from 5 mice) and tumors (n=50, from 7 mice) induced by Adeno-CGRP-Cre. Scores: 0 (0%), 1 (1-20%), 2 (20-60%) 3 (>60%). e, Flow cytometry of %GFPhigh cells in pooled tumors from TKO Hes1GFP/+ mice (n=4) infected with Ad-CGRP-Cre. f, Images of freshly isolated GFPneg cells grown on dishes coated with Dll4 or PBS control (representative of n=3 biological replicas). g,h, Freshly isolated GFPneg cells that remained GFPneg after culture on Dll4-coated dishes were replated on dishes coated with Dll4 ligand (+Dll4) or PBS control (-Dll4). g, Flow cytometry and images (representative of n=2 biological replicas). h, GFPneg and GFPhigh cells that formed after this second round of Dll4 stimulation were sorted and analyzed by immunoblot. Control: GFPhigh cell line. i, Relative number of GFPhigh cells formed from freshly isolated GFPneg cells grown on Dll4 after two weeks of tarextumab treatment (n=3 biological replicas each). j, Single cell qRT-PCR (n=45 each) of H29, H82 and H889 human SCLC cell lines. Heatmap was generated by unsupervised clustering of each cell line. Dark blue regions indicate undetectable expression. k, qRT-PCR for HES1 after 72 hours of culture with or without Dll4. Data is normalized to GAPDH (n=3 biological replicas with n=3 technical replicas each). l,m, GFPhigh cell lines were treated with DMSO or DBZ while grown with or without Dll4 or co-cultured with 3 individual NE cell lines in the absence of Dll4. GFP expression was analyzed by flow cytometry after 72 hours. l, Flow cytometry of GFPhigh cell line #1 (representative of n=3 biological replicas; GFP intensity quantified in Fig. 2e). m, Quantification of GFP intensity in GFPhigh cell line #2; relative median GFP intensity normalized to the DMSO -Dll4 condition (n=3 biological replicas). n,o, Representative images (n) and qRT-PCR (o) of GFPhigh cell lines cultured in the presence of absence of Dll4 for more than a month (n=3 biological replicas with n=3 technical replicas). p, Freshly isolated GFPneg cells that became GFPhigh after culture on Dll4 were replated on dishes coated with Dll4 ligand or PBS control and analyzed by immunoblot after a month. GFPneg cell lysate: positive control for Ascl1. *P < 0.05; **P < 0.01. Statistical significance was determined by two-tailed paired Student’s t-test. Data are represented as mean ± s.d. Scale bars, 50 μm.
Extended Data Figure 6
Extended Data Figure 6. Analysis of SCLC cells with intermediate levels of activation of the Notch pathway
a, Flow cytometry showing gates used to sort for tumor cells with negative (neg), intermediate (int), and high levels of GFP from a TKO Hes1GFP/+ mouse (representative of n=4 biological replicas). b, qRT-PCR for Notch pathway genes and NE genes in sorted cells (n=4 biological replicas with n=3 technical replicas each). c-e, Single cell qRT-PCR of GFPneg, GFPint and GFPhigh cells sorted from one TKO Hes1GFP/+ tumor (n=32 cells sorted per group; 20 cells with low expression of housekeeping genes were excluded from the heatmaps). (c) Unsupervised clustering segregates the cells into two main groups. (d) Supervised clustering and (e) analysis of Hes1 mRNA (normalized to Gapdh) shows that the number of GFPint cells with detectable Hes1 levels is intermediate between GFPneg and GFPhigh cells. f, Representative images of freshly isolated cells in culture (without Dll4). Scale bars, 50 μm. *P < 0.05; **P < 0.01; ***P < 0.001; ****P < 0.0001. Statistical significance was determined by two-tailed paired Student’s t-test. Data are represented as mean ± s.d.
Extended Data Figure 7
Extended Data Figure 7. Upregulation of Rest is required for the NE to non-NE transition
a,b, Images (a) and immunoblot analysis (b) of a murine NE SCLC cell line (KP1) ~1 month after N1ICD transduction (representative of n=2 biological replicas). c, Immunoblot of KP1 cells transduced with Ascl1 shRNAs or a shGFP control. Note that the level of Ascl1 downregulation is similar to that achieved by N1ICD overexpression at a similar time point (not shown). d, qRT-PCR of NE genes in KP1 cells transduced with Ascl1 shRNAs (n=3 biological replicas with n=3 technical replicas each). e, Representative images of KP1 cells approximately one month after Ascl1 knockdown. f, qRT-PCR for Rest in GFPneg (n=3) and GFPhigh (n=4) cell lines (n=3 technical replicas each). g, qRT-PCR of freshly isolated GFPneg cells two weeks after culture in the absence or presence of Dll4 (n=2 biological replicas with n=3 technical replicas each). h, Sanger sequencing verification of n=4 Rest-knockout (KO) KP1 clones, with the sequence of both alleles shown. i, qRT-PCR for NE genes in Rest-WT (n=3) and Rest-KO (n=4) clones (n=3 technical replicas each). j, Schematic for assay to assess the ability of N1ICD to induce adherent non-NE cells from NE SCLC cells. NE SCLC cells (KP1) were transduced with a N1ICD retrovirus or an empty vector control. 72 hours later, 1200 cells were seeded per well of a 96-well plate. The number of adherent cells per well was counted after two weeks. k, KP1 cells stably integrated with Rest shRNAs or an shGFP control were transducted with a N1ICD retrovirus and the number of adherent cells counted after two weeks (see schematic in Extended Data Fig. 7j) (n=3 biological replicas with n=3 technical replicas each). l, qRT-PCR for NE genes in KP1 cells 48 hours after Rest overexpression (n=3 biological replicas with n=3 technical replicas each). *P < 0.05; **P < 0.01; ***P < 0.001; ****P < 0.0001. Statistical significance was determined by two-tailed paired (d,k,l) or unpaired (f) Student’s t-test. Data are represented as mean ± s.d. Scale bars, 50 μm.
Extended Data Figure 8
Extended Data Figure 8. Notch-active SCLC cells promote the survival of neuroendocrine SCLC cells
a, GSEA signatures enriched in GFPhigh (astroglial signature) and GFPneg (neuronal signature) tumor cells based on microarray data of tumors from n=3 mice. b, Images of GFPneg, GFPhigh or bulk tumor cells (mixture of GFPneg and GFPhigh) 7 days after isolation from TKO Hes1GFP/+ mice and seeded at equal numbers in 50% Matrigel (representative of n=3 biological replicas). c, Immunofluorescence for Uchl1 (NE marker) and GFP 10 days after the cells were sorted from TKO Hes1GFP/+ tumors and in 50% Matrigel. Note: Most of the spheroids in the bulk culture were composed of only one type of cell (Uchl1posGFPneg or Uchl1negGFPpos; the mixed spheroid shown here are the minority. d, Quantification of the number of each type of spheroids in each culture condition from (c) (n=3 mice, 2 sections each for immunostaining). e-g, Relative luciferase activity of a luciferase-labeled mouse SCLC NE cell line seeded alone or co-cultured with GFPhigh cell lines (n=2 (e) or n=3 (f,g) biological replicas with n=3 technical replicas each). e, 2% serum, KP2 NE cell line. f,g, 10% serum, KP1 (f) and KP2 (g) cell lines. h-j, As in e-g, but the cells were fixed and collected for EdU analysis by flow cytometry (n=2 (h) or n=3 (i,j) biological replicas). k, Representative images of KP1 cells seeded in conditioned media (CM) (2% serum) from KP1 cells or from GFPhigh cell lines. l, Relative luciferase activity of luciferase-labeled KP2 cells 72 hours after seeding in CM (2% serum) from KP2 cells or from GFPhigh cell lines (n=3 biological replicas with n=3 technical replicas each). m, As in l, but the cells were fixed and collected for EdU analysis by flow cytometry (n=3 biological replicas). n,o, As in l, but with KP1 (n) or KP2 cells (o) in 10% serum (n=3 biological replicas with n=3 technical replicas each). p,q, AlamarBlue cell viability assay for NE SCLC cell lines 72 hours after culture with the indicated recombinant proteins (n=3 biological replicas with n=3 technical replicas each). r, ELISA assay for midkine in supernatant from NE (n=4) and GFPhigh (n=4) cell lines (n=2 biological replicas each). s, Luminex assay for midkine in serum plasma from normal (control; n=11) and SCLC (n=15) patients. t, Relative luciferase activity of luciferase-labeled mouse SCLC NE cell lines (n=4) 72 hours after seeding alone or co-cultured with GFPhigh cell lines and treated with 10 μM DBZ or DMSO control. Data are normalized to NE-monoculture with DMSO (n=3 biological replicas with n=3 technical replicas each). *P < 0.05; **P < 0.01; ***P < 0.001. Statistical significance was determined by two-tailed paired Student’s t-test, except for (r,s: two-tailed unpaired Student’s t-test). Data are represented as mean ± s.d. Scale bars, 50 μm.
Extended Data Figure 9
Extended Data Figure 9. Notch-active SCLC cells are more resistant to chemotherapy than neuroendocrine SCLC cells
a,b, Average cell viability (MTT assay) of NE (n=4) and GFPhigh (n=3) cell lines 48 hours after cisplatin (a) or etoposide (b) treatment (n=3 biological replicas with n=3 technical replicas each). c,d, Quantification of cells expressing cleaved caspase-3 (CC3) (c) and Hes1 (d) in tumors in TKO mice acutely treated with cisplatin and etoposide (CC3: n=49; Hes1: n=41 tumors) or a vehicle control (CC3: n=48; Hes1: n=67 tumors) (data from 2 groups of 3 mice previously described in Fig. 4a,b in but analyzed as number of CC3pos per tumor, not per mouse). e, Representative immunofluorescence of tumors from TKO Hes1GFP/+ mice acutely treated with acutely treated with cisplatin and etoposide. Scale bars, 50 μm. f, Quantification of Hes1pos cells in the tumors of TKO Rosa26lox-stop-lox-Luciferase mice after 3 weeks of weekly saline (n=190 tumors, from 7 mice) or cisplatin (n=217 tumors, from 8 mice) treatments. g-i, Overall survival of all (g; n=65, 49 HES1neg, 16 HES1pos), stages I-III (h; n=26, 19 HES1neg, 7 HES1pos) or stage IV (i; n=39, 30 HES1neg, 9 HES1pos) SCLC patients with HES1-negative or HES1-positive tumors. j-l, Progression-free survival of all (j; n=67, 51 HES1neg, 16 HES1pos), stages I-III (k; n=28, 21 HES1neg, 7 HES1pos) or stage IV (l; n=39, 30 HES1neg, 9 HES1pos) SCLC patients with HES1-negative or HES1-positive tumors. *P < 0.05; **P < 0.01; ***P < 0.001; ****P < 0.0001. Statistical significance was determined by two-tailed paired (a,b) or unpaired (c,d,f) Student’s t-test. For g-l, probability was calculated using a weighted log-rank test with emphasis on later time points (see methods). Data are represented as mean ± s.d.
Extended Data Figure 10
Extended Data Figure 10. Notch2/3 inhibition in vivo reduces the Notch-active cell population in SCLC and improves anti-tumor response in combination with chemotherapy
a, Schematic for the generation of TKO allografts. A TKO tumor was isolated, digested to form single cells and implanted subcutaneously in NSG mice. b, Representative hematoxylin and eosin (H&E) staining and IHC for Ascl1 in allograft tumor sections. c, Tumor volumes of TKO allografts treated with the indicated drugs (n=16 tumors per group, 1 experiment). The experiment was stopped at day 18 and samples were collected for analysis. d,e, Representative IHC for Hes1 (d) or double IHC for Hes1 (brown) and Ascl1 (pink) (e) in TKO allograft tumors collected 18 days after the start of treatment. f,g, IHC staining quantification for the frequency of Hes1posCC3pos (f) and Hes1posKi67pos (g) cells in murine TKO allografts after 18 days of treatment (n=8 tumors per group, except for C/I and tarex in (f) (n=7 tumors each). h,i, IHC staining quantification for the frequency of HES1posCC3pos (h) and HES1posKI67pos (i) cells in xenograft tumors after 31 days of treatment (for h, control/tarex groups: n=4 tumors each; C/I: n=3 tumors; tarex+C/I: n=2 tumors; for i, control/tarex groups: n=4 tumors each; C/I and tarex+C/I groups: n=5 tumors each). j,k, IHC staining quantification for the frequency of Ascl1posCC3pos (j) and Ascl1posKi67pos (k) cells in murine TKO allografts after 18 days of treatment (n=8 tumors per group, except for the C/I group in (j) (n=7 tumors). l,m, IHC staining quantification for the frequency (%) of ASCL1posCC3pos (l) and ASCL1posKI67pos (m) cells in xenograft tumors after 31 days of treatment (n=4 tumors per group, except for control and tarex groups in (l) (n=2 tumors) and the tarex+C/I group in (m) (n=3 tumors). n,o, Representative IHC (n) and quantification of HES1pos (o) cells in LU66 PDX tumors collected 56 days after the start of treatment (control: n=3 tumors; tarex: n=4 tumors; C/I and tarex+C/I: n=5 tumors per group). *P < 0.05; **P < 0.01; ***P < 0.001; ****P < 0.0001. Statistical significance was determined by two-tailed unpaired Student’s t-test. Data are represented as mean ± SEM. Scale bars, 50 μm.
Figure 1
Figure 1. SCLC tumors harbor slow-growing, Notch-active non-neuroendocrine tumor cells
a,b, Representative Hes1 IHC (a) and frequency of Hes1pos cells (b) in mouse SCLC (n=5 mice, 83 tumors). c,d, As in a,b, for human SCLC (n=172 sections). e, Flow cytometry of %GFPhigh cells from pooled TKO Hes1GFP/+ tumors (n=18 mice). f, qRT-PCR of Notch pathway genes in GFPhigh relative to GFPneg tumor cells (n=3 mice). g, As in e, with mice treated with DMSO (n=5 mice) or DBZ (n=4 mice). h, Immunoblots of GFPhigh cell lines grown with Dll4 or 72 hours after removal from Dll4. i, GFP and Uchl1 (NE marker) immunofluorescence in TKO Hes1GFP/+ tumors (representative of n=3 biological replicas). j, Images of cell cultures established from GFPneg and GFPhigh tumor cells (representative of n=5 biological replicas). Inset: NE KP1 SCLC cell line. k, EdU incorporation in cells sorted from TKO Hes1GFP/+ tumors (n=3 mice). *P < 0.05; **P < 0.01; ***P < 0.001. Two-tailed paired (f,k) or unpaired (g) Student’s t-test. Data are mean ± s.d. Scale bars, 50 μm.
Figure 2
Figure 2. Notch activation generates non-neuroendocrine cells from neuroendocrine SCLC cells
a, Unsupervised clustering of qRT-PCR (n=46 cells) from one TKO Hes1GFP/+ tumor (representative of n=2 experiments). Dark blue: undetectable expression. Arrowheads: NE cells that express at least one Notch receptor but have undetectable Hes1. b, Flow cytometry of freshly isolated GFPneg cells grown on Dll4 or PBS control (representative of n=3 biological replicas). c, Immunoblot of (b). GFPneg cells grown on Dll4 were re-sorted for GFPneg and GFPhigh populations. d, Relative number of GFPhigh cells generated from freshly-isolated GFPneg cells grown on Dll4 after DBZ treatment (n=3 biological replicas). e, Flow cytometry of a GFPhigh cell line treated with DMSO or DBZ while grown with or without Dll4 or co-cultured with 3 NE cell lines without Dll4 (n=3 biological replicas). Median GFP intensity normalized to DMSO; -Dll4. f, Freshly isolated GFPneg cells that became GFPhigh after Dll4 exposure were replated with or without Dll4. Flow cytometry and images are shown (representative of n=2 biological replicas). *P < 0.05; **P < 0.01; ***P < 0.001. Two-tailed paired Student’s t-test. Data are mean ± s.d. Scale bars, 50 μm.
Figure 3
Figure 3. Rest is a Notch target that inhibits neuroendocrine differentiation in SCLC
a, Top ten candidate factors from Enrichr analysis for the regulation of genes downregulated in GFPhigh cells. b, qRT-PCR for Rest in cells sorted from TKO Hes1GFP/+ tumors (n=4 mice). c,d, qRT-PCR for Rest (c) and Notch1 ChIP-qPCR (d) in KP1 cells overexpressing N1ICD (n=3 biological replicas with n=3 technical replicas). m5VE, mNC6R: negative control genomic regions. e, Adherent cell numbers in Rest wild-type (WT) or knockout (KO) clones after N1ICD transduction (see Extended Data Fig. 7j) (n=3 biological replicas with n≥3 technical replicas each). f, Rest ChIP-qPCR in KP1 cells (n=3 biological replicas with n=3 technical replicas each). g,h, Images (g) and immunoblot (h) of KP1 cells ~1 month after Rest transduction (representative of n=2 biological replicas). *P < 0.05; **P < 0.01. Two-tailed paired (b-d,f) or unpaired (e) Student’s t-test. Data are mean ± s.d. Scale bars, 50 μm.
Figure 4
Figure 4. Notch-active SCLC cells promote the growth of neuroendocrine SCLC cells and a combination of chemotherapy and Notch blockade inhibits SCLC growth
a, Cell viability assay of GFPneg, GFPhigh or a mixture of GFPneg and GFPhigh cells (bulk) in Matrigel (n=3 biological replicas). b,c, Relative luciferase activity (b) and EdU incorporation (c) of luciferase-labeled KP1 cells in 2% serum with or without GFPhigh cells (n=3 biological replicas, with n=3 technical replicas each for (b)). d,e, As in b,c, with conditioned media from KP1 or from GFPhigh cell lines (n=3 biological replicas, with n=3 technical replicas each for (d)). f, Quantification of %CC3pos cells in GFPneg or GFPhigh tumor cells in TKO Hes1GFP/+ mice treated acutely with cisplatin/etoposide (n=15 tumors per group, from 3 mice). g, Tumor volumes of TKO SCLC allografts (n=5 tumors per group, one experiment). h, Quantification of Hes1pos cells (n=8 tumors except tarex+C/I (n=6 tumors), one experiment) in TKO allografts after 18 days of treatment. i, Tumor volumes of PDX model OMP-LU66 treated with control antibody (n=10 tumors), tarex (n=9), C/I (n=20), or tarex + C/I (n=24) (one experiment). j, Model. In SCLC tumors, Notch signaling is activated in a subset of NE cells, leading to a loss of NE features. Non-NE SCLC cells promote the growth of NE cells. Combining chemotherapy and Notch inhibition can target both the fast cycling NE cells and the non-NE cells, respectively. *P < 0.05; **P < 0.01; ***P < 0.001; ****P < 0.0001. For a-f, statistical significance determined by two-tailed paired (a-e) or unpaired (f) Student’s t-test; data are mean ± s.d. For g-i, statistical significance determined by two-tailed unpaired t-test against the control group when applicable or between the C/I and Tarex+C/I groups; data are mean ± SEM. Scale bars, 50 μm.

Comment in

References

    1. Hori K, Sen A, Artavanis-Tsakonas S. Notch signaling at a glance. Journal of cell science. 2013;126:2135–2140. doi: 10.1242/jcs.127308. - DOI - PMC - PubMed
    1. Ntziachristos P, Lim JS, Sage J, Aifantis I. From fly wings to targeted cancer therapies: a centennial for notch signaling. Cancer Cell. 2014;25:318–334. doi: 10.1016/j.ccr.2014.02.018. - DOI - PMC - PubMed
    1. Koch U, Radtke F. Notch and cancer: a double-edged sword. Cell Mol Life Sci. 2007;64:2746–2762. doi: 10.1007/s00018-007-7164-1. - DOI - PMC - PubMed
    1. Ito T, et al. Basic helix-loop-helix transcription factors regulate the neuroendocrine differentiation of fetal mouse pulmonary epithelium. Development. 2000;127:3913–3921. - PubMed
    1. Morimoto M, Nishinakamura R, Saga Y, Kopan R. Different assemblies of Notch receptors coordinate the distribution of the major bronchial Clara, ciliated and neuroendocrine cells. Development. 2012;139:4365–4373. doi: 10.1242/dev.083840. - DOI - PMC - PubMed

Publication types

MeSH terms

Substances

LinkOut - more resources