. 2017 Jun 5;214(6):1663-1678.
doi: 10.1084/jem.20161653. Epub 2017 May 10.

PD-1 regulates KLRG1+ group 2 innate lymphoid cells

Affiliations

PD-1 regulates KLRG1+ group 2 innate lymphoid cells

Samuel Taylor et al. J Exp Med. .

Abstract

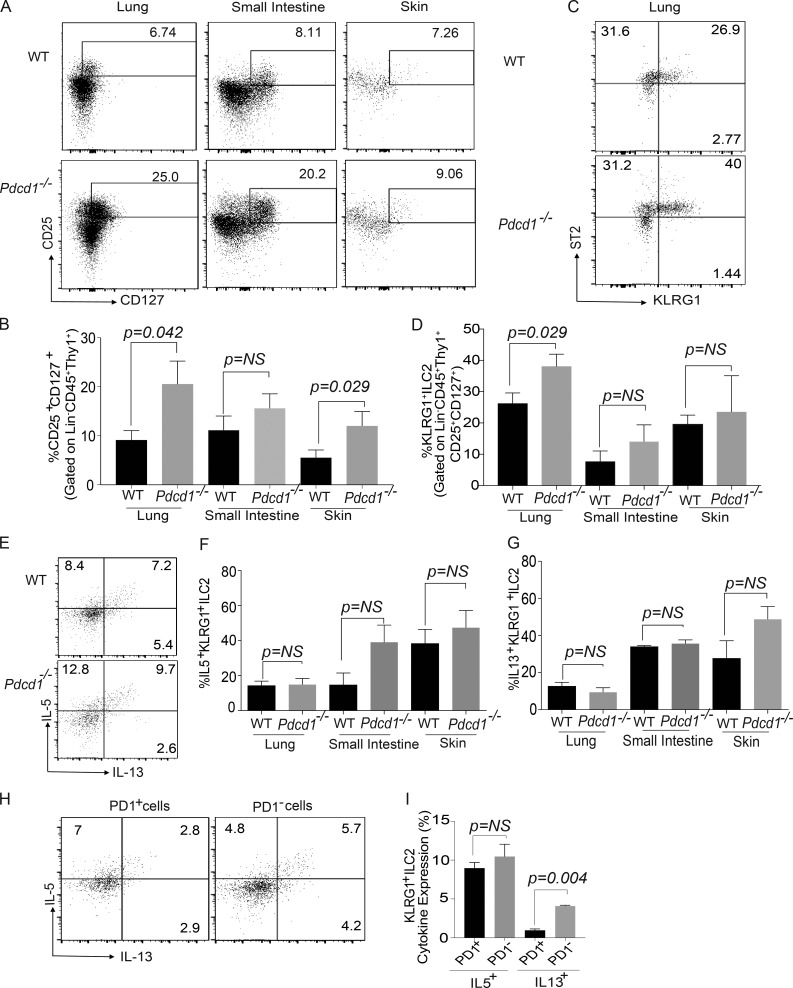
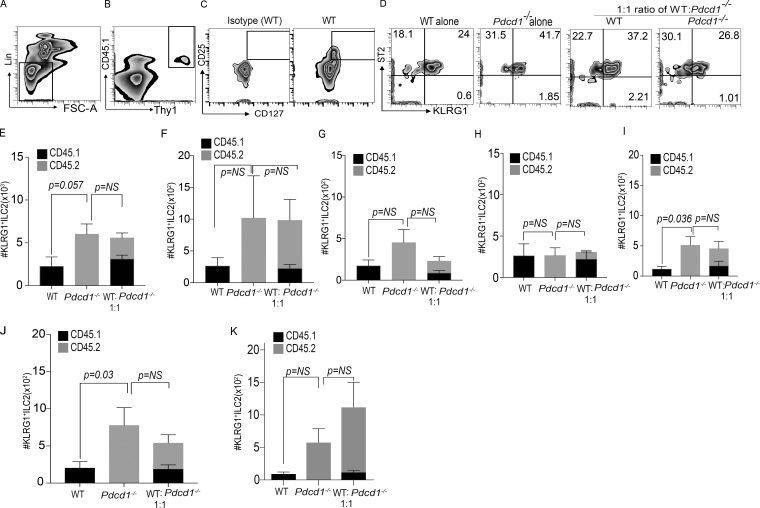
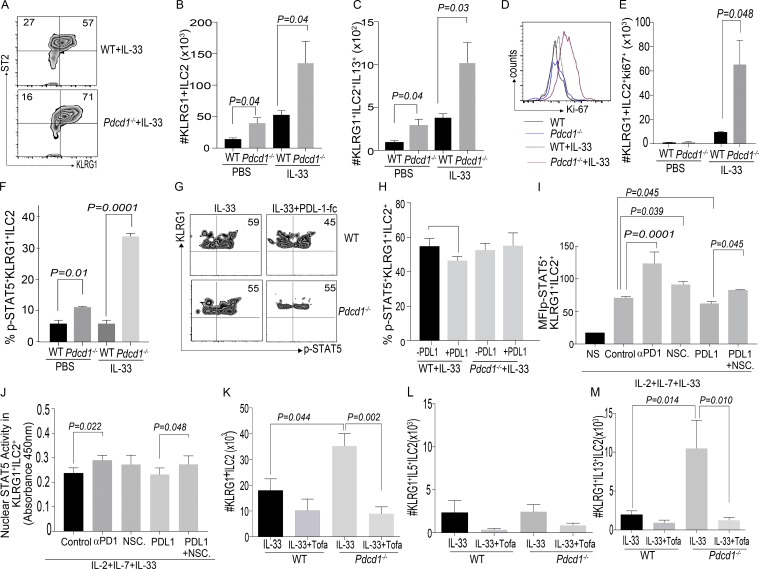
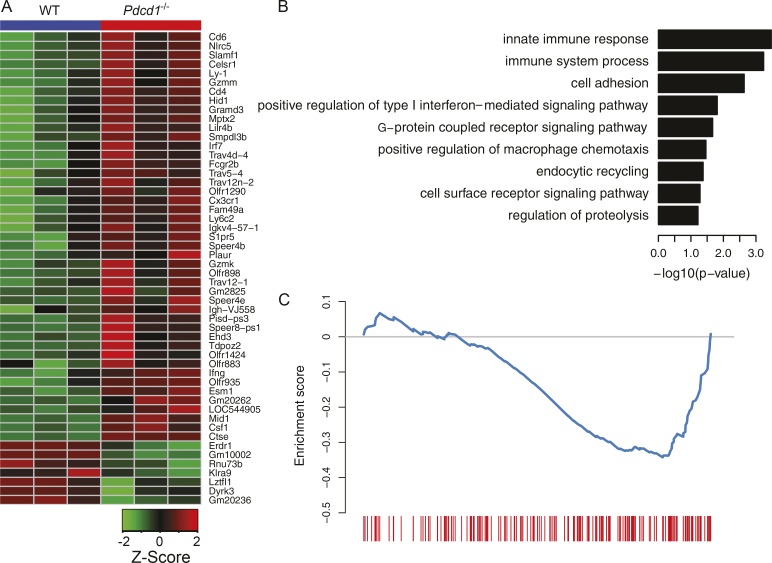
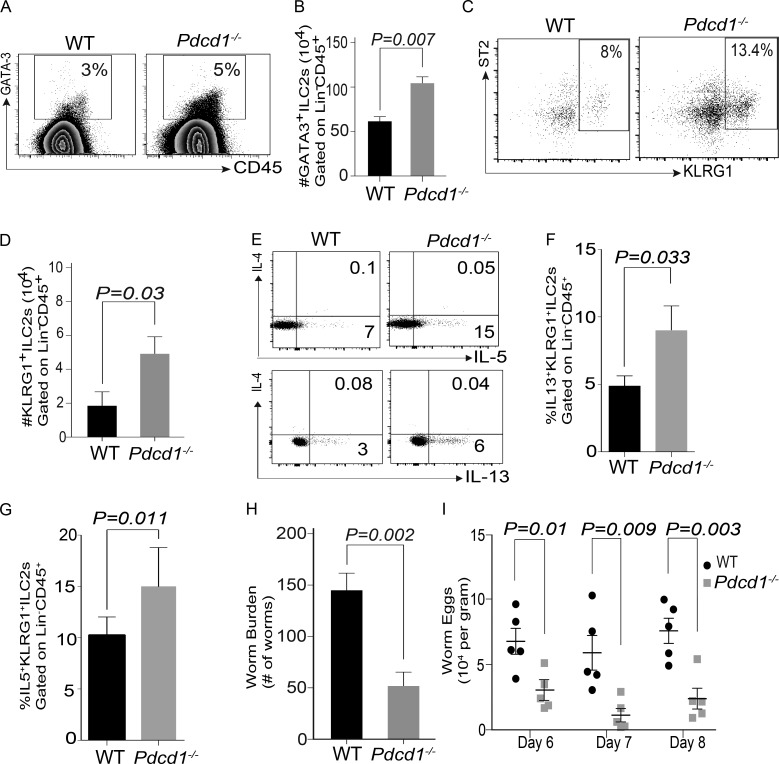
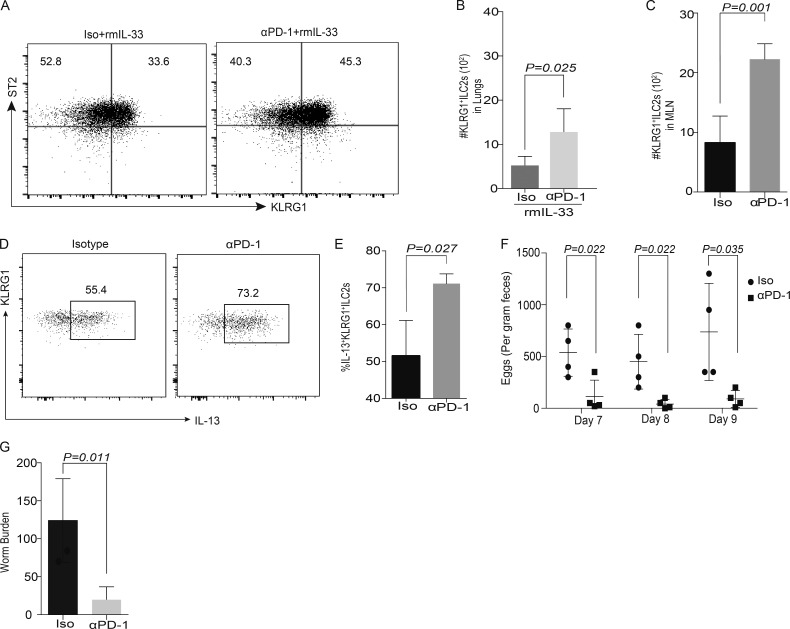
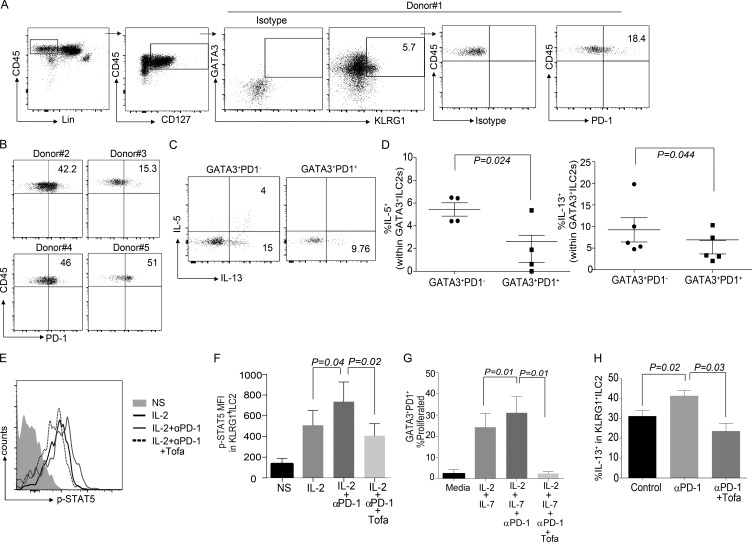
Group 2 innate lymphoid cells (ILC-2s) regulate immune responses to pathogens and maintain tissue homeostasis in response to cytokines. Positive regulation of ILC-2s through ICOS has been recently elucidated. We demonstrate here that PD-1 is an important negative regulator of KLRG1+ ILC-2 function in both mice and humans. Increase in KLRG1+ ILC-2 cell numbers was attributed to an intrinsic defect in PD-1 signaling, which resulted in enhanced STAT5 activation. During Nippostrongylus brasiliensis infection, a significant expansion of KLRG1+ ILC-2 subsets occurred in Pdcd1-/- mice and, upon adoptive transfer, Pdcd1-/- KLRG1+ ILC-2s significantly reduced worm burden. Furthermore, blocking PD-1 with an antibody increased KLRG1+ ILC-2 cell number and reduced disease burden. Therefore, PD-1 is required for maintaining the number, and hence function, of KLRG1+ ILC-2s.


Figures

Figure 1.
Figure 1.
Characterization of ILC-2 subsets in WT and Pdcd1−/− mice. Lungs, small intestine, and skin were harvested from WT and Pdcd1−/− mice, and then ILC-2 subsets were characterized by flow cytometry. Lin was defined as CD3, CD4, CD8, NK1.1, GR1, Ter119, CD5, CD11b, CD11c, F4/80, CD45R/B220, and CD19. Gating strategy for ILCs included an initial gating of LinCD45+Thy1+. ILCs were then characterized as LinCD45+ Thy1+CD127+CD25+ and ILC-2s as LinCD45+ Thy1+CD127+CD25+ST2+KLRG1+. Representative flow plots of ILC subset frequency in the lungs, small intestine, and skin in the WT and Pdcd1−/− mice (A). Summary of ILC frequency in the lungs, small intestine, and skin (B). Representative flow plots of ILC-2 subset frequency in the lungs in the WT and Pdcd1−/− mice (C). Summary of KLRG1+ ILC-2 frequency in the lungs, small intestine, and skin (D). Cytokine expression of ILC-2 subsets were measured by stimulating the cells with cell stimulation cocktail for 4 h, and expression of cytokines such as IL-5 and IL-13 were measured by flow cytometry. The expression of IL-5 and IL-13 by LinCD45+ Thy1+CD127+CD25+ST2+KLRG1+ in WT and Pdcd-1−/− mice; representative example in lungs (E) and summary in the various organs (F and G). KLRG1+ILC-2 cells from the lungs of WT mice were gated for PD1 and PD1+, and then the cytokine profile was monitored by intracellular flow cytometry (H and I). Experiments were repeated three times reproducibly, and data shown are from n = 3–5 mice for all panels. Data shown is mean ± SEM. A Student’s t test was performed to determine statistical significance between the various cohorts. P ≤ 0.05 was considered significant. Significant p-values are denoted in the figures.
Figure 2.
Figure 2.
PD-1 deficiency does not alter ILC-2 cell development. Host CD45.1+C57BL6 mice were subjected to total body irradiation (1,050 cGy), and then reconstituted with either CD45.1+ WT BM (10 million) or CD45.2+Pdcd1−/− BM (10 million). Some cohorts received both WT and Pdcd1−/− BM at a 1:1 ratio (5 million WT:5million Pdcd1−/−). At 8 wk after BM transplant, ILC-2 were analyzed by flow cytometry via gating on Lin CD45+ Thy1+ CD127+ CD25+ ST2+ KLRG1+ (Representative data from lungs; A–D) and cell numbers were characterized in the lungs, small intestine, and mesenteric LNs. Summary of the absolute numbers of KLRG1+ILC-2 cells in the lungs (E), small intestine (F), and mesenteric LNs (G). Single-cell suspensions were stimulated with cytokine stimulation cocktail, and cytokine profile was measured by flow cytometry. Summary of absolute numbers of IL-5 and IL-13 from lung KLRG1+ILC-2s (H and I). Host C57BL6 Rag−/−γc−/− mice were reconstituted with either CD45.1+ WT BM (10 million), or CD45.2+Pdcd1−/− BM (10 million). Some cohorts received both WT and Pdcd1−/− BM at a 1:1 ratio. At 8 wk after BM transplant, the lung and small intestine were harvested from the mice and KLRG1+ILC-2 cell numbers were characterized. Summary of the absolute numbers of KLRG1+ILC-2 cells in the lungs (J) and small intestine (K) in the various cohorts was analyzed by flow cytometry. Animals per cohort was n = 5. Data shown are mean ± SEM. Experiments were repeated twice. A one-way ANOVA analysis followed by a multiple comparison test [Turkey] was performed to determine statistical significance between the various cohorts. P ≤ 0.05 was considered significant. Significant p-values are denoted in the figures.
Figure 3.
Figure 3.
Lack of PD-1 signaling results in a significant increase in KLRG1+ ILC-2 numbers. WT and Pdcd1−/− mice were either treated with PBS or IL-33 (200 ng/mice) for 3 d. ILC-2 frequency and numbers were evaluated by flow cytometry at day 3. Gating strategy include: LinCD45+ Thy1+CD127+CD25+ST2+KLRG1+. Representative flow plots of KLRG1+ILC-2 subsets in WT and Pdcd1−/− (A) and summary of absolute numbers of KLRG1+ ILC-2 in WT and Pdcd1−/− lungs were evaluated (B). Cytokine expression of ILC-2 subsets were measured by stimulating the cells with cell stimulation cocktail for 4 h, and expression of cytokines such as IL-5 and IL-13 were measured by flow cytometry. The absolute number of IL-13+ cells within LinCD45+ Thy1+CD127+CD25+ST2+KLRG1+ in WT and Pdcd-1−/− mice (C). Ki67 staining in the different cohorts were analyzed by flow cytometry (D and E). WT or Pdcd-1−/− were treated with PBS or IL-33 (200ng/mice) for 1 d. Lung ILC-2 cells were isolated, and then restimulated with IL-2 for 15 min, followed by phospho-STAT5 flow cytometry. Summary of the frequency of p-STAT5 signaling in the various cohorts (F). Experiments were repeated where WT or Pdcd-1−/− mice were treated with PBS or IL-33 (200 ng/mice) for 3 d. Lung ILC-2 cells were restimulated with IL-2 alone or IL-2 along with coated PDL-1fc chimera (5 µg/ml) for 15 min, followed by phospho-STAT-5 flow cytometry. Representative flow plots showing p-STAT5 signaling in WT (G; top) or Pdcd-1−/− (G; bottom). Summary of the frequency of p-STAT5 signaling in the various cohorts (H). Experiments were repeated where WT mice were treated with IL-33 (200 ng/mice) for 3 d, and lung ILC-2s were stimulated for 24 h with IL-2, IL-7, and IL-33. In addition, cohorts were treated with Isotype control antibody, αPD-1 antibody, NSC87877, PDL-1fc, or PDL-1 Fc plus NSC87877. After 24-h stimulation, cells were restimulated with IL-2 (100 ng/ml) and subjected to p-STAT5 flow cytometry. Mean fluorescence intensity of p-STAT5 in KLRG1+ILC-2s from various cohorts (I). Experiments were repeated, and ILC-2s were stimulated in vitro for 3 d, and then nuclear lysates were tested for STAT5a (J). Mechanistic experiments were set up with WT and Pdcd1−/− mice, where cohorts were treated with rmIL-33 + Vehicle (DMSO) or with rmIL-33 + Tofacitinib (15mg/kg/d/mouse). Absolute numbers of KLRG1+ILC-2s were evaluated at day 3 after treatment (K), and functional cytokine expression was monitored in the various cohorts (L and M). Animals per cohort was n = 5. Data shown are mean ± SEM and cumulative of at least two repeats. A one-way ANOVA analysis followed by a multiple comparison test (Tukey) was performed to determine statistical significance between the various cohorts. P ≤ 0.05 was considered significant. Significant p-values are denoted in the figures.
Figure 4.
Figure 4.
Comparison of gene expression profiles of KLRG1+ ILC-2s between WT and Pdcd1−/−. LinCD90+KLRG1+ ILC-2s were sorted from the lungs of WT or Pdcd1−/− mice that had been treated with IL-33 for 3 d. Total RNA was isolated, and then subjected to microarray analysis. Heat map for the expression patterns of differentially expressed genes (A). Representative GO terms enriched for genes up-regulated in Pdcd1−/−. Only GO terms from the biological process category is shown. The log10-scaled p-value is indicated in the x axis (B). Gene set enrichment analysis of the effect of Pdcd1 knockout for gene expression. The genes are ranked by fold change as evaluated by microarray data, and compared with the gene set available from GEO under accession no. GSE26495 (NAIVE_VS_PD1LOW_CD8_TCELL_DN). The blue curve shows the running enrichment score (ES) for the gene set as the analysis walks down the ranked gene list. The leading edge for the gene set is shown as short bars at the bottom. The normalized enrichment score (NES) is calculated as –1.51, and the false discovery rate FDR is calculated as 0.036 (C). A one-way ANOVA analysis was performed to determine statistical significance. Microarray analysis was performed in triplicates, and each experiment consisted of n = 5 mice per cohort.
Figure 5.
Figure 5.
KLRG1+ ILC-2 cells from Pdcd1−/−are efficient at clearing N. brasiliensis from Rag−/−γc−/− mice. WT or Pdcd1−/− mice were infected with N. brasiliensis, and then KLRG1+ ILC-2 numbers in the mesenteric LNs were evaluated by flow cytometry. Representative flow plots showing GATA3+ ILC-2 frequency in the WT and Pdcd1−/− (A), summary of absolute numbers of GATA3+ILC-2+ cells (B), representative flow plots showing KLRG1+ILC-2 subset frequency in WT and Pdcd1−/− mice (C), and absolute numbers of KLRG1+ ILC-2 numbers in WT and Pdcd1−/− mice (D). Functional cytokine expression was monitored using intracellular flow cytometry, and both frequency and absolute numbers were measured (E–G). Rag2−/−γc−/− mice were infected with N. brasiliensis, and then reconstituted with either WT or Pdcd1−/− KLRG1+ ILC-2 cells. Worm burden (H) and eggs in the feces (I) of host mice is shown. Black circles represent WT and gray squares represent Pdcd1−/−. Animals per cohort was n = 4–5, and data shown are mean ± SEM. Experiments were performed twice; data shown is from one repeat. A Student’s t test was performed to determine statistical significance between the various cohorts in all the panels. P ≤ 0.05 was considered significant. Significant p-values are denoted in the figures.
Figure 6.
Figure 6.
Administration of αPD-1 can significantly diminish worm burden in Rag1−/−recipients. Rag1−/− mice were treated with isotype or αPD-1 antibody (250 µg/mice), followed by rmIL-33 (200 ng/mice), for 3 d. Gating strategy included LinCD45+ Thy1+CD127+CD25+ST2+KLRG1+. Representative flow plots of ILC-2 in Isotype and αPD-1 cohorts (A) and summary of absolute numbers of KLRG1+ ILC-2 in Isotype and αPD-1 cohorts’ lungs (B) were evaluated. Rag1−/− mice were infected with 300 Larvae 3 of N. brasiliensis on day 0. Anti–mouse PD-1 antibodies or IgG isotype control were i.p. injected into mice on day 0, 3, 6, and 9, at a dose of 250 µg antibody per mouse each time. Leukocytes were isolated from MLNs on day 14, and the numbers of total ILC-2 cells were analyzed by flow cytometry (C). Cytokine expression was analyzed using intracellular flow cytometry (D and E). Feces were collected on day 7, 8, and 9 from individual mouse, and the worm eggs were counted (F). Adult worms in small intestine were counted on day 14 (G). Animals per cohort was n = 4–5. Data shown are mean ± SEM. Experiments were repeated twice. Data on n = 5 mice is shown (A–C). A Student’s t test was performed to determine statistical significance for the data shown in all the panels. P ≤ 0.05 was considered significant. Significant p-values are denoted in the figures.
Figure 7.
Figure 7.
PD-1 regulation of KLRG1+ILC-2 is conserved in human PBMCs. Human PBMCs were obtained from normal healthy volunteers and characterized for the expression of PD-1 in the various ILC subsets. Gating strategy included LinCD45+CD127+GATA3+KLRG1+ (A). PD-1 expression was analyzed in n = 5 donors (A and B). ILC-2 cells were gated as either GATA3+PD-1 or GATA3+PD-1+, and then characterized for cytokine expression (C and D). PBMCs were stimulated with rhIL-2 (1,000 IU) + Vehicle (DMSO) + Isotype control for 15 min, and then p-STAT5 expression was measured by flow cytometry. Certain cohorts were treated with rhIL-2 + Vehicle + αPD-1 or rhIL-2 + Tofacitinib (0.3 µM) + αPD-1. The representative flowplot and mean fluorescence intensity of pSTAT5 in various cohorts were measured by flow cytometry (E and F; n = 4 donors). PBMCs were labeled with Cell Trace Violet. and then ILC-2s were stimulated with rhIL-2 + rhIL-7 (40 ng/ml) + Vehicle (DMSO) + Isotype control or with rhIL-2 + rhIL-7 + Vehicle + αPD-1 or with rhIL-2 + rhIL-7 + Tofacitinib + αPD-1. Dilution of Cell Trace Violet as a measure of proliferation was performed at day 5 after stimulation (G; n = 4 donors). Experiments were performed in multiple donors as stated, and data are represented as mean + SEM. Human PBMCs (4 million) were adoptively transferred into NSG murine recipients and treated with rhIL-2, rhIL-7, and rhIL-33 for 3 d, along with Vehicle (DMSO) and Isotype control antibody. This cohort is termed as control; certain cohorts received either αPD-1 or αPD-1 and Tofacitinib, in addition to rhIL-2, rhIL-7, and rhIL-33. At day 3 after adoptive transfer, lungs were harvested and stimulated with PMA/ionomycin, and then human ILC-2 subsets were characterized. Human CD45+ cells were gated followed by CD45+Lin CD127+GATA3+KLRG1+ gating. Cytokine expression of KLRG1+ ILC-2s were evaluated in the various cohorts (H). For in vivo experiments, each cohort had n = 4 mice; data are represented as mean ± SEM. A Student’s t test was performed to determine statistical significance in C and D, and a one-way ANOVA analysis followed by a multiple comparison test [Tukey] was performed to determine statistical significance between the various cohorts in F–H. P ≤ 0.05 was considered significant. Significant p-values are denoted in the figures.

Comment in

Similar articles

Cited by

References

    1. Agata Y., Kawasaki A., Nishimura H., Ishida Y., Tsubata T., Yagita H., and Honjo T.. 1996. Expression of the PD-1 antigen on the surface of stimulated mouse T and B lymphocytes. Int. Immunol. 8:765–772. 10.1093/intimm/8.5.765 - DOI - PubMed
    1. Amarnath S., Costanzo C.M., Mariotti J., Ullman J.L., Telford W.G., Kapoor V., Riley J.L., Levine B.L., June C.H., Fong T., et al. . 2010. Regulatory T cells and human myeloid dendritic cells promote tolerance via programmed death ligand-1. PLoS Biol. 8:e1000302 10.1371/journal.pbio.1000302 - DOI - PMC - PubMed
    1. Amarnath S., Mangus C.W., Wang J.C., Wei F., He A., Kapoor V., Foley J.E., Massey P.R., Felizardo T.C., Riley J.L., et al. . 2011. The PDL1-PD1 axis converts human TH1 cells into regulatory T cells. Sci. Transl. Med. 3:111ra120 10.1126/scitranslmed.3003130 - DOI - PMC - PubMed
    1. Asseman C., Read S., and Powrie F.. 2003. Colitogenic Th1 cells are present in the antigen-experienced T cell pool in normal mice: control by CD4+ regulatory T cells and IL-10. J. Immunol. 171:971–978. 10.4049/jimmunol.171.2.971 - DOI - PubMed
    1. Barber D.L., Wherry E.J., Masopust D., Zhu B., Allison J.P., Sharpe A.H., Freeman G.J., and Ahmed R.. 2006. Restoring function in exhausted CD8 T cells during chronic viral infection. Nature. 439:682–687. 10.1038/nature04444 - DOI - PubMed

Publication types

MeSH terms