. 2017 Jul;58(7):1439-1452.
doi: 10.1194/jlr.M076745. Epub 2017 May 10.

Inhibiting glucosylceramide synthase exacerbates cisplatin-induced acute kidney injury

Affiliations

Inhibiting glucosylceramide synthase exacerbates cisplatin-induced acute kidney injury

Tess V Dupre et al. J Lipid Res. 2017 Jul.

Abstract

Acute kidney injury (AKI), resulting from chemotherapeutic agents such as cisplatin, remains an obstacle in the treatment of cancer. Cisplatin-induced AKI involves apoptotic and necrotic cell death, pathways regulated by sphingolipids such as ceramide and glucosylceramide. Results from this study indicate that C57BL/6J mice treated with cisplatin had increased ceramide and hexosylceramide levels in the renal cortex 72 h following cisplatin treatment. Pretreatment of mice with inhibitors of acid sphingomyelinase and de novo ceramide synthesis (amitriptyline and myriocin, respectively) prevented accumulation of ceramides and hexosylceramide in the renal cortex and protected from cisplatin-induced AKI. To determine the role of ceramide metabolism to hexosylceramides in kidney injury, we treated mice with a potent and highly specific inhibitor of glucosylceramide synthase, the enzyme responsible for catalyzing the glycosylation of ceramides to form glucosylceramides. Inhibition of glucosylceramide synthase attenuated the accumulation of the hexosylceramides and exacerbated ceramide accumulation in the renal cortex following treatment of mice with cisplatin. Increasing ceramides and decreasing glucosylceramides in the renal cortex sensitized mice to cisplatin-induced AKI according to markers of kidney function, kidney injury, inflammation, cell stress, and apoptosis. Under conditions of high ceramide generation, data suggest that metabolism of ceramides to glucosylceramides buffers kidney ceramides and helps attenuate kidney injury.-Dupre, T. V., M. A. Doll, P. P. Shah, C. N. Sharp, D. Siow, J. Megyesi, J. Shayman, A. Bielawska, J. Bielawski, L. J. Beverly, M. Hernandez-Corbacho, C. J. Clarke, A. J. Snider, R. G. Schnellmann, L. M. Obeid, Y. A. Hannun, and L. J. Siskind. Inhibiting glucosylceramide synthase exacerbates cisplatin-induced acute kidney injury. J. Lipid Res 2017. 58: 1439-1452.

Keywords: apoptosis; ceramide; inflammation; sphingolipids.


Figures

Fig. 1.
Fig. 1.
Schematic of inhibitors of sphingolipid metabolism utilized in this study. GSL, glycosphingolipid.
Fig. 2.
Fig. 2.
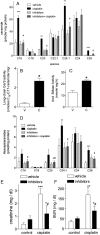
Cisplatin treatment induces ceramide generation and inhibition of ceramide generation protects from cisplatin-induced AKI. A, D–F: Mice were pretreated with myriocin (0.3 mg/kg ip/day) and amitriptyline (1 mM given in the drinking water) for 3 days prior to an intraperitoneal injection of cisplatin (30 mg/kg, ip). A: Long- and very long-chain ceramides were quantified by HPLC-MS/MS in the kidney cortex of C57BL/6 mice 24 h following intraperitoneal injection with 25 mg/kg cisplatin. B: Long-chain CerS activity was measured 72 h following cisplatin administration (30 mg/kg) in the renal cortex. C: aSMase activity was measured 72 h following cisplatin administration (30 mg/kg) in the renal cortex. D: Long- and very long-chain glucosylceramides were quantified by HPLC-MS/MS in the kidney cortex of C57BL/6 mice 24 h following intraperitoneal injection with 25 mg/kg cisplatin. SCr (F) and BUN (G) were measured 72 h following administration of cisplatin or in mice injected with vehicle. Statistical differences were measured by two-way ANOVA followed by Bonferroni posttest. Data are expressed as mean ± SEM (n = 5). *P < 0.05, **P < 0.01, and ***P < 0.001 demonstrate statistical difference from vehicle treatment. #P < 0.05 demonstrates statistical difference from cisplatin treatment.
Fig. 3.
Fig. 3.
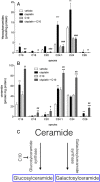
C10 and cisplatin cotreatment alters sphingolipid levels. At 0 h, C57BL/6J mice were treated with cisplatin (25 mg/kg, ip) and C10 (20 mg/kg, oral gavage). C10 treatment was continued every 12 h for 48 h. Mice were euthanized 72 h following cisplatin treatment. A: Long- and short-chain glucosylceramides were quantified by HPLC-MS/MS in the kidney cortex of C57BL/6 mice 24 h following intraperitoneal injection with 25 mg/kg cisplatin. B: Long- and short-chain ceramides were quantified by HPLC-MS/MS in the kidney cortex of C57BL/6 mice 24 h following intraperitoneal injection with 25 mg/kg cisplatin. C: Schematic of hexosylceramide synthesis. Ceramide is glycosylated by either glucosylceramide synthase or galactosylceramide synthase to generate glucosylceramide and galactosylceramide, respectively. Glucosylceramide and galactosylceramide are collectively referred to as hexosylceramides. Statistical differences were measured by two-way ANOVA followed by Bonferroni posttest. Data are expressed as mean ± SEM (n = 5). *P < 0.05, **P < 0.01, and ***P < 0.001 demonstrate statistical difference from vehicle treatment. #P < 0.05 demonstrates statistical difference from cisplatin treatment.
Fig. 4.
Fig. 4.
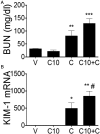
Cotreatment with C10 exacerbates cisplatin-induced kidney injury. At 0 h, C57BL/6J mice were treated with cisplatin (25 mg/kg, ip) and C10 (20 mg/kg, oral gavage). C10 treatment was continued every 12 h for 48 h. Mice were euthanized 72 h following cisplatin treatment. A: Levels of BUN were assessed via colorimetric assay. B: mRNA expression of KIM-1 in the kidney cortex was assessed via real-time quantitative (q)RT-PCR (n = 5–10); data are expressed as mean ± SEM. *P ≤ 0.05 as compared with cisplatin-treated group as determined by two-way ANOVA. V, vehicle control; C10, C10-only treatment; C, cisplatin intraperitoneally at 25 mg/kg; C10+C, cisplatin and C10 cotreatment. Statistical differences were measured by two-way ANOVA followed by Bonferroni posttest. Data are expressed as mean ± SEM (n = 5–10). *P < 0.05, **P < 0.01, and ***P < 0.001 demonstrate statistical difference from vehicle treatment. #P < 0.05 demonstrates statistical difference from cisplatin treatment.
Fig. 5.
Fig. 5.
C10 worsens cisplatin-induced deterioration in kidney pathology. At 0 h, C57BL/6J mice were treated with cisplatin (25 mg/kg, ip) and C10 (20 mg/kg, oral gavage). C10 treatment was continued every 12 h for 48 h. Mice were euthanized 72 h following cisplatin treatment. Renal histological changes were assessed on H&E- and PAS-stained sections 5 μm thick. A: Representative images of renal histology at 200× magnification. Tubule necrosis (B), loss of proximal tubule brush borders (C), proximal tubule cast formation (D), proximal tubule dilation (E), and degeneration (F) were assessed as markers of histological changes. For (B–F), scoring of the sections was performed in a blinded manner, using a scale of 0–4 (0 = not present, 1 = mild, 2 = moderate, 3 = severe, and 4 = very severe renal histological changes in the proximal tubules). Statistical differences were measured by two-way ANOVA followed by Bonferroni posttest. Data are expressed as mean ± SEM (n = 5–10). *P < 0.05 and **P < 0.01 demonstrate statistical difference from vehicle treatment. See the Fig. 4 legend for an explanation of the abbreviations.
Fig. 6.
Fig. 6.
C10 treatment exacerbates inflammation in the kidney following cisplatin treatment. At 0 h, C57BL/6J mice were treated with cisplatin (25 mg/kg, ip) and C10 (20 mg/kg, oral gavage). C10 treatment was continued every 12 h for 48 h. Mice were euthanized 72 h following cisplatin treatment. Relative expression of TNF-α (A), IL-6 (B), MCP-1 (C), and CXCL1 (D) were measured via real-time qRT-PCR. Statistical differences were measured by two-way ANOVA followed by Bonferroni posttest. Data are expressed as mean ± SEM (n = 5–10). *P < 0.05, **P < 0.01, ***P < 0.001, and ****P < 0.0001 demonstrate statistical difference from vehicle treatment. #P < 0.05 demonstrates statistical difference from cisplatin treatment. See the Fig. 4 legend for an explanation of the abbreviations.
Fig. 7.
Fig. 7.
Inhibition of glucosylceramide synthesis does not attenuate cisplatin-induced increases in proliferation. At 0 h, C57BL/6J mice were treated with cisplatin (25 mg/kg, ip) and C10 (20 mg/kg, oral gavage). C10 treatment was continued every 12 h for 48 h. Mice were euthanized 72 h following cisplatin treatment. A: Western blot analysis was performed to assess relative protein levels of PCNA in the renal cortex of mice. B: Representative photomicrographs of PCNA/LTA immunohistochemistry (200× final magnification). PCNA-positive cells are reddish brown in color, while LTA-positive tubules are black. C: PCNA quantification. Statistical differences were measured by two-way ANOVA followed by Bonferroni posttest. Data are expressed as mean ± SEM (n = 5–10). *P < 0.05 demonstrates statistical difference from vehicle treatment. See the Fig. 4 legend for an explanation of the abbreviations.
Fig. 8.
Fig. 8.
C10 cotreatment increases cisplatin-induced apoptosis. At 0 h, C57BL/6J mice were treated with cisplatin (25 mg/kg, ip) and C10 (20 mg/kg, oral gavage). C10 treatment was continued every 12 h for 48 h. Mice were euthanized 72 h following cisplatin treatment. A: Western blot analysis was performed to assess relative protein levels of cleaved caspase 8 and cleaved caspase 3 in the renal cortex of mice. B: Representative photomicrographs of TUNEL immunofluorescence (200× final magnification). C: TUNEL quantification. Statistical differences were measured by two-way ANOVA followed by Bonferroni posttest. Data are expressed as mean ± SEM (n = 5–10). *P < 0.05, **P < 0.01, ***P < 0.001, and ****P < 0.0001 demonstrate statistical difference from vehicle treatment. #P < 0.05 demonstrates statistical difference from cisplatin treatment. See the Fig. 4 legend for an explanation of the abbreviations.
Fig. 9.
Fig. 9.
I/R of the kidneys alters the activity of sphingolipid metabolic enzymes, ceramides, and hexosylceramides in the kidney cortex. Mice were either sham operated or subjected to bilateral kidney I/R. Kidney cortex long-chain CerS activity (A), aSMase activity (B), ceramide species (C), and hexosylceramide species (D) were measured at the peak of kidney injury 24 h following I/R. Data are expressed as mean ± SEM (n = 5). *P < 0.05, **P < 0.01, ***P < 0.001, and ****P < 0.0001 demonstrate statistical difference from vehicle treatment.
Fig. 10.
Fig. 10.
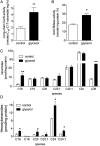
The activity of sphingolipid metabolic enzymes, ceramides, and hexosylceramides in the kidney cortex are increased in a rat model of rhabdomyolysis. The quadriceps muscle of rats was injected with 1 ml PBS (control) or glycerol. Kidney cortex long-chain CerS activity (A), aSMase activity (B), ceramide species (C), and hexosylceramide species (D) were measured at the peak of kidney injury 24 h following injection. Data are expressed as mean ± SEM (n = 5). *P < 0.05, **P < 0.01, ***P < 0.001, and ****P < 0.0001 demonstrate statistical difference from vehicle treatment.

References

    1. Bellomo R., Kellum J. A., and Ronco C.. 2012. Acute kidney injury. Lancet. 380: 756–766. - PubMed
    1. Liangos O., Wald R., O’Bell J. W., Price L., Pereira B. J., and Jaber B. L.. 2006. Epidemiology and outcomes of acute renal failure in hospitalized patients: a national survey. Clin. J. Am. Soc. Nephrol. 1: 43–51. - PubMed
    1. Bagshaw S. M., George C., Bellomo R., and Committee A. D. M.. 2008. Early acute kidney injury and sepsis: a multicentre evaluation. Crit. Care. 12: R47. - PMC - PubMed
    1. Singri N., Ahya S. N., and Levin M. L.. 2003. Acute renal failure. JAMA. 289: 747–751. - PubMed
    1. Pabla N., and Dong Z.. 2008. Cisplatin nephrotoxicity: mechanisms and renoprotective strategies. Kidney Int. 73: 994–1007. - PubMed

Publication types

LinkOut - more resources