. 2017 Jun 1;312(6):R973-R981.
doi: 10.1152/ajpregu.00511.2016. Epub 2017 May 10.

Evidence for intraventricular secretion of angiotensinogen and angiotensin by the subfornical organ using transgenic mice

Affiliations

Evidence for intraventricular secretion of angiotensinogen and angiotensin by the subfornical organ using transgenic mice

Khristofor Agassandian et al. Am J Physiol Regul Integr Comp Physiol. .

Abstract

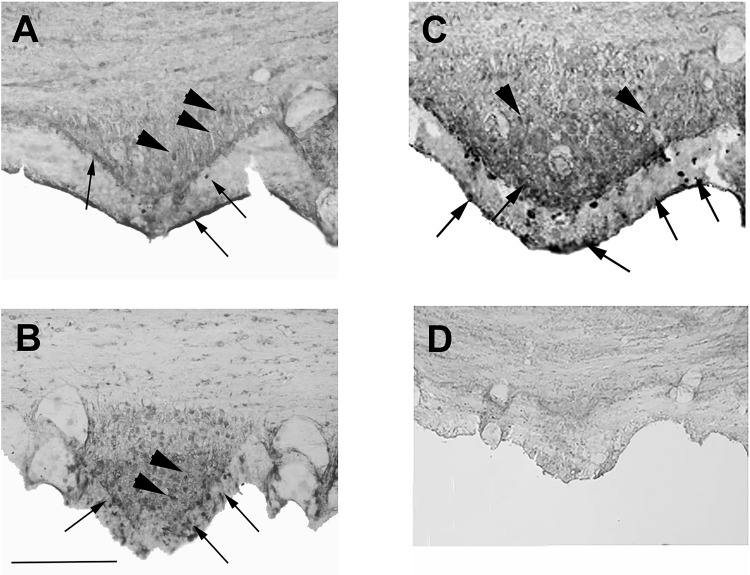
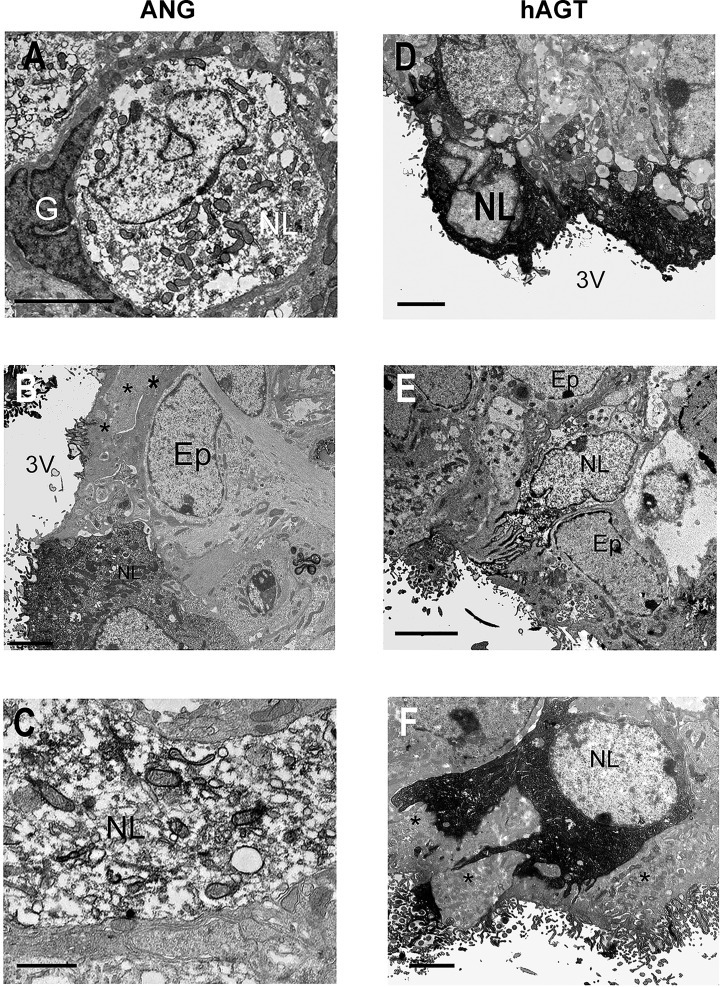
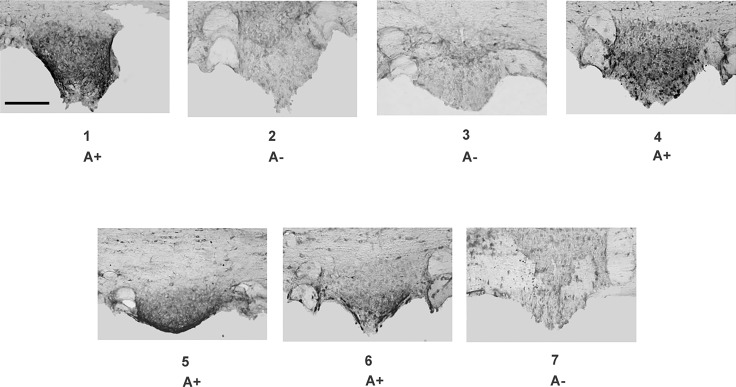
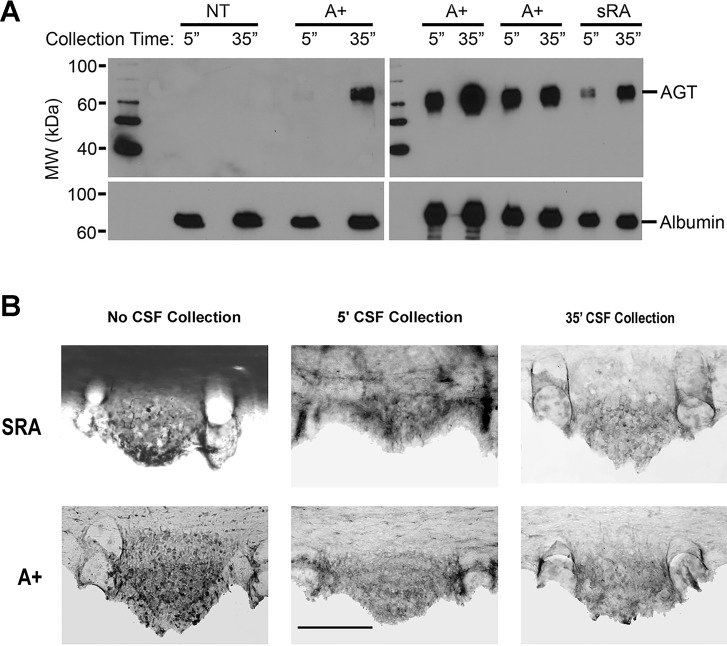
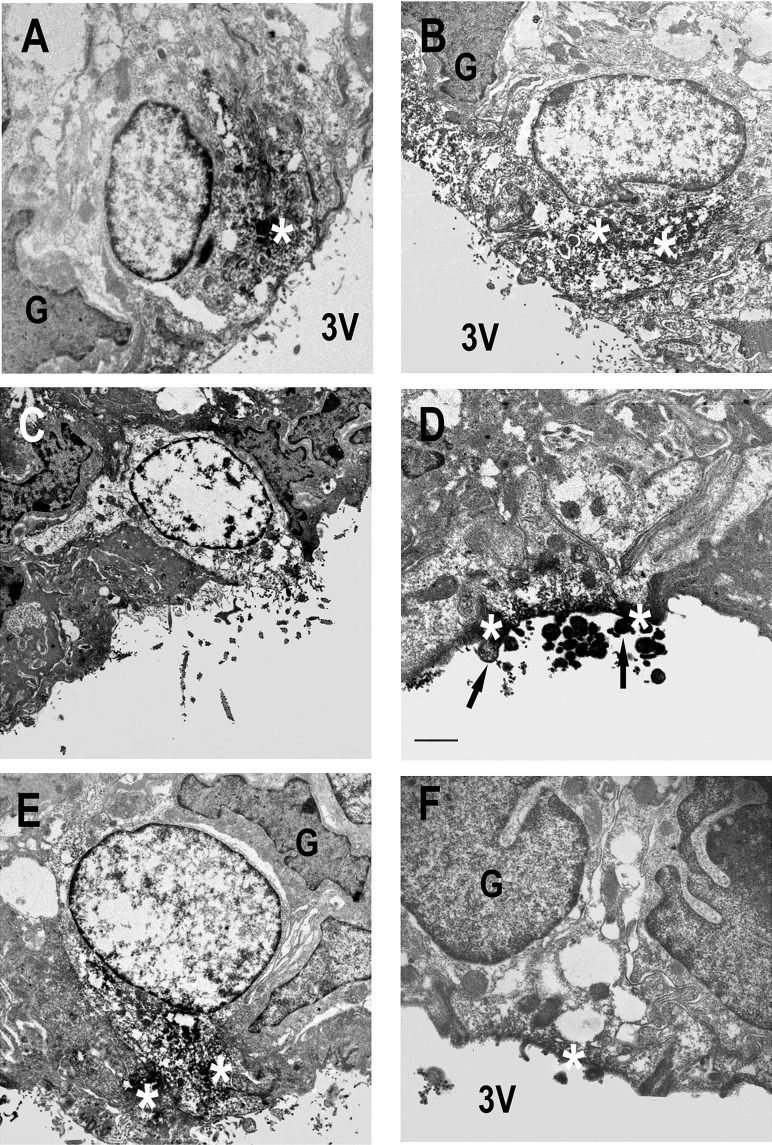
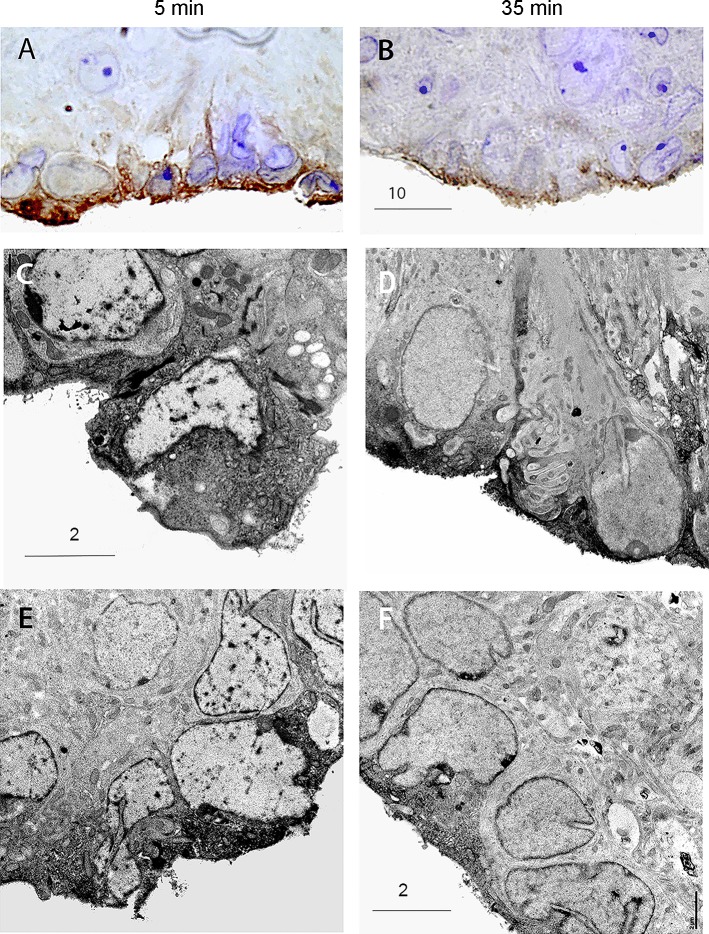
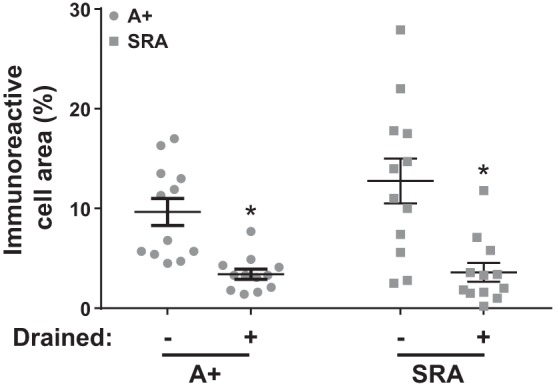
Direct intracerebroventricular injection of angiotensin II (ANG II) causes increases in blood pressure and salt and water intake, presumably mimicking an effect mediated by an endogenous mechanism. The subfornical organ (SFO) is a potential source of cerebrospinal fluid (CSF), ANG I, and ANG II, and thus we hypothesized that the SFO has a secretory function. Endogenous levels of angiotensinogen (AGT) and renin are very low in the brain. We therefore examined the immunohistochemical localization of angiotensin peptides and AGT in the SFO, and AGT in the CSF in two transgenic models that overexpress either human AGT (A+ mice), or both human AGT (hAGT) and human renin (SRA mice) in the brain. Measurements were made at baseline and following volumetric depletion of CSF. Ultrastructural analysis with immunoelectron microscopy revealed that superficially located ANG I/ANG II and AGT immunoreactive cells in the SFO were vacuolated and opened directly into the ventricle. Withdrawal of CSF produced an increase in AGT in the CSF that was accompanied by a large decline in AGT immunoreactivity within SFO cells. Our data provide support for the hypothesis that the SFO is a secretory organ that releases AGT and possibly ANG I/ANG II into the ventricle at least under conditions when genes that control the renin-angiotensin system are overexpressed in mice.

Keywords: angiotensinogen; cerebrospinal fluid; secretion; subfornical organ; transgenic mice.


Figures

Fig. 1.
Fig. 1.
Light microscopy of angiotensin (ANG) peptides in the subfornical organ (SFO). Immunostained coronal sections through the SFO of a nontransgenic (NT) mouse (A), a mouse with overexpression of the human angiotensinogen (hAGT) gene (B), and a mouse with overexpression of hAGT gene and a human renin gene under a synapsin promoter (C and D). The section in A was stained with an anti-ANG I/II antibody (sc7419) that detects AGT as well, whereas the sections in B and C were stained with an anti-hAGT antibody. Note the general increase in intensity of immunochemical reaction product in the A+ and SRA animals overexpressing the human genes. Immunoreactive neurons (arrowheads) can be seen in the central part of the SFO as can neuron-like cells in the periphery and within and beneath the ependyma layer (arrows). The section in D was processed using antibody sc7419 preabsorbed with angiotensin II. Scale bar in B = 100 μm (it also applies to A and C).
Fig. 2.
Fig. 2.
Electron microscopic localization of ANG peptides and hAGT in SFO. Ultrastructural appearance of ANG peptide (A–C) and hAGT (D–F) cell immunoreactivity in the SFO in NT (A and B), A+ (E), and SRA (C, D, and F) mice. ANG peptide immunoreactivity was fairly sparsely distributed in the perikarya (A) and dendrites (C) of neuron-like (NL) cells in both NT (A) and transgenic (C) animals. In contrast, more superficially located neuron-like cells exhibited stronger immunoreactivity (D and F). Immunoreactive cell processes could be observed passing between ependymal cell (Ep) processes (* in F) to the surface of the third ventricle (3V). Note the absence of ANG peptide and hAGT immunoreactivity in glia (G) and Ep cells adjacent to immunoreactive NL cells (A, B, and F). Scale bars A and C–F = 2 μm; scale bar B = 0.5 μm.
Fig. 3.
Fig. 3.
AGT in SFO. Immunohistochemistry of hAGT expression in SFO of seven littermates of an A+ × C57 breeding (A+ and A mice). The littermate animals were not identified before immunohistochemistry, and sections from different animals were developed in the same vial with the same concentration of antibody. Scale bar = 100 μm for all panels.
Fig. 4.
Fig. 4.
Human AGT in cerebrospinal fluid (CSF) 5 and 35 min after collection. A: Western blot of hAGT in CSF collected from A+, NT, and SRA animals 5 and 35 min after cannulation of the cisterna magna. The increased release of hAGT into the CSF of A+ and SRA mice after CSF withdrawal is clearly shown. B: hAGT immunoreactivity in SFO of SRA and A+ mice with and without CSF collection. hAGT immunoreactivity in SFO of SRA and A+ mice after 5 min CSF collection shows a decline from animals with no CSF withdrawal. After 35 min of withdrawal, an almost complete depletion of hAGT immunoreactivity in the superficial part of the SFO of SRA and A+ is evident.
Fig. 5.
Fig. 5.
Localization of ANG and AGT immunoreactivity near the ventricular surface. Superficial cells of SFO from NT (A and B), A+ (C), and SRA (D–F) mice showing accumulation of ANG peptide (A and B) and hAGT (C–F) immunoreactivity (white *) at the ventricular surface after 35 min of CSF withdrawal. The presence of reaction product in microvilli (arrows in D) is clearly shown. Scale bars in A–C and E = 2 μm; scale bar in D = 0.5 μm; scale bar in F = 1 μm.
Fig. 6.
Fig. 6.
Immunocytochemical detection of synaptobrevin-2 (VAMP2) in SFO. Immunocytochemical detection of VAMP2 immunoreactivity in SFO after 5 min (A, C, and E) and after 35 min (B, D, and F) of CSF withdrawal. Note the shift in VAMP2 immunoreactivity to the surface following 35 min of CSF withdrawal and the similar morphology of immunoreactive cells to those in Figs. 2 and 5. Scale bars are as indicated in the figure (in μm).
Fig. 7.
Fig. 7.
Quantification of ANG I/II/AGT immunoreactivity. Changes in ANG I/II/AGT immunoreactivity as a percentage of cell fragment area before and after CSF withdrawal. *P < 0.05 vs. undrained genotype P = 0.129, CSF withdrawal P < 0.001, interaction P = 0.179. Sample size was n = 12 per group. Two-way ANOVA with Tukey’s multiple comparison test.

References

    1. Allersma MW, Wang L, Axelrod D, Holz RW. Visualization of regulated exocytosis with a granule-membrane probe using total internal reflection microscopy. Mol Biol Cell 15: 4658–4668, 2004. doi:10.1091/mbc.E04-02-0149. - DOI - PMC - PubMed
    1. Avrith DB, Fitzsimons JT. Increased sodium appetite in the rat induced by intracranial administration of components of the renin-angiotensin system. J Physiol 301: 349–364, 1980. doi:10.1113/jphysiol.1980.sp013210. - DOI - PMC - PubMed
    1. Bryant RW, Epstein AN, Fitzsimons JT, Fluharty SJ. Arousal of a specific and persistent sodium appetite in the rat with continuous intracerebroventricular infusion of angiotensin II. J Physiol 301: 365–382, 1980. doi:10.1113/jphysiol.1980.sp013211. - DOI - PMC - PubMed
    1. Chiaraviglio E. Effect of renin-angiotensin system on sodium intake. J Physiol 255: 57–66, 1976. doi:10.1113/jphysiol.1976.sp011269. - DOI - PMC - PubMed
    1. Coble JP, Cassell MD, Davis DR, Grobe JL, Sigmund CD. Activation of the renin-angiotensin system, specifically in the subfornical organ is sufficient to induce fluid intake. Am J Physiol Regul Integr Comp Physiol 307: R376–R386, 2014. doi:10.1152/ajpregu.00216.2014. - DOI - PMC - PubMed

MeSH terms

LinkOut - more resources