. 2017 May 23;114(21):5455-5460.
doi: 10.1073/pnas.1611506114. Epub 2017 May 10.

Entropic forces drive self-organization and membrane fusion by SNARE proteins

Affiliations

Entropic forces drive self-organization and membrane fusion by SNARE proteins

Hakhamanesh Mostafavi et al. Proc Natl Acad Sci U S A. .

Abstract

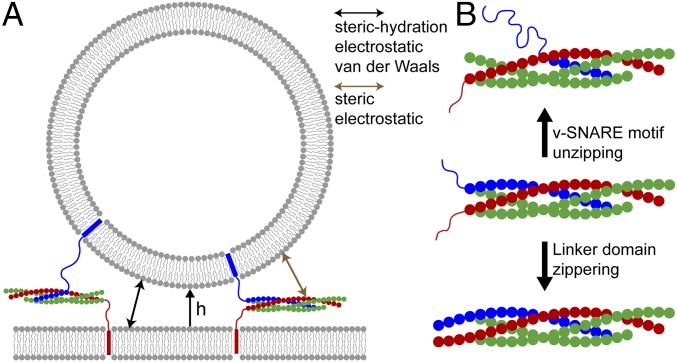
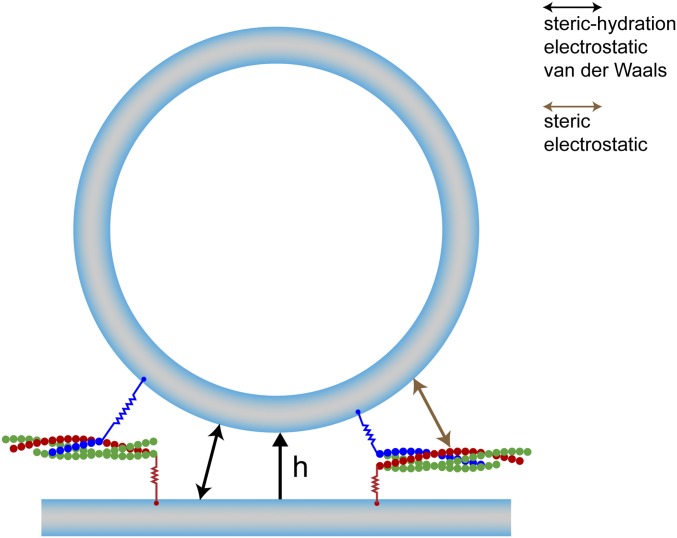
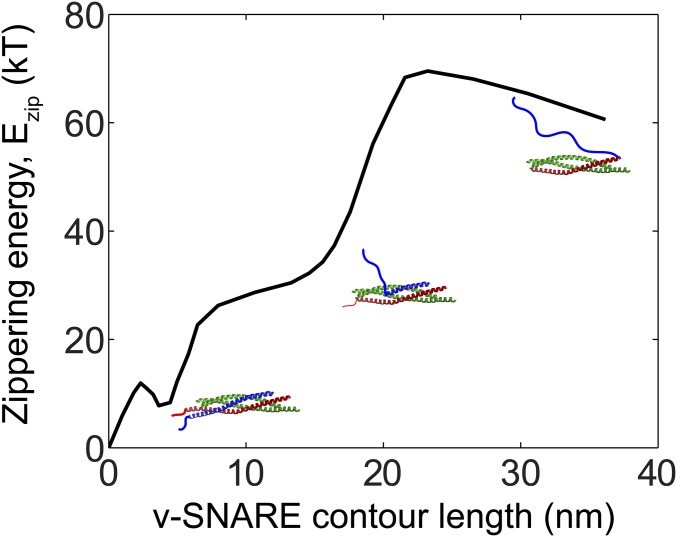
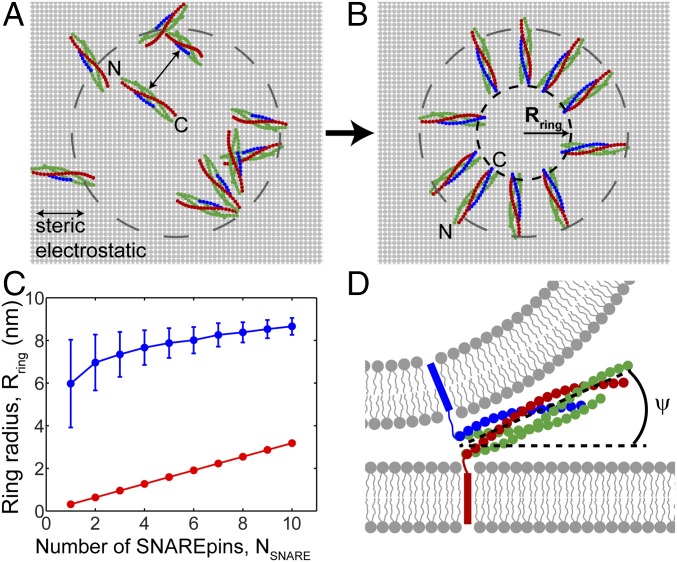
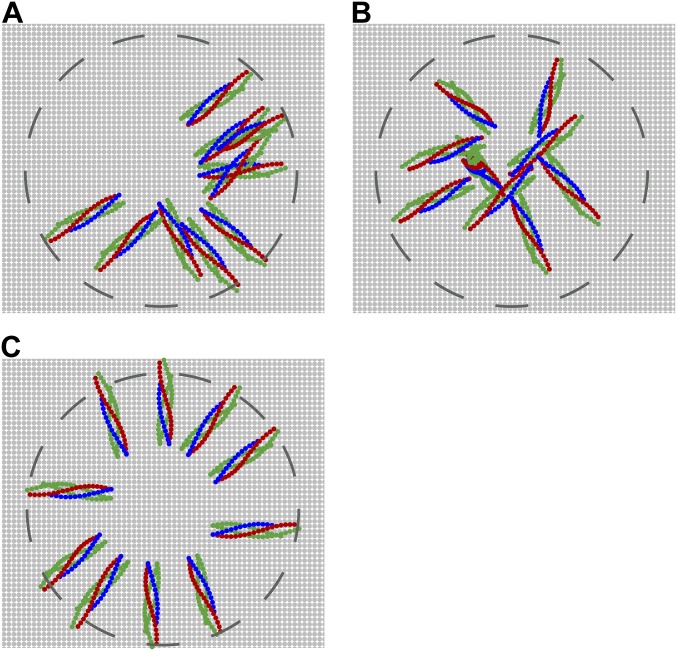
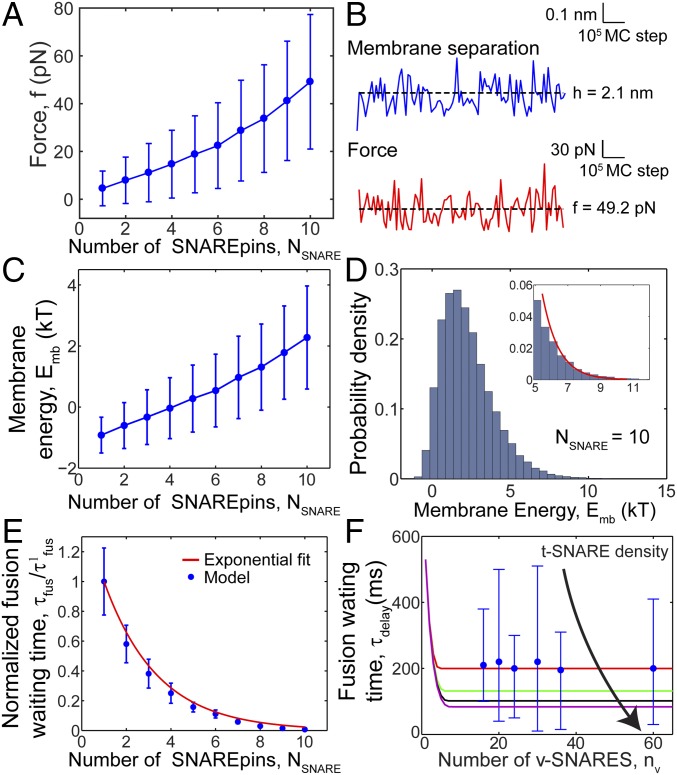
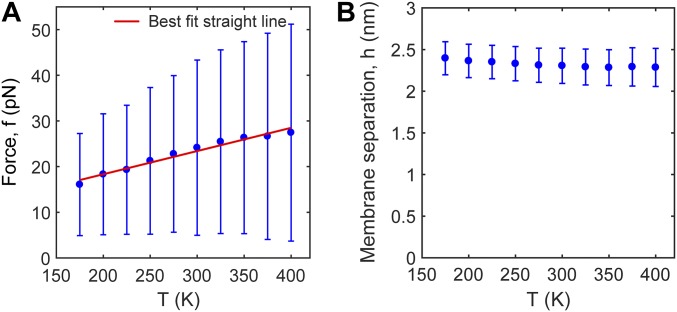
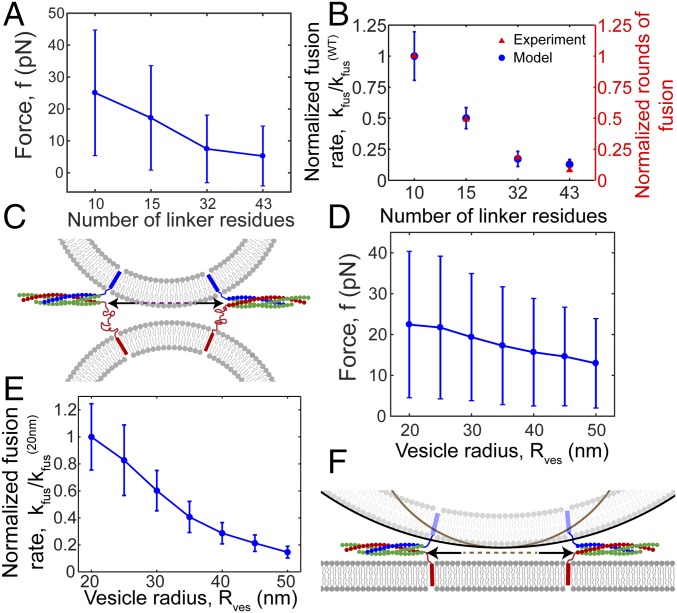
SNARE proteins are the core of the cell's fusion machinery and mediate virtually all known intracellular membrane fusion reactions on which exocytosis and trafficking depend. Fusion is catalyzed when vesicle-associated v-SNAREs form trans-SNARE complexes ("SNAREpins") with target membrane-associated t-SNAREs, a zippering-like process releasing ∼65 kT per SNAREpin. Fusion requires several SNAREpins, but how they cooperate is unknown and reports of the number required vary widely. To capture the collective behavior on the long timescales of fusion, we developed a highly coarse-grained model that retains key biophysical SNARE properties such as the zippering energy landscape and the surface charge distribution. In simulations the ∼65-kT zippering energy was almost entirely dissipated, with fully assembled SNARE motifs but uncomplexed linker domains. The SNAREpins self-organized into a circular cluster at the fusion site, driven by entropic forces that originate in steric-electrostatic interactions among SNAREpins and membranes. Cooperative entropic forces expanded the cluster and pulled the membranes together at the center point with high force. We find that there is no critical number of SNAREs required for fusion, but instead the fusion rate increases rapidly with the number of SNAREpins due to increasing entropic forces. We hypothesize that this principle finds physiological use to boost fusion rates to meet the demanding timescales of neurotransmission, exploiting the large number of v-SNAREs available in synaptic vesicles. Once in an unfettered cluster, we estimate ≥15 SNAREpins are required for fusion within the ∼1-ms timescale of neurotransmitter release.

Keywords: SNARE; entropic force; exocytosis; membrane fusion; neurotransmitter release.


Conflict of interest statement

The authors declare no conflict of interest.

Figures

Fig. 1.
Fig. 1.
Coarse-grained model of SNAREpins at the fusion site. (A) NSNARE SNAREpins bridge a vesicle and planar membrane with minimum separation h (only two SNAREpins shown). t-SNARE motifs (red and green) are zippered, whereas VAMP motif (blue) can have any degree of zippering. Zippering obeys energy landscape measured in ref. (Fig. S2). TMDs are mobile in the membranes and SNARE complexes have arbitrary orientation consistent with steric constraints. SNAREpins interact with one another, and with membrane surfaces, through steric-electrostatic forces. Membranes are continuous fixed-shape surfaces, interacting via steric-hydration, electrostatic, and van der Waals forces. (B) SNARE coarse-graining scheme. The SNARE complex is a coiled coil of four α-helices, VAMP (one, blue), syntaxin (one, red), and SNAP-25 (two, green). Structured helices are represented as beads. A bead carries the charges of its residues (approximately four structured residues per bead) and represents the contribution of one helix to one of the 16 layers of the SNARE complex (30, 31). Uncomplexed segments are unstructured worm-like chains. (Middle) Fully assembled SNARE motifs, uncomplexed LDs. Relative to this state v-SNARE unzipping (Top) or LD zippering (Bottom) can occur.
Fig. S1.
Fig. S1.
Coarse-grained model of SNAREpins and membranes. NSNARE SNAREpins bridge a vesicle and planar membrane with minimum separation h (only two SNAREpins shown). t-SNARE motifs (red and green) are zippered, whereas the VAMP motif (blue) can have any degree of zippering. Zippering follows the energy landscape measured in ref. (Fig. S2). SNARE complexes have arbitrary orientation consistent with steric constraints. TMDs are represented as attachment points 1 nm below the membrane surfaces and are laterally mobile. Their position is set to minimize the stretching energy of the unstructured domains. SNAREpins interact with one another, and with the membrane surfaces, through steric-electrostatic forces. Membranes are continuous fixed-shape surfaces, interacting via steric-hydration, electrostatic, and van der Waals forces.
Fig. S2.
Fig. S2.
Energy landscape for SNARE zippering, generated from measurements by Gao et al. (7). The zippering energy of neuronal SNAREs is shown as a function of the length of the uncomplexed portion of the v-SNARE (VAMP, blue), with the zero energy state defined to be the completely zippered state including complexed LDs. In ref. the reaction coordinate was taken as the SNARE complex contour length. This coordinate was converted to the contour length of the uncomplexed portion of the v-SNARE, assuming that the SNARE complex contour length is the sum of the contour lengths of the uncomplexed portions of VAMP and syntaxin and the SNARE complex thickness.
Fig. 2.
Fig. 2.
SNAREpins fully assemble and self-organize into a ring at the fusion site. Model parameter values as in Table S1, vesicle diameter 40 nm. (A) MC simulation, typical initial configuration. Half-zippered, randomly configured SNAREpins (top view, 10 SNAREpins). Dashed circle: projection of 40-nm diameter vesicle. (B) Typical configuration after equilibration. Independently of initial condition, SNARE motifs fully zipper and SNAREpins self-organize into a ring with inner radius Rring. (C) Equilibrium SNAREpin ring radius versus number of SNAREpins, NSNARE (blue), mean ± SD (averaged over ∼106 MC steps). For comparison, the minimum possible radius is shown for each value of NSNARE (red), corresponding to shoulder-to-shoulder packing of the C-terminal SNAREpin ends. (D) Schematic of a typical side view of a SNAREpin belonging to an equilibrated ring of 10 SNAREpins. SNARE motifs fully assemble and LDs are unzipped. SNAREpins angle upward, with a mean angle ψ14° relative to the planar membrane, which increases with the number of SNAREpins (Fig. S4B).
Fig. S3.
Fig. S3.
Model parameters used to label a state of the SNARE–membrane system. (A) Side view of a SNAREpin bridging a vesicle and a planar membrane. h, membrane separation. n, number of uncomplexed VAMP residues. ψ, angle between the SNARE bundle and its projection on the planar membrane. z, vertical distance between the center of the +8 layer of the complex and the planar membrane. (B) Projection of a SNARE bundle on the planar membrane. ρ and ϕ denote, respectively, the radial and azimuthal angular coordinates of the center of the +8 layer of the complex. The origin of the cylindrical coordinates is on the target membrane (planar membrane or vesicle) at the point of closest approach to the vesicle. θ denotes the angle between ρ^ at the center of the +8 layer and the axis of the projected SNARE bundle. C and N denote the C-terminal and N-terminal ends of the SNAREpin, respectively.
Fig. S4.
Fig. S4.
Roughness of a SNAREpin ring, orientation of a SNAREpin, and zippering degree: dependence on number of SNAREpins. Model results, based on 106 MC step simulation per plotted point. Parameters as in Table S1, 40-nm-diameter vesicle. Plotted points are mean ± SD. (A) Equilibrium SNAREpin ring roughness, defined as the rms relative deviations δRring/Rring of locations of the SNAREpin C-terminal ends from a perfect inner circle, versus number of SNAREpins. (B) Angle made by a SNARE bundle with its projection on the planar membrane, ψ (Fig. S3) versus number of SNAREpins. (C) Number of uncomplexed v-SNARE residues versus number of SNAREpins.
Fig. S5.
Fig. S5.
Contributions to the energy of a SNAREpin cluster and the membranes bridged by the cluster as a function of cluster size. Model results, based on 5×10⁵ MC step simulations per plotted point. Parameters as in Table S1. Results are for a 20-nm-radius vesicle and a planar membrane, bridged by six SNAREpins. Plotted points show mean ± SD of the total energy. To reveal the dependence of different energy contributions versus ring size, for each value of Rring the simulation was run with the constraint that the inner ring radius was equal to Rring, that is, the radial location of the C-terminal ends of the SNAREpins was fixed (Fig. 2B). (A and B) The interaction energies between SNAREpins (A) and between SNAREpins and membranes (B) are electrostatic and steadily decrease with increasing ring size. This reflects the increased entropy of larger rings, in which the separation between SNAREpins and between SNAREpins and membranes is greater. The greater mean separation implies less contact time and consequently lower electrostatic energy. (C) Membrane energy, by contrast, increases as the membranes are forced closer together with increasing ring radius (Fig. 3 B and C). (D) The stretching energy of the LDs initially decreases with ring size due to decreasing SNAREpin–membrane electrostatic repulsions. For larger rings hydrostatic repulsions prevent the membranes from being pulled any closer, and linkers are once again significantly stretched due to the geometric constraint (Fig. 3A). (E) The total energy (sum of AD) has a minimum close to the equilibrium ring size for six SNAREpins, ∼8 nm (Fig. 2C).
Fig. 3.
Fig. 3.
Entropic forces expand SNAREpin rings and pull membranes together. (A) SNAREpin rings expand entropically (right-pointing arrow), due to steric-electrostatic inter-SNAREpin and SNAREpin–membrane interactions (schematic). Entropy favors the expanded ring because SNAREpins are more spaced and, on account of vesicle curvature, have greater polar angular orientational entropy (Right). Since the vesicle has curvature and linker lengths are almost constant, ring expansion is geometrically coupled to reduced membrane separation so that the vesicle exerts force on the planar membrane (downward-pointing arrow). (B) Fluctuations in ring size and membrane separation are strongly correlated. MC simulation of a 10-SNAREpin ring, ∼106 MC moves. Model parameters as in Table S1, vesicle diameter 40 nm. Bin width: 0.1 nm. Mean ± SD. (C) Mean membrane separation decreases as mean ring size increases. Each point shows mean values for a 106 MC step simulation with a different number of SNAREpins. Model parameters and vesicle size as for B.
Fig. S6.
Fig. S6.
Self-organization of SNAREpins into circular clusters requires both SNAREpin–membrane and SNAREpin–SNAREpin interactions. Model parameter values as in Table S1. (A) Typical equilibrium snapshot of a simulation, with SNAREpin–membrane interactions switched off. Top view, 10 SNAREpins. Dashed circle shows projection of the 40-nm-diameter vesicle. (B) Typical equilibrium snapshot of a simulation with inter-SNAREpin interactions switched off. (C) Typical equilibrium snapshot of a “wild-type” simulation, with both energy terms incorporated.
Fig. 4.
Fig. 4.
Membrane force, energy, and rate of fusion increase with number of SNAREpins. Model results, based on 106 MC step simulations per plotted point. Parameters as in Table S1, vesicle diameter 40 nm. (A) Force between membranes versus number of SNAREpins. The force is the total exerted by the planar membrane on a small spherical cap of area 95nm2 centered on the vesicle contact point (SI Text). Mean values ± SD. (B) MC sequences for membrane separation (blue) and force (red) for a 10-SNAREpin ring. Dashed lines indicate mean values. (C) Membrane energy versus number of SNAREpins. Mean values ± SD. (D) Distribution of membrane energies for 10 SNAREpins. Red curve: exponential fit to tail (Emb> 5.4 kT). Bin width: 0.2 kT. (E) Predicted relative waiting time for fusion versus number of SNAREpins. Total simulation time was divided into 10 bins and waiting times were calculated for each bin. Plotted points: mean values ± SD. The best-fit exponential is e(NSNARE1)/2.1, Eq. 2 (R20.99). (F) Fusion of v-SNARE reconstituted SUVs with t-SNARE reconstituted SBLs: docking-to-fusion delay time versus number of v-SNAREs. Blue discs: experiments, ref. . Solid curves: model predictions for different SBL t-SNARE densities (red, 48 t-SNAREs/μm2, as in ref. ; green, 100 t-SNAREs/μm2; black, 150 t-SNAREs/μm2; purple, 200 t-SNAREs/μm2). In all cases, 50% of t-SNAREs were assumed mobile (24), with diffusivity DSNARE0.75μm2s1 in the SBL (47).
Fig. S7.
Fig. S7.
Mean contact force between membranes depends linearly on simulation temperature. Model results, based on 106 MC step simulations per plotted point. Parameters as in Table S1. Results are for a 20-nm-radius vesicle and a planar membrane, bridged by six SNAREpins. Forces plotted are total forces on a spherical cap, as described in Fig. 4 of main text. (A) Force between membranes versus simulation temperature. Plotted points (blue) show mean ± SD of the force. Red line is best linear fit (R20.97, P<104). (B) Membrane separation versus simulation temperature. Values are mean ± SD. The mean and the SD depend very weakly on temperature, showing that the probability distribution of membrane separations, p(h), is weakly dependent on temperature. Given that the membranes are pulled together by SNARE–membrane and membrane–membrane forces of entropic origin, the contact force will depend linearly on temperature when p(h) is independent of temperature.
Fig. 5.
Fig. 5.
Rate of fusion decreases with increasing linker length and vesicle size. Model results, based on 106 MC step simulations per plotted point. Forces are defined as in Fig. 4. Parameters as in Table S1. (A and B) Simulations of two 40-nm diameter vesicles bridged by six SNAREpins, mimicking mutant t-SNARE LD experiments of ref. . (A) Force between membranes versus number of residues in t-SNARE LDs. Mean values ± SD. (B) Fusion rates relative to wild-type rate, versus number of residues in t-SNARE LDs. Model predictions (blue discs). Total simulation time was divided into 10 bins, and waiting times were calculated for each bin. Plotted points: mean values ± SD. Experiments of ref. (red triangles): estimated number of rounds of fusion per vesicle, a measure of the rate of fusion. (C) For a given membrane separation, LD extension allows the SNAREpin ring to expand (arrows), reducing entropic forces and lowering fusion rates (schematic). Dashed line indicates inner ring diameter with wild type LDs. (D and E) Simulations of vesicle and planar membrane bridged by six SNAREpins. (D) Force versus vesicle radius. Mean values ± SD. (E) Fusion rates, relative to rate with 20-nm-radius vesicles, versus vesicle radius, determined similarly to B. (F) For a given membrane separation, a larger vesicle allows the SNAREpin ring to expand (arrows), reducing entropic forces and lowering fusion rates (schematic). Dashed line indicates inner ring diameter for the smaller vesicle.
Fig. S8.
Fig. S8.
SNAREpin ring size increases with increasing linker length or vesicle size. Model results, based on 106 MC step simulations per plotted point. Plotted points are mean ± SD. Parameters as in Table S1. (A) Ring radius versus number of residues in the t-SNARE LDs in simulations of two 20-nm-radius vesicles bridged by six SNAREpins. The conditions mimic mutant t-SNARE LD experiments of ref. . (B) Ring radius versus vesicle radius in simulations of a vesicle and planar membrane bridged by six SNAREpins.

References

    1. Söllner T, et al. SNAP receptors implicated in vesicle targeting and fusion. Nature. 1993;362:318–324. - PubMed
    1. Weber T, et al. SNAREpins: Minimal machinery for membrane fusion. Cell. 1998;92:759–772. - PubMed
    1. Jahn R, Scheller RH. SNAREs–Engines for membrane fusion. Nat Rev Mol Cell Biol. 2006;7:631–643. - PubMed
    1. Lentz BR, Lee JK. Poly(ethylene glycol) (PEG)-mediated fusion between pure lipid bilayers: A mechanism in common with viral fusion and secretory vesicle release? Mol Membr Biol. 1999;16:279–296. - PubMed
    1. Zhang Z, Jackson MB. Temperature dependence of fusion kinetics and fusion pores in Ca2+-triggered exocytosis from PC12 cells. J Gen Physiol. 2008;131:117–124. - PMC - PubMed

Publication types

LinkOut - more resources