A Genome-Wide Association Study of IVGTT-Based Measures of First-Phase Insulin Secretion Refines the Underlying Physiology of Type 2 Diabetes Variants
- PMID: 28490609
- PMCID: PMC5521867
- DOI: 10.2337/db16-1452
A Genome-Wide Association Study of IVGTT-Based Measures of First-Phase Insulin Secretion Refines the Underlying Physiology of Type 2 Diabetes Variants
Abstract
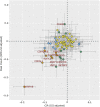
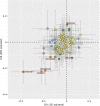
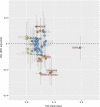
Understanding the physiological mechanisms by which common variants predispose to type 2 diabetes requires large studies with detailed measures of insulin secretion and sensitivity. Here we performed the largest genome-wide association study of first-phase insulin secretion, as measured by intravenous glucose tolerance tests, using up to 5,567 individuals without diabetes from 10 studies. We aimed to refine the mechanisms of 178 known associations between common variants and glycemic traits and identify new loci. Thirty type 2 diabetes or fasting glucose-raising alleles were associated with a measure of first-phase insulin secretion at P < 0.05 and provided new evidence, or the strongest evidence yet, that insulin secretion, intrinsic to the islet cells, is a key mechanism underlying the associations at the HNF1A, IGF2BP2, KCNQ1, HNF1B, VPS13C/C2CD4A, FAF1, PTPRD, AP3S2, KCNK16, MAEA, LPP, WFS1, and TMPRSS6 loci. The fasting glucose-raising allele near PDX1, a known key insulin transcription factor, was strongly associated with lower first-phase insulin secretion but has no evidence for an effect on type 2 diabetes risk. The diabetes risk allele at TCF7L2 was associated with a stronger effect on peak insulin response than on C-peptide-based insulin secretion rate, suggesting a possible additional role in hepatic insulin clearance or insulin processing. In summary, our study provides further insight into the mechanisms by which common genetic variation influences type 2 diabetes risk and glycemic traits.
© 2017 by the American Diabetes Association.
Figures


References
-
- Perry JR, Frayling TM. New gene variants alter type 2 diabetes risk predominantly through reduced beta-cell function. Curr Opin Clin Nutr Metab Care 2008;11:371–377 - PubMed
-
- Gjesing AP, Hornbak M, Allin KH, et al. High heritability and genetic correlation of intravenous glucose- and tolbutamide-induced insulin secretion among non-diabetic family members of type 2 diabetic patients. Diabetologia 2014;57:1173–1181 - PubMed
Publication types
MeSH terms
Substances
Grants and funding
- R01 DK093757/DK/NIDDK NIH HHS/United States
- R01 DK085175/DK/NIDDK NIH HHS/United States
- Z01 HG000024/ImNIH/Intramural NIH HHS/United States
- R01 DK072193/DK/NIDDK NIH HHS/United States
- UL1 TR000124/TR/NCATS NIH HHS/United States
- R01 HL060944/HL/NHLBI NIH HHS/United States
- P30 DK063491/DK/NIDDK NIH HHS/United States
- R01 HL061019/HL/NHLBI NIH HHS/United States
- U01 DK062370/DK/NIDDK NIH HHS/United States
- R01 HL060919/HL/NHLBI NIH HHS/United States
- P30 DK020572/DK/NIDDK NIH HHS/United States
- UL1 TR001881/TR/NCATS NIH HHS/United States
- N01 HG065403/HG/NHGRI NIH HHS/United States
- R01 HG007112/HG/NHGRI NIH HHS/United States
- R01 DK062370/DK/NIDDK NIH HHS/United States
- 230374/ERC_/European Research Council/International
LinkOut - more resources
Full Text Sources
Other Literature Sources
Medical
Research Materials

