. 2017 May 17;284(1854):20170228.
doi: 10.1098/rspb.2017.0228.

Nonlinear trade-offs allow the cooperation game to evolve from Prisoner's Dilemma to Snowdrift

Affiliations

Nonlinear trade-offs allow the cooperation game to evolve from Prisoner's Dilemma to Snowdrift

Lin Chao et al. Proc Biol Sci. .

Abstract

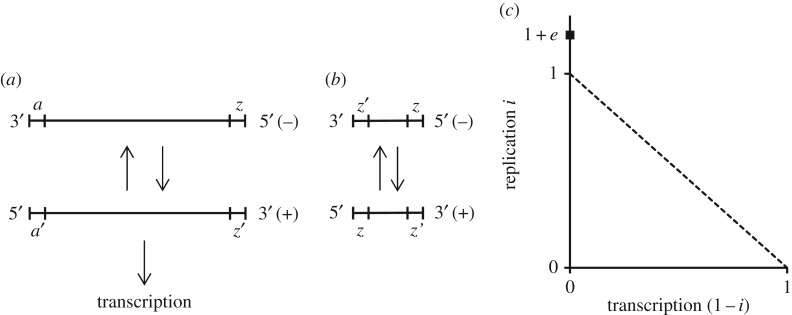
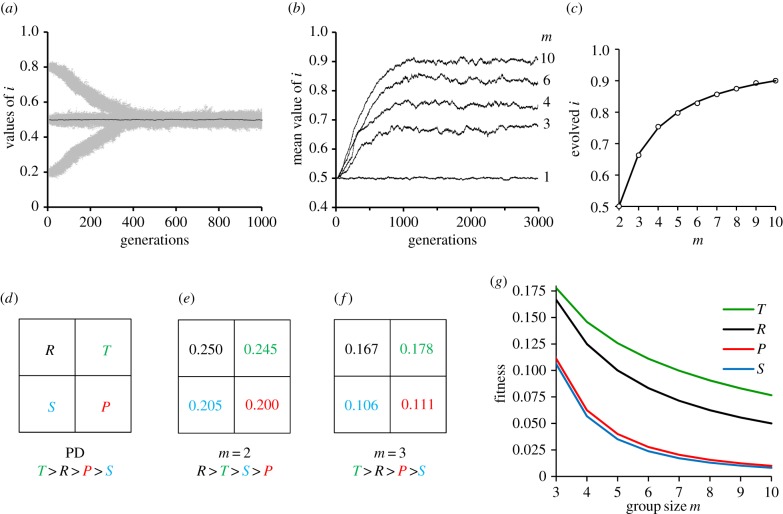
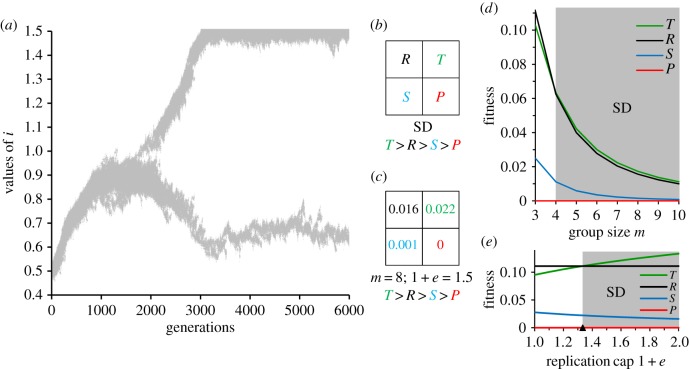
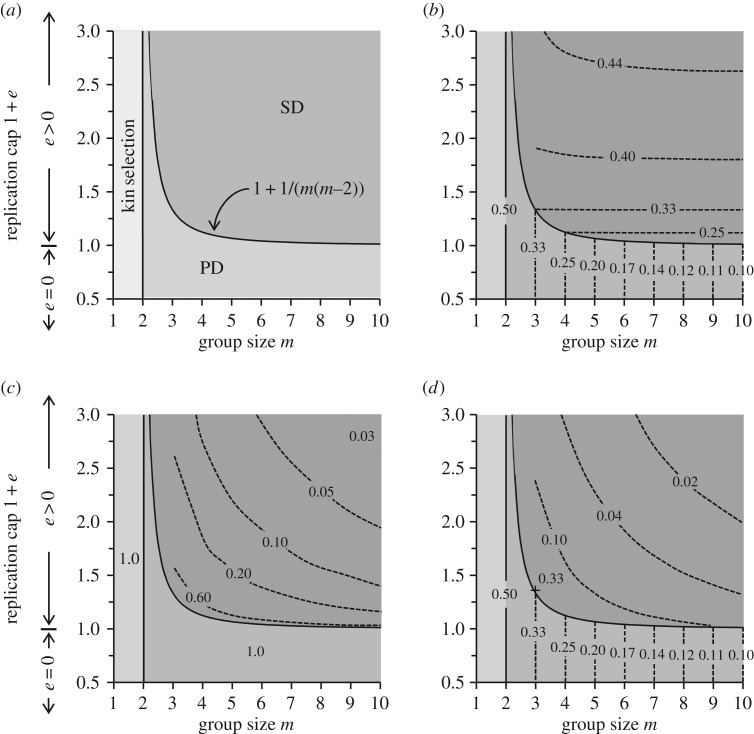
The existence of cooperation, or the production of public goods, is an evolutionary problem. Cooperation is not favoured because the Prisoner's Dilemma (PD) game drives cooperators to extinction. We have re-analysed this problem by using RNA viruses to motivate a model for the evolution of cooperation. Gene products are the public goods and group size is the number of virions co-infecting the same host cell. Our results show that if the trade-off between replication and production of gene products is linear, PD is observed. However, if the trade-off is nonlinear, the viruses evolve into separate lineages of ultra-defectors and ultra-cooperators as group size is increased. The nonlinearity was justified by the existence of real viral ultra-defectors, known as defective interfering particles, which gain a nonlinear advantage by being smaller. The evolution of ultra-defectors and ultra-cooperators creates the Snowdrift game, which promotes high-level production of public goods.

Keywords: Prisoner's Dilemma; RNA viruses; Snowdrift; cooperation; defective interfering particles; game theory.


Conflict of interest statement

We declare we have no competing interests.

Figures

Figure 1.
Figure 1.
Trade-off between replication and transcription in VSV viruses and DIs. (a) Complete single-stranded RNA genome of VSV with all required genes. After the (−) strand enters a host cell, the segment z serves as the initiation site for the synthesis of the (+) strand, which acts as both the messenger RNA and the replication template for the (−) strand. The segment a′ acts as the initiation site for both transcription and replication and the (+) strand is therefore constrained to trade-off between providing public goods and reproduction. (b) Single-stranded genomes of DI particles. This shortened DI genome is the most abundant type and it lacks the coding regions for genes needed for replication and infection. Additionally, the (+) and (−) strands become functionally equivalent and only capable of replication because their a′ and a segments are replaced with z and z′ segments, respectively. (c) Linear and nonlinear trade-offs between replication and transcription in VSV. Following the model, a virus can allocate an amount of available resources i to replication and 1 − i to transcription. In the absence of DIs, a linear trade-off (dashed line) is assumed between i and 1 − i because a virus can only trade-off by modulating the initiation site a′ to favour either replication or transcription, 0 ≤ i ≤ 1. If i = 1 and 1 − i = 0, a′ has been modulated to promote only replication. With the evolution of DIs, the trade-off becomes nonlinear because DIs acquire an even higher replication by both foregoing transcription and being smaller and replication rate i > 1. To prevent i from becoming infinity large, a replication cap of 1 + e was set (filled square), where i ≥ 0 and e = 0 reverts to a linear trade-off. Because i > 1 makes the transcription rate 1 − i negative, the trade-off was bounded 1 − i ≥ 0. DIs with i = 1 + e > 1 were termed ultra-defectors.
Figure 2.
Figure 2.
Linear trade-off and the evolution of PD. All populations evolved with a linear trade-off and a Monte Carlo simulation with population size of N = 1000, genomic mutation rate of u = 0.2 and a Gaussian distribution of mutational effects with mean zero and standard deviation σ = 0.005 (see Material and methods for additional details). (a) Evolutionary changes with m = 1. Grey areas represent all individual i values over time in three independent populations started with i = 0.8, 0.5 and 0.2. Black trace (straight line) represents the mean i values for population started with i = ½. A value of m = 1 serves as a control for the consequences of clonal selection because all individuals in a group descend from one individual. The consequence of clonal selection is that replication and the production of public goods evolves to the optimum of equalling each other, or ik = 1 − ik = ½. (b) Traces of the mean i values for independent populations evolved with increasing values of m. (c) Match of i values predicted by analytical solution ia = 1 − 1/m and the mean values evolved by Monte Carlo simulations. (d) General pay-off matrix representing PD. The pay-offs are the fitness values reward R when both players cooperate, temptation T for one player to defect, sucker's pay-off S for the cooperator facing defection and penalty P for both players defecting. PD requires the rank order T > R > P > S. (e) Fitness pay-off matrix for m = 2 (see §4d for matrix estimation). The population avoids PD because R is the highest value. Cooperation is favoured because group size is sufficiently small to allow clonal selection. (f) Fitness pay-off matrix with m = 3. The required PD rank order is satisfied. Optimal cooperation of i = ½ is not possible with PD, and defection leads to the evolution of PD and the evolved value of ia = 1 − 1/m (equation (2.2)). (g) Relationship between pay-offs T, R, P and S with increasing m. Required rank order for PD is satisfied for all m > 2.
Figure 3.
Figure 3.
Nonlinear trade-off and the transition to SD. All populations evolved with a nonlinear trade-off (e > 0) via a Monte Carlo simulation using the same parameters as in figure 2, unless otherwise specified. (a) Evolutionary changes with m = 8 and a replication cap of 1 + e = 1.5. Grey areas represent all individual i values over time in a population started with i = 0.5. Population evolves steadily higher i values to 1 − 1/m = 7/8 (equation (2.2)) and mutations increasing i > 1 surface at 1200 generations. At 1800 generations, a mutant evolves into an ultra-defector with i = 1.5. In response to the evolution of the ultra-defector, the population splits into a second lineage of ultra-cooperators that evolves a lower replication rate i, or a higher rate of public good production of 1 − i. (b) General fitness pay-off matrix representing SD with rank T > R > S > P (see figure 2 for additional details). (c) Pay-off matrix for population and conditions in figure 2a (see §4d for matrix estimation). Rank matches requirement for SD. The population is polymorphic and ultra-cooperators and ultra-defectors coexist because ultra-defectors can invade a population of ultra-cooperators (T > R) and vice versa (S > P). (d) Relationship between fitness pay-offs T, R, S and P with nonlinear trade-offs 1 + e = 1.15 and increasing m. The threshold for evolving SD is given by equation (2.3) or 1 + e > 1 + 1/[m(m − 2)], which is satisfied for m ≥ 4. For m = 3, the threshold is not satisfied and the rank is PD because 1.15 < 1.33. (e) Relationship between fitness pay-offs T, R, S and P with m = 3 and increasing replication cap 1 + e. With m = 3, the threshold for evolving SD is 1.33 (filled triangle) as in figure 2D. The rank is PD for 1 + e < 1.33 and SD for 1 + e > 1.33.
Figure 4.
Figure 4.
Parameter landscapes for the evolution of cooperation. Plots are topographic representations of evolutionary outcomes projected onto the parameter space of group size m and replication cap 1 + e. All graphed outcomes were obtained as either analytical or numeric solutions and were also verified through comparisons to Monte Carlo simulations (see §4f). (a) Parameter space leading to the evolution of clonal selection, PD and SD. Boundary for clonal selection and PD is given by equation (2.2) and for PD and SD by equation (2.3). (b) Evolved maximal level of individual cooperation represented as the production of public goods 1 – i. Values in the PD region are from equation (2.2). Values in the SD region are numerical solutions (see Material and methods) representing the production by ultra-cooperators. (c) Frequency of individuals producing the maximal individual values in figure 2b. Clonally selected and PD populations are monomorphic and all individuals produce maximally. SD populations are polymorphic and frequencies represent ultra-cooperators. (d) Evolved mean level of individual cooperation 1 − i in populations. Because PD populations are monomorphic and ultra-defectors in SD populations do not produce public goods, the mean is the product of individual values and frequencies from figure 2b,c. A maximum value of 0.33 (+) was observed at m = 3 and 1 + e = 1.34.

Similar articles

Cited by

References

    1. Bergua M, Zwart MP, El-Mohtar C, Shilts T, Elena SF, Folimonova SY. 2014. A viral protein mediates superinfection exclusion at the whole organism level but is not required for exclusion at the cellular level. J. Virol. 88, 11 327–11 338. (10.1128/JVI.01612-14) - DOI - PMC - PubMed
    1. Turner PE, Burch CL, Hanley KA, Chao L. 1999. Hybrid frequencies confirm limit to coinfection in the RNA bacteriophage φ6. J. Virol. 73, 2420–2424. - PMC - PubMed
    1. Whitaker-Dowling PA, Youngner JS, Widnell CC, Wilcox DK. 1983. Superinfection exclusion by vesicular stomatitis virus. Virology 131, 137–143. (10.1016/0042-6822(83)90540-8) - DOI - PubMed
    1. Doebeli M, Hauert C, Killingback T. 2004. The evolutionary origin of cooperators and defectors. Science 306, 859–862. (10.1126/science.1101456) - DOI - PubMed
    1. Doebeli M, Hauert C. 2005. Models of cooperation based on the Prisoner's Dilemma and the Snowdrift game. Ecol. Lett. 8, 748–766. (10.1111/j.1461-0248.2005.00773.x) - DOI