

Cell death-inducing DNA fragmentation factor A-like effector A and fat-specific protein 27β coordinately control lipid droplet size in brown adipocytes
- PMID: 28490632
- PMCID: PMC5491769
- DOI: 10.1074/jbc.M116.768820
Cell death-inducing DNA fragmentation factor A-like effector A and fat-specific protein 27β coordinately control lipid droplet size in brown adipocytes
Abstract
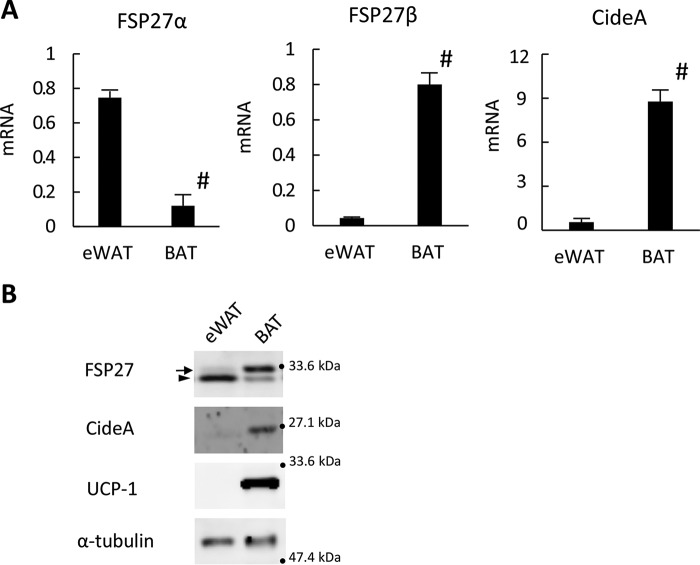
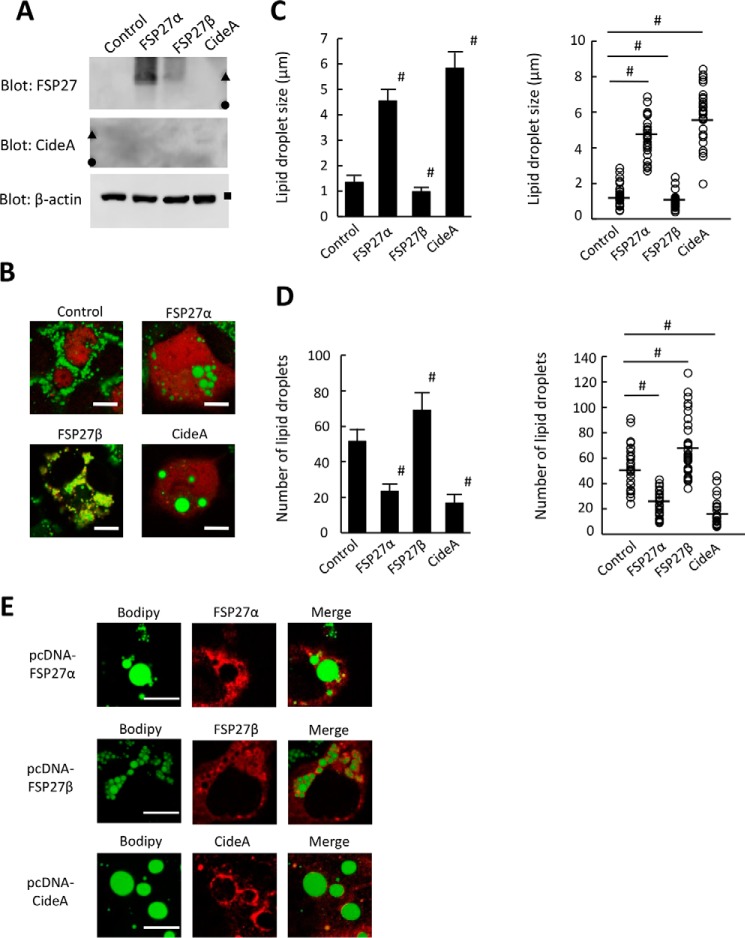
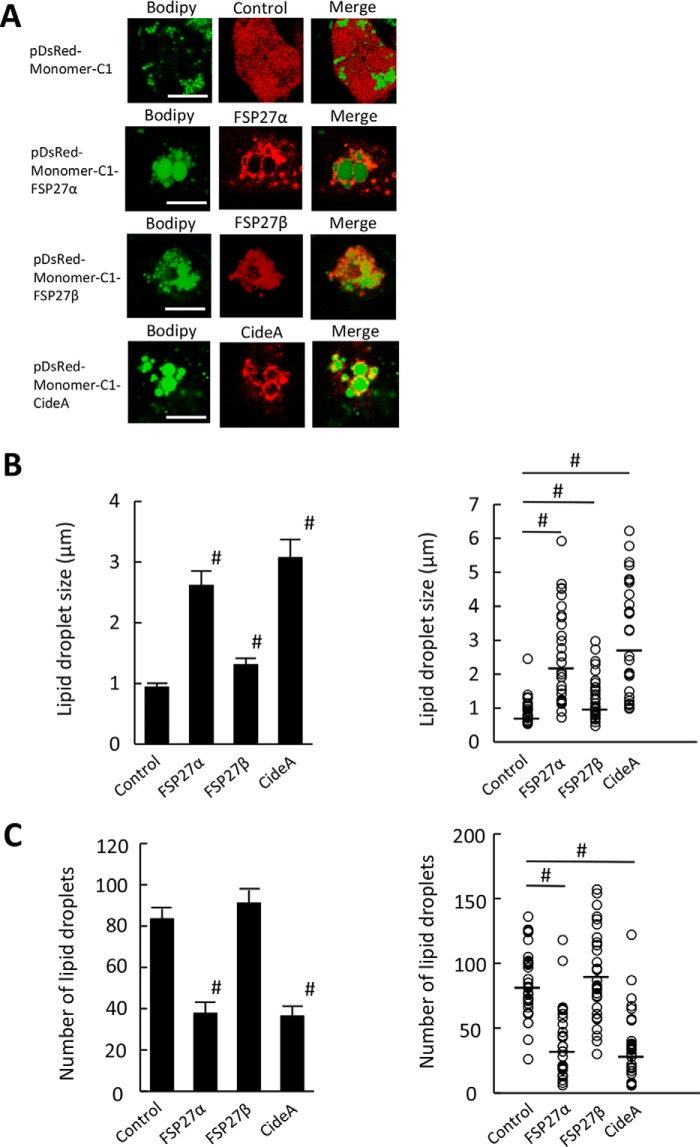
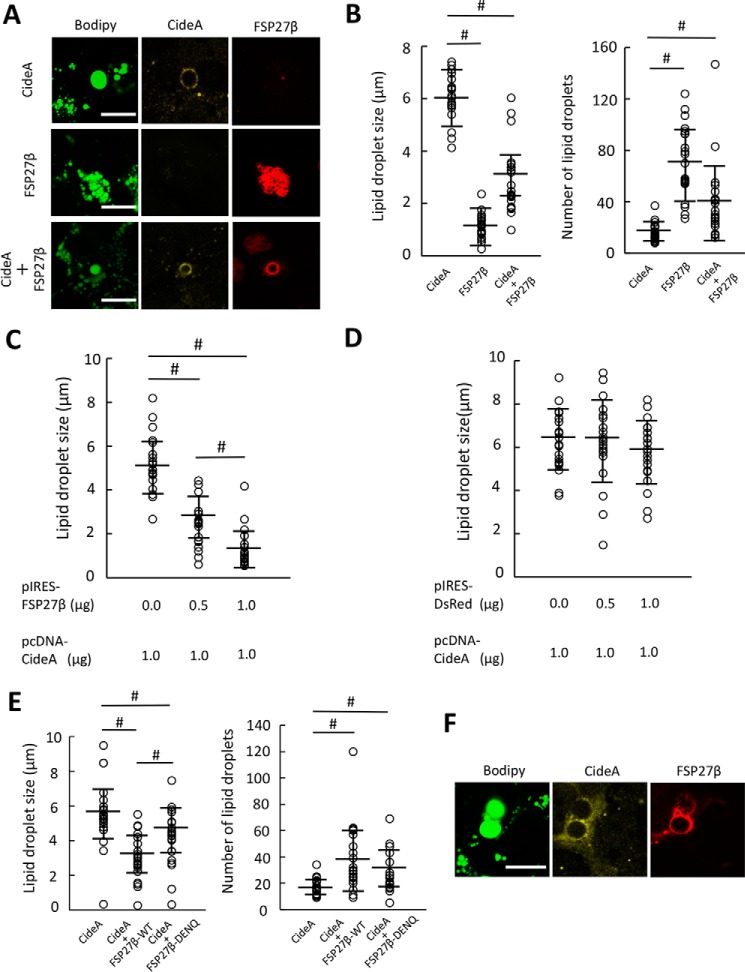
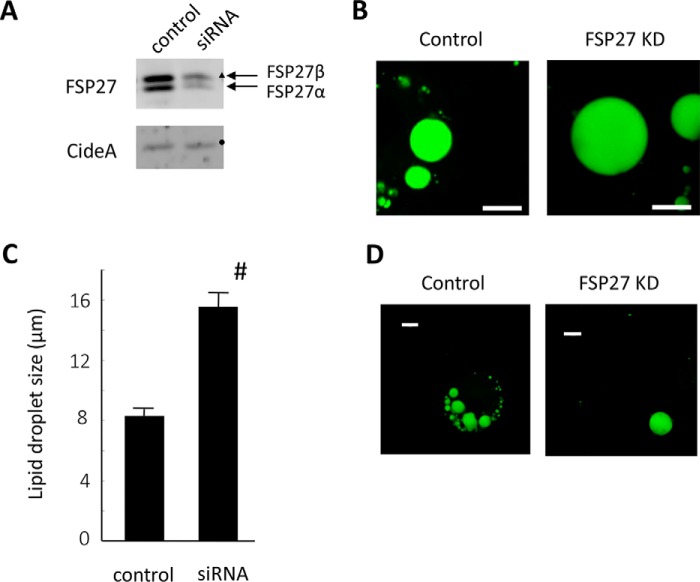
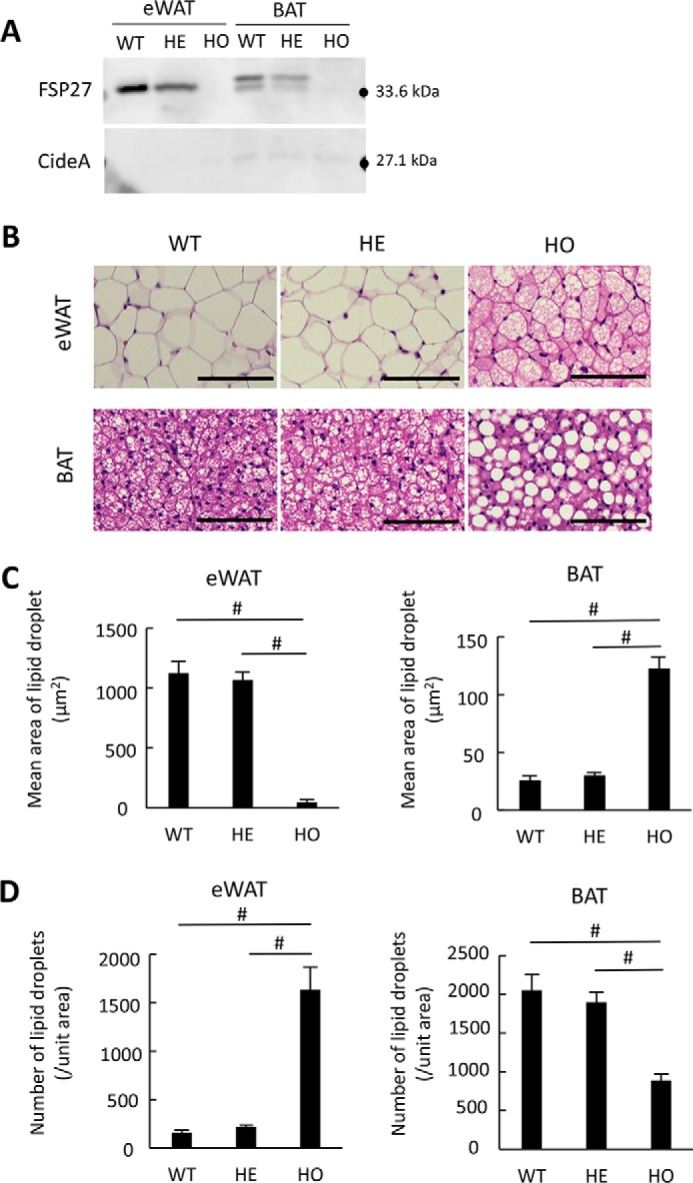
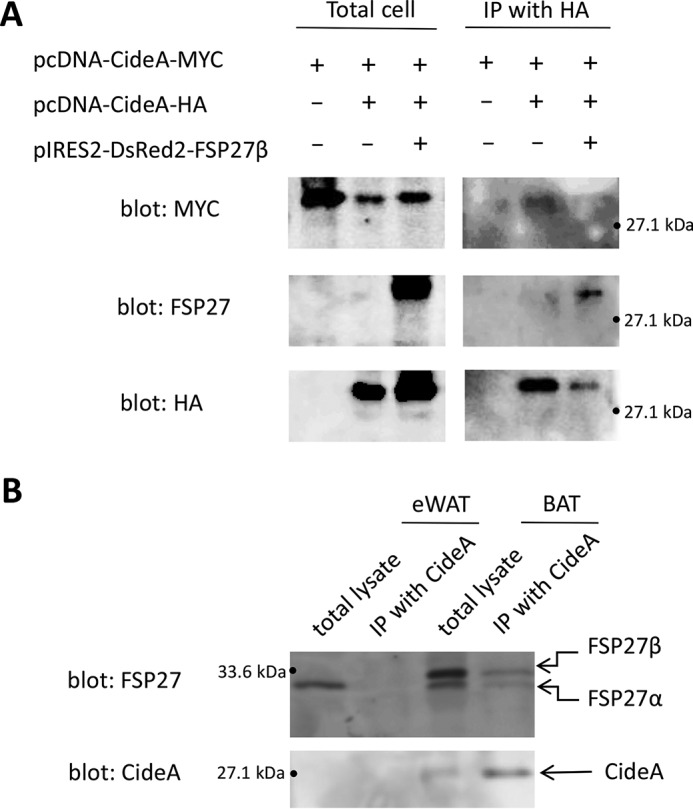
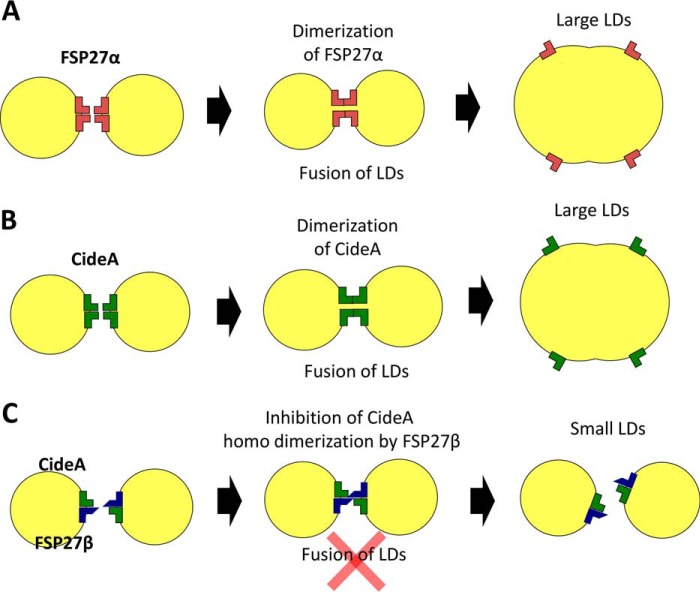
Adipose tissue stores neutral lipids and is a major metabolic organ involved in regulating whole-body energy homeostasis. Triacylglycerol is stored as unilocular large lipid droplets (LDs) in white adipocytes and as multilocular small LDs in brown adipocytes. Proteins of the cell death-inducing DNA fragmentation factor A-like effector (Cide) family include CideA, CideB, and fat-specific protein of 27 (FSP27). Of these, FSP27 has been shown to play a crucial role in the formation of unilocular large LDs in white adipocytes. However, the mechanisms by which brown adipocytes store small and multilocular LDs remain unclear. An FSP27 isoform, FSP27β, was recently identified. We herein report that CideA and FSP27β are mainly expressed in brown adipose tissue and that FSP27β overexpression inhibits CideA-induced LD enlargements in a dose-dependent manner in COS cells. Furthermore, RNAi-mediated FSP27β depletion resulted in enlarged LDs in HB2 adipocytes, which possess the characteristics of brown adipocytes. Brown adipocytes in FSP27-knock-out mice that express CideA, but not FSP27β, had larger and fewer LDs. Moreover, we confirmed that FSP27β and CideA form a complex in brown adipose tissue. Our results suggest that FSP27β negatively regulates CideA-promoted enlargement of LD size in brown adipocytes. FSP27β appears to be responsible for the formation of small and multilocular LDs in brown adipose tissue, a morphology facilitating free fatty acid transport to mitochondria adjacent to LDs for oxidation in brown adipocytes.
Keywords: adipocyte; brown adipose tissue (BAT); cell death-inducing DNA fragmentation factor A (DFFA)-like effector A (CideA); fat-specific protein of 27 (FSP27); lipid droplet; lipid metabolism; lipid oxidation; lipolysis; white adipose tissue (WAT).
© 2017 by The American Society for Biochemistry and Molecular Biology, Inc.
Conflict of interest statement
The authors declare that they have no conflicts of interest with the contents of this manuscript
Figures
Similar articles
-
Fat-specific protein 27α inhibits autophagy-dependent lipid droplet breakdown in white adipocytes.J Diabetes Investig. 2019 Nov;10(6):1419-1429. doi: 10.1111/jdi.13050. Epub 2019 Apr 26. J Diabetes Investig. 2019. PMID: 30927519 Free PMC article.
-
CIDE Family-Mediated Unique Lipid Droplet Morphology in White Adipose Tissue and Brown Adipose Tissue Determines the Adipocyte Energy Metabolism.J Atheroscler Thromb. 2017 Oct 1;24(10):989-998. doi: 10.5551/jat.RV17011. Epub 2017 Sep 5. J Atheroscler Thromb. 2017. PMID: 28883211 Free PMC article. Review.
-
Differential Roles of Cell Death-inducing DNA Fragmentation Factor-α-like Effector (CIDE) Proteins in Promoting Lipid Droplet Fusion and Growth in Subpopulations of Hepatocytes.J Biol Chem. 2016 Feb 26;291(9):4282-93. doi: 10.1074/jbc.M115.701094. Epub 2016 Jan 5. J Biol Chem. 2016. PMID: 26733203 Free PMC article.
-
Coordination Among Lipid Droplets, Peroxisomes, and Mitochondria Regulates Energy Expenditure Through the CIDE-ATGL-PPARα Pathway in Adipocytes.Diabetes. 2018 Oct;67(10):1935-1948. doi: 10.2337/db17-1452. Epub 2018 Jul 9. Diabetes. 2018. PMID: 29986925
-
CIDE family proteins control lipid homeostasis and the development of metabolic diseases.Traffic. 2020 Jan;21(1):94-105. doi: 10.1111/tra.12717. Traffic. 2020. PMID: 31746121 Review.
Cited by
-
Metformin Inhibits Lipid Droplets Fusion and Growth via Reduction in Cidec and Its Regulatory Factors in Rat Adipose-Derived Stem Cells.Int J Mol Sci. 2022 May 26;23(11):5986. doi: 10.3390/ijms23115986. Int J Mol Sci. 2022. PMID: 35682666 Free PMC article.
-
CIDEA expression in SAT from adolescent girls with obesity and unfavorable patterns of abdominal fat distribution.Obesity (Silver Spring). 2021 Dec;29(12):2068-2080. doi: 10.1002/oby.23295. Epub 2021 Oct 21. Obesity (Silver Spring). 2021. PMID: 34672413 Free PMC article.
-
CIDEC/FSP27 exacerbates obesity-related abdominal aortic aneurysm by promoting perivascular adipose tissue inflammation.Life Metab. 2024 Sep 18;4(1):loae035. doi: 10.1093/lifemeta/loae035. eCollection 2025 Feb. Life Metab. 2024. PMID: 39872985 Free PMC article.
-
Dynamic of lipid droplets and gene expression in response to β-aminoisobutyric acid treatment on 3T3-L1 cells.Eur J Histochem. 2018 Nov 28;62(4):2984. doi: 10.4081/ejh.2018.2984. Eur J Histochem. 2018. PMID: 30482005 Free PMC article.
-
Fat-specific protein 27α inhibits autophagy-dependent lipid droplet breakdown in white adipocytes.J Diabetes Investig. 2019 Nov;10(6):1419-1429. doi: 10.1111/jdi.13050. Epub 2019 Apr 26. J Diabetes Investig. 2019. PMID: 30927519 Free PMC article.
References
-
- Xu L., Zhou L., and Li P. (2012) CIDE proteins and lipid metabolism. Arterioscler. Thromb. Vasc. Biol. 32, 1094–1098 - PubMed
-
- Zhou Z., Yon Toh S., Chen Z., Guo K., Ng C. P., Ponniah S., Lin S. C., Hong W., and Li P. (2003) Cidea-deficient mice have lean phenotype and are resistant to obesity. Nat. Genet. 35, 49–56 - PubMed
-
- Li J. Z., Ye J., Xue B., Qi J., Zhang J., Zhou Z., Li Q., Wen Z., and Li P. (2007) Cideb regulates diet-induced obesity, liver steatosis, and insulin sensitivity by controlling lipogenesis and fatty acid oxidation. Diabetes 56, 2523–2532 - PubMed
-
- Nishino N., Tamori Y., Tateya S., Kawaguchi T., Shibakusa T., Mizunoya W., Inoue K., Kitazawa R., Kitazawa S., Matsuki Y., Hiramatsu R., Masubuchi S., Omachi A., Kimura K., Saito M., et al. (2008) FSP27 contributes to efficient energy storage in murine white adipocytes by promoting the formation of unilocular lipid droplets. J. Clin. Invest. 118, 2808–2821 - PMC - PubMed
MeSH terms
Substances
LinkOut - more resources
Full Text Sources
Other Literature Sources
Molecular Biology Databases
Research Materials
