. 2017 May 10;9(389):eaal2668.
doi: 10.1126/scitranslmed.aal2668.

Inhibiting the oncogenic translation program is an effective therapeutic strategy in multiple myeloma

Affiliations

Inhibiting the oncogenic translation program is an effective therapeutic strategy in multiple myeloma

Salomon Manier et al. Sci Transl Med. .

Erratum in

Abstract

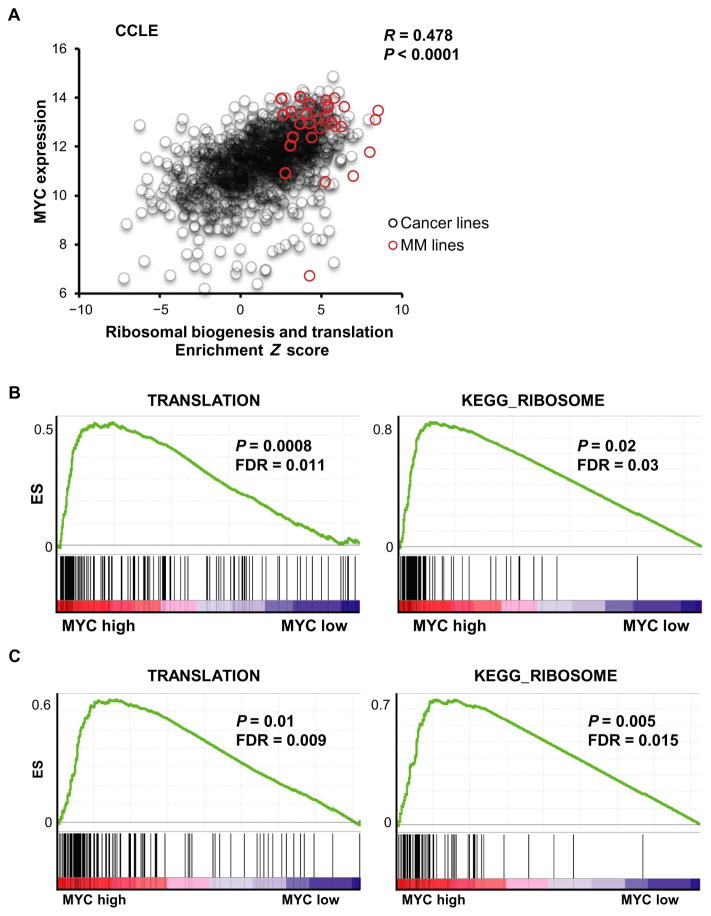
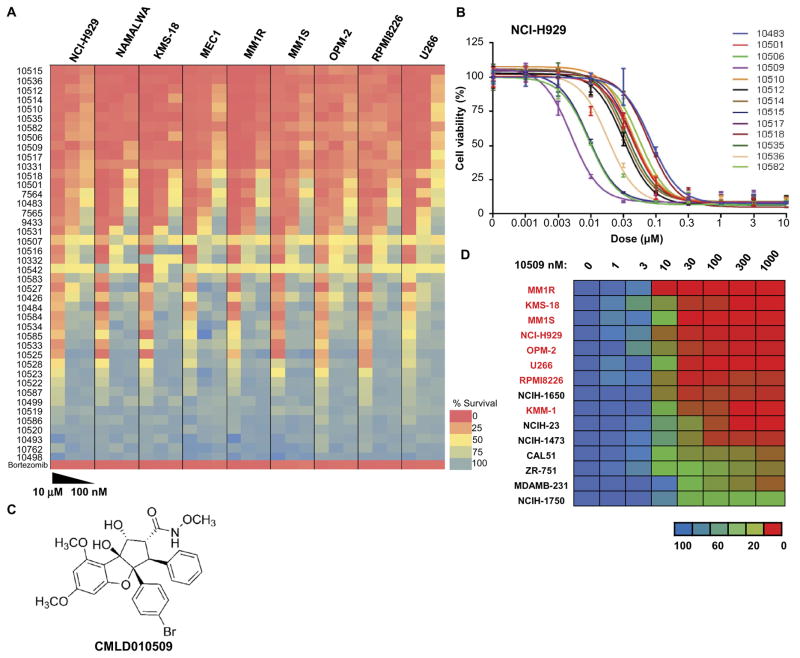
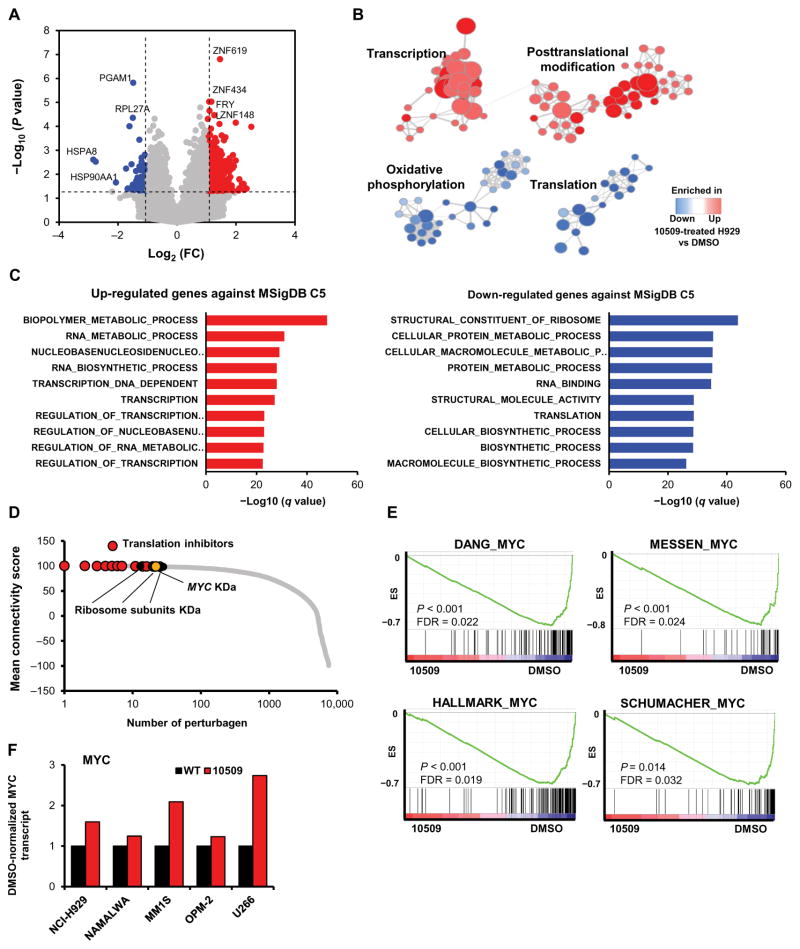
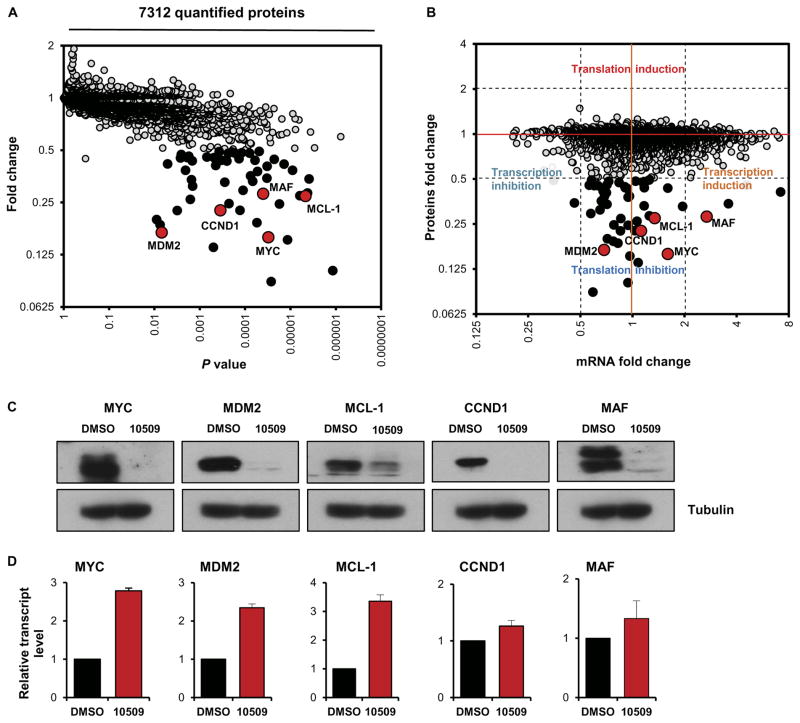
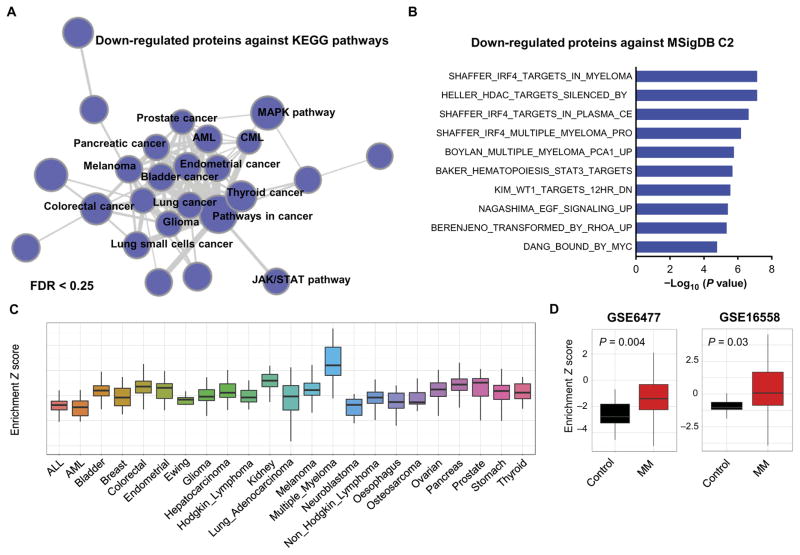
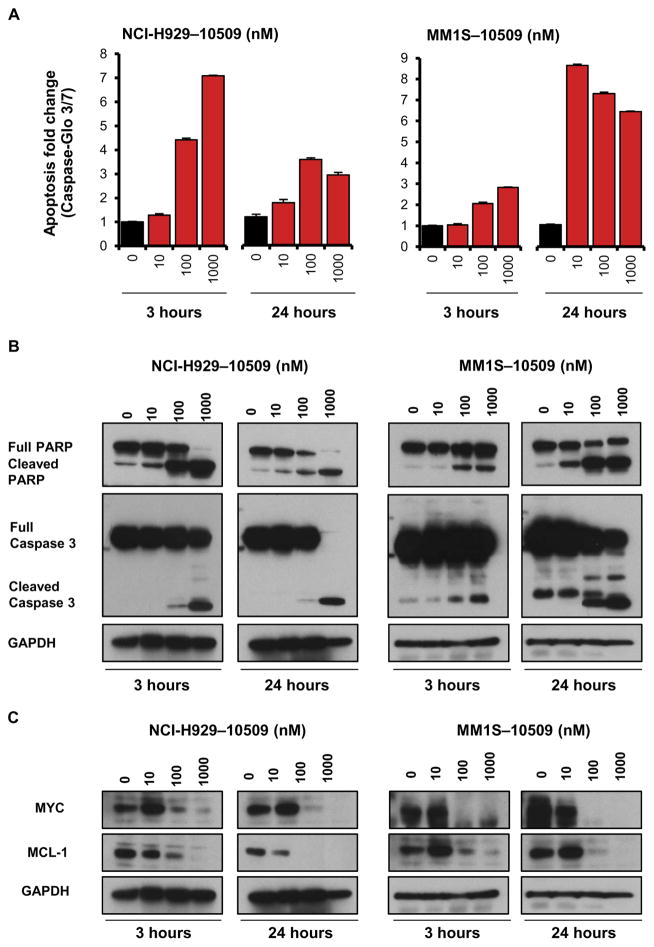
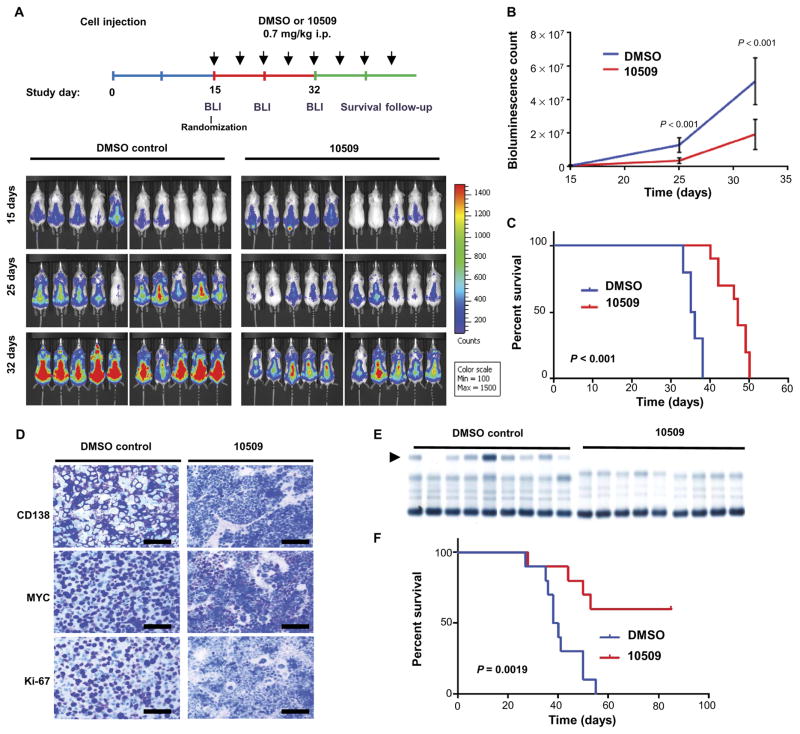
Multiple myeloma (MM) is a frequently incurable hematological cancer in which overactivity of MYC plays a central role, notably through up-regulation of ribosome biogenesis and translation. To better understand the oncogenic program driven by MYC and investigate its potential as a therapeutic target, we screened a chemically diverse small-molecule library for anti-MM activity. The most potent hits identified were rocaglate scaffold inhibitors of translation initiation. Expression profiling of MM cells revealed reversion of the oncogenic MYC-driven transcriptional program by CMLD010509, the most promising rocaglate. Proteome-wide reversion correlated with selective depletion of short-lived proteins that are key to MM growth and survival, most notably MYC, MDM2, CCND1, MAF, and MCL-1. The efficacy of CMLD010509 in mouse models of MM confirmed the therapeutic relevance of these findings in vivo and supports the feasibility of targeting the oncogenic MYC-driven translation program in MM with rocaglates.


Conflict of interest statement

Competing interests: The authors declare that they have no competing interests.

Figures

Fig. 1
Fig. 1. Correlation of MYC expression with ribosomal biogenesis and translation activity
(A) Correlation analysis of MYC expression on the y axis and the Z-score enrichment across over 1000 cell lines from the CCLE database. A Z score was generated for each cell line by combining two KEGG canonical pathway gene sets: ribosomal biogenesis and translation. Red dots indicate MM cell lines, and black circles indicate all CCLE cell lines except MM. A significant correlation between MYC expression and the translation activation was observed; R = 0.478, P < 0.0001. Gene Set Enrichment Analysis (GSEA) of MM patient tumor cell-derived gene expression profiling (GSE6477 and GSE16558) shown in (B) and (C), confirming enrichment of translation and ribosomal biogenesis in context of high expression of MYC. ES, enrichment score; FDR, false discovery rate.
Fig. 2
Fig. 2. Chemical library screen
(A) Small-molecule library generated by the Boston University Center (~3000 synthetic compounds) against NCI-H929 (MM) and NAMALWA (Burkitt lymphoma). We identified 45 compounds with a potent inhibition of proliferation for at least one of the cell lines. (B) Validation of 45 hits in six cell lines harboring diverse MM driver genomic features of MM, showing that the most effective compounds to inhibit proliferation were in the rocaglate class, namely, CMLD010331, CMLD010332, and CMLD09433 (red dots). These compounds had similar potency to bortezomib.
Fig. 3
Fig. 3. High potency of rocaglate inhibitors in MM
(A) Heat map of the effects of 40 rocaglate derivatives on relative survival of MM cells (NCI-H929, KMS-18, MM1R, MM1S, OPM-2, RPMI8226, and U266) along with lymphoma cell lines (NAMALWA and MEC1) shows strong activity with low doses of the rocaglate compounds in these cell lines. (B) IC50 of these 40 compounds in NCI-H929 showing that CMLD010509 was the most potent compound, with an IC50 below 10 nM. (C) CMLD010509 is a synthetic rocaglate derivative containing the cyclopenta[b]tetrahydrobenzofuran core structure. (D) IC50 of CMLD010509 showing an IC50 below 10 nM for most MM cell lines tested (indicated in red), whereas it was relatively resistant in lung and breast cancer cell lines (in black) with an IC50 of ~30 nM.
Fig. 4
Fig. 4. Transcription activation and translation inhibition induced by the rocaglate derivative CMLD010509
(A) Volcano plot of RNA-seq of drug- versus DMSO-treated cells in five different MM cell lines showing 845 and 475 genes significantly up- and down-regulated, respectively, with a fold change (FC) higher than 2. (B) Network enrichment map identifying two clusters enriched in CMLD010509-treated cells (transcription and posttranslational modification clusters) and two clusters enriched in control cells (oxidative phosphorylation and translation clusters). (C) Bar graphs showing the most significantly up- and down-regulated genes in CMLD010509-treated cells determined by querying the Molecular Signatures Database (MSigDB) C5 gene sets. (D) Connectivity score using LINCS NIH program with the gene signature of CMLD010509 against 10,000 “pertubagen” signatures (corresponding to short hairpin RNA, open reading frame, and compounds). (E) GSEA analysis of CMLD010509 using RNA-seq data. Several MYC gene sets were among the most significantly enriched compared to DMSO control cells. (F) Bar graphs of MYC transcript expression in MM cell lines and NAMALWA in CMLD010509-treated cells, normalized to DMSO control. WT, wild type; KD, knockdown.
Fig. 5
Fig. 5. Regulation of the oncogenic translation program of MM by CMLD010509
(A) Expression proteomics showing the impact of CMLD010509 treatment (100 nM) relative to vehicle control in NCI-H929 cells after a 2-hour incubation (three biological replicates were used and individually tagged using isobaric tagging). We identified 7312 proteins, of which 54 were significantly depleted by more than twofold through CMLD010509 exposure (P < 0.05; fold change, >2). The most depleted proteins included MYC, MDM2, CCND1, MCL-1, and MAF (red dots). (B) Comparison of the protein fold changes to the transcript fold changes in CMLD010509- versus vehicle-treated cells. A large majority of depleted proteins had a transcript fold change lower than twofold, suggesting a specific translational mechanism of action for CMLD010509. (C) Immunoblots and (D) qRT-PCR analysis of MYC, MDM2, CCND1, MCL-1, and MAF in compound-treated (100 nM, 3 hours) or vehicle-treated NCI-H929. All five genes were depleted at the protein level, whereas their transcripts were unchanged or slightly overexpressed.
Fig. 6
Fig. 6. Pathway analysis of CMLD010509
(A) Network enrichment analysis of 54 depleted proteins with more than twofold change analyzed in the KEGG database, showing that cancer pathways were highly enriched among these depleted proteins. AML, acute myeloid leukemia; CML, chronic myeloid leukemia; MAPK, mitogen-activated protein kinase; JAK/STAT, Janus kinase/signal transducer and activator of transcription. (B) The 54 depleted proteins were queried against MSigDB C2 canonical pathway database, showing an enrichment of MM specific oncoproteins including IRF4 pathway. (C) Z scores of the 54 proteins evaluated on 1000 cell lines of the CCLE database. (D) Z scores of the 54 proteins evaluated on two independent gene expression profiles including patients at diagnosis (GSE16558) and at relapse (GSE6477).
Fig. 7
Fig. 7. Induction of apoptosis by CMLD010509
(A) Apoptosis assay measured by caspase-3 and caspase-7 activation (Caspase-Glo 3/7) at 3 and 24 hours in NCI-H929 and MM1S cells treated with three concentrations of CMLD010509 versus vehicle control. (B) Immunoblots for cleavage of both PARP and caspase-3 in response to three concentrations of CMLD010509 in NCI-H929 and MM1S cells at 3 and 24 hours. (C) Immunoblots for MYC and MCL-1 in response to three concentrations of CMLD010509 in NCI-H929 and MM1S cells at 3 and 24 hours.
Fig. 8
Fig. 8. In vivo suppression of MM by CMLD010509
(A) Diagram of in vivo studies performed. SCID mice were injected with MM1S GFP (green fluorescent protein)/ Luc+. After engraftment, the mice were randomized to two groups based on BLI, and CMLD010509 or vehicle control was administered by intraperitoneal (i.p.) injections at 0.7 mg/kg two times a week. Tumor growth was assessed by weekly bioluminescence (BLI) counts, (B) showing a significant difference in tumor growth between the DMSO-treated group and the CMLD010509 group; P < 0.001. (C) Kaplan-Meier curve showing a significant survival difference between vehicle- and drug-treated mice, with a median OS of 35 versus 47 days, P < 0.001. (D) Immunohistochemistry for CD138, Ki-67, and MYC in bone marrow samples from the KMS-11–injected mice. Scale bars, 50 μm. (E) Electrophoresis of serum proteins from transplantable Vk*Myc mice indicating the presence of a γ-globulin (M-spike) in the DMSO control group (arrow) at 4 weeks. C57BL/6 syngeneic mice were intravenously injected with 3.5 × 10⁶ Vk*Myc cells. At day 7 after tumor cells injection, mice were randomized into two groups and received DMSO (n = 10) or CMLD010509 drug (n = 10, 0.7 mg/kg per mouse) through intraperitoneal injections twice a week. (F) Kaplan-Meier curve showing a significant survival difference between vehicle- and drug-treated mice, with a median OS of 39 days versus not reached, P = 0.0019. Statistical analyses were performed using log-rank test.

References

    1. Palumbo A, Anderson K. Multiple myeloma. N Engl J Med. 2011;364:1046–1060. - PubMed
    1. Howlader N, Noone AM, Yu M, Cronin KA. Use of imputed population-based cancer registry data as a method of accounting for missing information: Application to estrogen receptor status for breast cancer. Am J Epidemiol. 2012;176:347–356. - PMC - PubMed
    1. Chng WJ, Huang GF, Chung TH, Ng SB, Gonzalez-Paz N, Troska-Price T, Mulligan G, Chesi M, Bergsagel PL, Fonseca R. Clinical and biological implications of MYC activation: A common difference between MGUS and newly diagnosed multiple myeloma. Leukemia. 2011;25:1026–1035. - PMC - PubMed
    1. Walker BA, Wardell CP, Murison A, Boyle EM, Begum DB, Dahir NM, Proszek PZ, Melchor L, Pawlyn C, Kaiser MF, Johnson DC, Qiang YW, Jones JR, Cairns DA, Gregory WM, Owen RG, Cook G, Drayson MT, Jackson GH, Davies FE, Morgan GJ. APOBEC family mutational signatures are associated with poor prognosis translocations in multiple myeloma. Nat Commun. 2015;6:6997. - PMC - PubMed
    1. Affer M, Chesi M, Chen WD, Keats JJ, Demchenko YN, Tamizhmani K, Garbitt VM, Riggs DL, Brents LA, Roschke AV, Van Wier S, Fonseca R, Bergsagel PL, Kuehl WM. Promiscuous MYC locus rearrangements hijack enhancers but mostly super-enhancers to dysregulate MYC expression in multiple myeloma. Leukemia. 2014;28:1725–1735. - PMC - PubMed

Publication types