. 2017 May 10;7(1):1680.
doi: 10.1038/s41598-017-01927-6.

Mangrove dieback during fluctuating sea levels

Affiliations

Mangrove dieback during fluctuating sea levels

Catherine E Lovelock et al. Sci Rep. .

Abstract

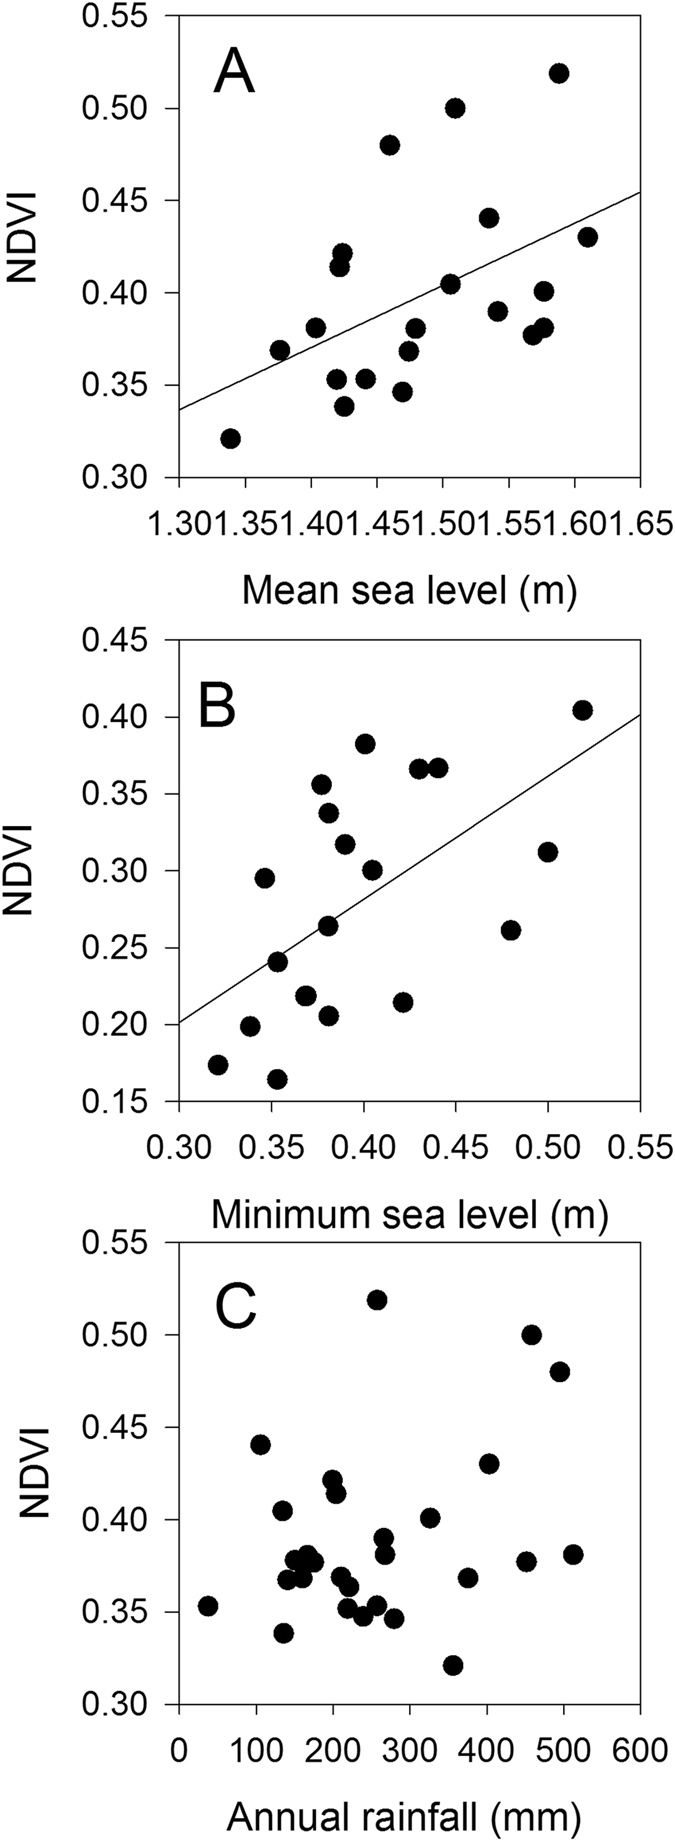
Recent evidence indicates that climate change and intensification of the El Niño Southern Oscillation (ENSO) has increased variation in sea level. Although widespread impacts on intertidal ecosystems are anticipated to arise from the sea level seesaw associated with climate change, none have yet been demonstrated. Intertidal ecosystems, including mangrove forests are among those ecosystems that are highly vulnerable to sea level rise, but they may also be vulnerable to sea level variability and extreme low sea level events. During 16 years of monitoring of a mangrove forest in Mangrove Bay in north Western Australia, we documented two forest dieback events, the most recent one being coincident with the large-scale dieback of mangroves in the Gulf of Carpentaria in northern Australia. Diebacks in Mangrove Bay were coincident with periods of very low sea level, which were associated with increased soil salinization of 20-30% above pre-event levels, leading to canopy loss, reduced Normalized Difference Vegetation Index (NDVI) and reduced recruitment. Our study indicates that an intensification of ENSO will have negative effects on some mangrove forests in parts of the Indo-Pacific that will exacerbate other pressures.


Conflict of interest statement

The authors declare that they have no competing interests.

Figures

Figure 1
Figure 1
Normalized difference vegetation index (NDVI) of Mangrove Bay mangrove forest showing the thinning canopy during the dieback in 2003 associated with low sea level and high salinity of soil porewater (A), after recovery of the canopy in 2013 (B), and after the most recent downward swing of the sea level seesaw in 2015 (C). An aerial image of the site (D) shows the mangrove fringing small creeks and lagoons adjacent to the Ningaloo reef flat and the grassland dominated terrestrial environment. The location of Mangrove Bay on the Australian coast is shown in the inset. NDVI was obtained from Landsat scenes (Table S1), the aerial image from 2012 was obtained from © 1995–2016 Esri (Service Layer Credits: Source Esri, Digital Globe, GeoEye, Earthstar Geographics, CNES/Airbus DS, USDA, USGS, AEX, Getmapping, Aerogrid, IGN, IGP, swisstopp, and the GIS User Community). Geographic boundaries represent Australian Statistical Geography Standard (ASGS) provided by the Australian Bureau of Statistics (ABS, 2011, data freely available at http://www.abs.gov.au/AUSSTATS/abs@.nsf/Lookup/1259.0.30.001 Main+Features1July%202011?OpenDocument). Map generated in ArcMap v10.3.1.
Figure 2
Figure 2
Inter-annual variation in mean sea level (A), mean soil porewater salinity of two monitoring campaigns (black and white symbols) (B), normalized salinity (C) and mean annual Normalized Difference Vegetation Index (NDVI) (D) from 1999–2016 at Mangrove Bay on the Ningaloo coast, Western Australia. Error bars are standard deviations. Salinity was normalized (expressed in relative units) to account for differences in locations of the two monitoring strategies over the study period. A value of 1 is equivalent to the initial value while 1.25 indicates a value 25% higher than the initial soil salinity. Elevated soil porewater salinity was evident in 2003 and 2004 as well as 2015 and 2016, both periods which were associated with wide spread canopy dieback (indicated by the blue bars). Source data are available in Supplementary data Table 2.
Figure 3
Figure 3
The relationship between normalized porewater salinity and the annual mean sea level over the study period. The regression, of the form y = 3.70 + −1.77 * x, R2 = 0.69, is significant either with or without the data for 2002 data included (indicated in grey) which was a year with intense rainfall in the month prior to sampling. Filled symbols are from 2002–2011 and open symbols from 2007–2016.
Figure 4
Figure 4
The annual mean Normalized Difference Vegetation Index (NDVI) of Mangrove Bay mangrove forest as a function of annual mean sea level (A), annual monthly minimum sea level (B) and annual rainfall (C). The regression line in panel A is y = −0.10 + 0.336 * x, R2 = 0.24 (P = 0.0246) and in panel B is y = 0.28 + 0.42 * x, R2 = 0.34 (P = 0.0074). The relationship between annual NDVI and rainfall was not significant (P > 0.05).
Figure 5
Figure 5
The coefficient of variation in the Normalized Difference Vegetation Index (NDVI) of pixels in the Mangrove Bay mangrove forest (A) and the mean NDVI (B) as a function of distance from the creek mouth. The regression line in panel A is y = 0.0087 + 0.000021 * x, R2 = 0.27 (P < 0.0001) and in panel B is y = 0.47 + −0.000022 * x, R2 = 0.12 (P < 0.0001).
Figure 6
Figure 6
The relationship between the total number of seedlings observed in the monitoring plots and the mean soil porewater salinity (±standard deviation) for the year prior to the seedling survey (when propagules were developing). Seedlings were surveyed in 12, 5 × 5 m plots (total area of 300 m2). Curve is an exponential decay of the form y = 22,149,609 (±22,954,957) * exp (−0.2035 (±0.0208) * x), R2 = 0.96, where standard error of the parameter estimates is in parentheses.

References

    1. Ball MC. Ecophysiology of mangroves. Trees. 1988;2(3):129–142. doi: 10.1007/BF00196018. - DOI
    1. Eslami-Andargoli L, Dale PER, Sipe N, Chaseling J. Mangrove expansion and rainfall patterns in Moreton Bay, southeast Queensland, Australia. Estuar. Coast. Shelf Sci. 2009;85:292–298. doi: 10.1016/j.ecss.2009.08.011. - DOI
    1. Merrifield, M. A., Thompson, P. R. & Lander, M. Multidecadal sea level anomalies and trends in the western tropical Pacific. Geophys. Res. Let. 39(13) (2012)
    1. Hamlington BD, et al. An ongoing shift in Pacific Ocean sea level. J. Geophys. Res. Oceans. 2016;121:5084–5097. doi: 10.1002/2016JC011815. - DOI
    1. Moon JH, Song YT, Lee H. PDO and ENSO modulations intensified decadal sea level variability in the tropical Pacific. J. Geophys. Res. Oceans. 2015;120:8229–8237. doi: 10.1002/2015JC011139. - DOI

Publication types