. 2017 May 10;7(1):1661.
doi: 10.1038/s41598-017-01937-4.

Hepatic estrogen receptor α is critical for regulation of gluconeogenesis and lipid metabolism in males

Affiliations

Hepatic estrogen receptor α is critical for regulation of gluconeogenesis and lipid metabolism in males

Shuiqing Qiu et al. Sci Rep. .

Abstract

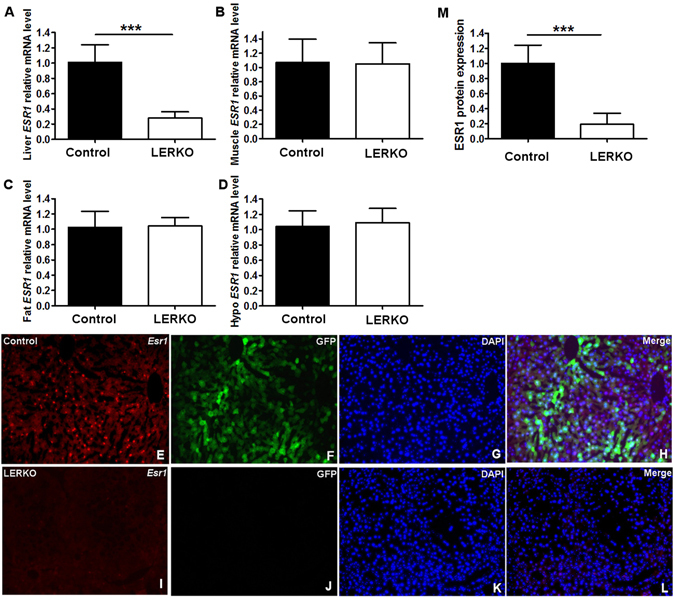
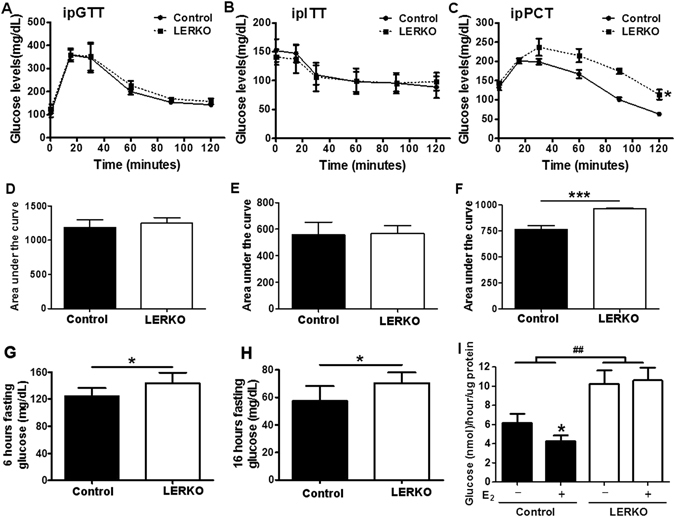
Impaired estrogens action is associated with features of the metabolic syndrome in animal models and humans. We sought to determine whether disruption of hepatic estrogens action in adult male mice could recapitulate aspects of the metabolic syndrome to understand the mechanistic basis for the phenotype. We found 17β-estradiol (E2) inhibited hepatic gluconeogenic genes such as phosphoenolpyruvate carboxykinase 1 (Pck-1) and glucose 6-phosphatase (G6Pase) and this effect was absent in mice lacking liver estrogen receptor α (Esr1) (LERKO mice). Male LERKO mice displayed elevated hepatic gluconeogenic activity and fasting hyperglycemia. We also observed increased liver lipid deposits and triglyceride levels in male LERKO mice, resulting from increased hepatic lipogenesis as reflected by increased mRNA levels of fatty acid synthase (Fas) and acetyl-CoA carboxylase (Acc1). ChIP assay demonstrated estradiol (E2) induced ESR1 binding to Pck-1, G6Pase, Fas and Acc1 promoters. Metabolic phenotyping demonstrated both basal metabolic rate and feeding were lower for the LERKO mice as compared to Controls. Furthermore, the respiratory exchange rate was significantly lower in LERKO mice than in Controls, suggesting an increase in lipid oxidation. Our data indicate that hepatic E2/ESR1 signaling plays a key role in the maintenance of gluconeogenesis and lipid metabolism in males.


Conflict of interest statement

The authors declare that they have no competing interests.

Figures

Figure 1
Figure 1
Knock down of hepatic ESR1 in the LERKO mice. (AD) mRNA levels of ESR1 in liver, muscle, fat and hypothalamus measured by q-RT-PCR. (E–L) immunofluorescence staining of hepatic ESR1 from Control (EH) and LERKO mice liver (IL). (E,I) ESR1 staining. (F,J) GFP fluorescence. (G,K) DAPI staining. (H,L) merged images. (M) ImageJ quantification of immunofluorescence staining (n = 6). Data are expressed as the means ± SD, *p < 0.05 versus Control, **p < 0.01 versus Control, ***p < 0.001 versus Control.
Figure 2
Figure 2
Glucose, insulin and pyruvate tolerance tests. (A) Glucose tolerance test (GTT) was performed on Control (circle symbols) and LERKO (square symbols) mice. Glucose (2 g/kg body weight) was administrated by intraperitoneal injection after overnight fasting. (D) Area under the curve of the GTT displayed in (A). (B) Insulin tolerance test (ITT) was performed on Control (circle symbols) and LERKO (square symbols) mice. Insulin (0.3 U/kg body weight) was administrated by intraperitoneal injection after 7 hours fasting. (E) Area under the curve of the ITT displayed in (B). (C) Pyruvate challenge test (PCT) was performed on Control (circle symbols) and LERKO (square symbols) mice. Pyruvate (2 g/kg body weight) was administrated by intraperitoneal injection after 6 hours fasting. (F) Area under the curve of the PCT displayed in (C). *p < 0.05 versus Control. (GH) 6 hours and 16 hours fasting glucose of Control and LERKO mice. *p < 0.05, ***p < 0.001 versus Control (Fig. 2A–H). (I) Glucose production assays were conducted in primary hepatocytes from Control and LERKO mice; cells were subjected to 4 hours of serum starvation before the addition of E2 for 12 hours. The experiments were performed 1–3 weeks after virus injection. The data are expressed as the means ± SD, *p < 0.05, vehicle versus E2 treatment, ## p < 0.01 Control versus LERKO (Fig. 2I).
Figure 3
Figure 3
ESR1 inhibition of gluconeogenic gene expression is E2 dependent. (A,B) Hepatic mRNA levels of G6Pase and Pck1 from Control mice and LERKO mice (n >= 6 per genotype). (C,D) Primary hepatocytes from Control mice were treated with vehicle or different doses of E2 (10−12 M, 10−11 M, 10−10 M, 10−9 M, 10−8 M), mRNA levels of G6Pase and Pck1 were measured by q-RT-PCR. F-H, primary hepatocytes from Control and LERKO mice were treated with vehicle or different doses of E2 (10−10 M, 10−9 M, 10−8 M), mRNA levels of G6Pase and Pck1 were measured by q-RT-PCR. (E,F) Primary hepatocytes from Control and LERKO mice were treated with vehicle or different doses of E2 (10−10 M, 10−9 M, 10−8 M), mRNA levels of G6Pase and Pck1 were measured by q-RT-PCR.G-H, ChIP assay experiments were performed with liver tissues using antibody to ESR1, or with rabbit preimmune serum (IgG) and primers flanking the G6Pase (G) and Pck1 (H) promoters. Real-time PCR data with an inset of a 1.5% agarose gel as a representative example. Results were normalized to input and shown as fold enrichment IgG from 3 independent ChIP experiments. The experiments were performed 2 weeks after virus injection. The data are expressed as the means ± SD, *p < 0.05 versus control, *p < 0.05 versus vehicle, ### p < 0.001 versus control.
Figure 4
Figure 4
E2/ESR1 signaling inhibits hepatic lipogenesis. Representative images of liver sections from Control (A) and LERKO (B) mice after staining with Oil Red O as a measure of lipid accumulation (magnification: ×20). n = 3 per group. (C) Quantification of Oil Red O staining using Image (J). (D) Hepatic triglyceride levels in Control and LERKO mice. (E,F) mRNA levels of hepatic lipogenic genes Fas and Acc1 in Control and LERKO mice were measured by q-RT-PCR. (CF) *p < 0.05 versus Control, **p < 0.01 versus Control. Data from Fig. 4E,F are representative of results obtained from 6–10 mice in each group. (G,H). Primary hepatocytes from Control and LERKO mice were treated with vehicle or different doses of E2 (10−10 M, 10−9 M, 10−8 M) or GPER agonist G-1 (10−10 M, 10−9 M, 10−8 M), mRNA levels of Fas and Acc1 were measured by q-RT-PCR. *p < 0.05 versus vehicle, **p < 0.01 versus vehicle, ***p < 0.001 versus vehicle. (I,J) Primary hepatocytes from Control and LERKO mice were treated with vehicle or different doses of E2 (10−10 M, 10−9 M, 10−8 M) in absence or in presence of GPER antagonist G-15 (10−8 M), mRNA levels of Fas and Acc1 were measured by q-RT-PCR. *p < 0.05 versus vehicle, **p < 0.01 versus vehicle, ***p < 0.001 versus vehicle. (K,L) ChIP assay experiments were performed with liver tissues using antibody to ESR1, or with rabbit preimmune serum (IgG) and primers flanking the Fas (K) and Acc1 (L) promoters. Real-time PCR data with an inset of a 1.5% agarose gel as a representative example. Results were normalized to input and shown as fold enrichment IgG from 3 independent ChIP experiments. The experiments were performed 2 weeks after virus injection. Values are means ± SD. *p < 0.05 versus IgG, ***p < 0.001 versus IgG.
Figure 5
Figure 5
Reduced energy expenditure in LERKO mice. (A) Real-time monitoring curve of carbon dioxide release (VCO2). (B) Quantification of carbon dioxide release. (C) Real-time monitoring curve of oxygen consumption (VO2). (D) Quantification of O2 consumption. (E) Real-time monitoring curve of accumulated food intake. (F) Quantification of food intake. G, Respiratory exchange ratio (RER = VCO2/VO2) (H), Calculated body heat. (I) Locomotor activity. (J) Body weight measurement of Control group and LERKO group on GFP or CRE virus injection day 0, 4, 8, 12, 16. The experiments were performed 3 weeks after virus injection. Values are means ± SD. *p < 0.05.

Similar articles

Cited by

References

    1. Khan D, Ansar Ahmed S. The Immune System Is a Natural Target for Estrogen Action: Opposing Effects of Estrogen in Two Prototypical Autoimmune Diseases. Frontiers In Immunology. 2016;6:635. doi: 10.3389/fimmu.2015.00635. - DOI - PMC - PubMed
    1. Cenci S, et al. Estrogen deficiency induces bone loss by enhancing T-cell production of TNF-alpha. J. Clin. Invest. 2000;106:1229. doi: 10.1172/JCI11066. - DOI - PMC - PubMed
    1. Avtanski D, et al. Both estrogen receptor a and ß stimulate pituitary GH gene expression. Mol. Endocrinol. 2014;28:40. doi: 10.1210/me.2013-1245. - DOI - PMC - PubMed
    1. Leung KC, Johannsson G, Leong GM, Ho KK. Estrogen regulation of growth hormone action. Endocr. Rev. 2004;25:693. doi: 10.1210/er.2003-0035. - DOI - PubMed
    1. Sárvári M, et al. Long-Term Estrogen Receptor Beta Agonist Treatment Modifies the Hippocampal Transcriptome in Middle-Aged Ovariectomized Rats. Frontiers In Cellular Neuroscience. 2016;10:149. doi: 10.3389/fncel.2016.00149. - DOI - PMC - PubMed

Publication types

MeSH terms