. 2017 Apr 26:12:3347-3356.
doi: 10.2147/IJN.S133247. eCollection 2017.

Quantitative and multiplexed detection for blood typing based on quantum dot-magnetic bead assay

Affiliations

Quantitative and multiplexed detection for blood typing based on quantum dot-magnetic bead assay

Ting Xu et al. Int J Nanomedicine. .

Abstract

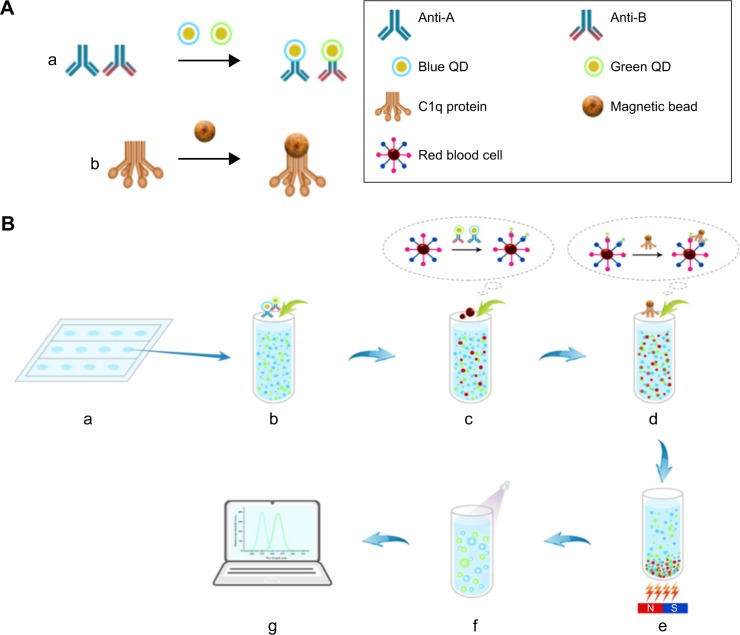
Background: Accurate and reliable blood grouping is essential for safe blood transfusion. However, conventional methods are qualitative and use only single-antigen detection. We overcame these limitations by developing a simple, quantitative, and multiplexed detection method for blood grouping using quantum dots (QDs) and magnetic beads.

Methods: In the QD fluorescence assay (QFA), blood group A and B antigens were quantified using QD labeling and magnetic beads, and the blood groups were identified according to the R value (the value was calculated with the fluorescence intensity from dual QD labeling) of A and B antigens. The optimized performance of QFA was established by blood typing 791 clinical samples.

Results: Quantitative and multiplexed detection for blood group antigens can be completed within 35 min with more than 105 red blood cells. When conditions are optimized, the assay performance is satisfactory for weak samples. The coefficients of variation between and within days were less than 10% and the reproducibility was good. The ABO blood groups of 791 clinical samples were identified by QFA, and the accuracy obtained was 100% compared with the tube test. Receiver-operating characteristic curves revealed that the QFA has high sensitivity and specificity toward clinical samples, and the cutoff points of the R value of A and B antigens were 1.483 and 1.576, respectively.

Conclusion: In this study, we reported a novel quantitative and multiplexed method for the identification of ABO blood groups and presented an effective alternative for quantitative blood typing. This method can be used as an effective tool to improve blood typing and further guarantee clinical transfusion safety.

Keywords: blood group antigens; blood typing; fluorescence detection; magnetic beads; quantum dots.


Conflict of interest statement

Disclosure The authors report no conflicts of interest in this work.

Figures

Figure 1
Figure 1
Schematic representation of quantum dot fluorescence assay (QFA). (A) Preparation of QDs-antibody and C1q-beads: (a) the anti-blood group A and B antigen antibodies were conjugated with blue and green QDs, respectively, and (b) C1q protein was coupled with magnetic beads. (B) QFA procedure: (a) the experiment was performed in 96-well microplates, (b) addition of QDs-anti-A and QDs-anti-B in the sample well, (c) the blood sample was added in well and reacted with the QDs-antibody, (d) the C1q-beads were added in the well and then combined with antigen–antibody complex, (e) the new compound was magnetically separated using C1q-beads, (f) the supernatant was transferred to a new microplate and free-QD labeling detected by fluorescence spectrophotometry, and (g) the fluorescence intensity of the labeling was measured. Abbreviations: anti-A, anti-blood group A antigen antibodies; anti-B, anti-blood group B antigen antibodies; N, north magnetic pole; QD, quantum dot; S, south magnetic pole.
Figure 2
Figure 2
Optical characterization of QDs and QDs-antibody (excitation peak at 365 nm). (A) Emission spectrum (solid lines) and absorption spectrum (dashed lines) of blue QDs. The labeling concentration was 3.4 μM and the emission peak was at 525 nm. (B) Emission spectrum (solid lines) and absorption spectrum (dashed lines) of green QDs. The concentration of labeling was 2.7 μM and the emission peak was 565 nm. (C) Emission spectrum of QDs-anti-A (dashed lines) and bare QDs (solid lines). The QDs-anti-A was presented as a slight blue shift of approximately 3 nm compared with blue QDs. (D) Emission spectrum of QDs-anti-B (dashed lines) and bare QDs (solid lines). The QDs-anti-B was shown as a small blue shift of approximately 6 nm compared with green QDs. (E) Emission spectrum of QDs-anti-A (solid lines) and QDs-anti-B (dashed lines). The emission peaks were 522 nm and 559 nm, respectively. The distance between the peaks was 37 nm and there was nearly no overlap. Abbreviations: anti-A, anti-blood group A antigen antibodies; anti-B, anti-blood group B antigen antibodies; QD, quantum dot.
Figure 3
Figure 3
Optimization of blood group antigens detection by QFA. (A) Optimization of the anti-A and -B antigen antibody concentrations following bioconjugation. The QDs-anti-A and QDs-anti-B revealed the highest fluorescence intensity when the coating concentrations of the primary A and B antibodies were 14 mg/L and 12 mg/L, respectively (n=3). (B) Effect of storage time on the blue QDs and QDs-anti-A. The fluorescence intensities of blue QDs and QDs-anti-A were reduced by 1.12% and 5.12% after 30 d, respectively; however, they were reduced by 3.56% and 15.48% after 60 d, respectively (n=3). (C) Effect of storage time on the green QDs and QDs-anti-B. The fluorescence intensity levels of green QDs and QDs-anti-B were reduced by 1.14% and 4.48% after 30 d, respectively, while they were reduced by 3.17% and 14.04% after 60 d, respectively (n=3). (D) Effect of C1q concentration on the saturation rate. The saturation rate was reached at 51.87%, and the magnetic beads were saturated when the C1q concentration was 10 mg/L (n=3). (E) Effect of time on the blood group A and B antigen-antibody reactions. The R values were the highest when the reaction times of A and B were 20 min and 15 min, respectively. Therefore, reaction time of 20 min was considered beneficial for synchronous detection (n=3). (F) Effect of time on the reaction of C1q-beads and QD antibody-antigen complex. Fifteen minutes was taken as the optimal time because the R value was the highest at this point (n=3). Abbreviations: anti-A, anti-blood group A antigen antibodies; anti-B, anti-blood group B antigen antibodies; QFA, quantum dot fluorescence assay; QD, quantum dot.
Figure 4
Figure 4
Performance of blood group antigens detection by QFA. (A) Effect of a number of RBCs on detection. The antigen was effectively detected when the number of RBCs was higher than 105; however, the R value was not significantly different (P>0.05, n=5) when the RBC number was more than 106 (N: negative; *significant differences compared with A antigen–negative sample; #significant differences compared with B antigen–negative sample). (B) Antigen detection of stored samples. The R values of the fresh and stored samples were not significantly different (P>0.05, n=5; *significant differences compared with A antigen–negative sample; #significant differences compared with B antigen–negative sample). (C) Antigen detection of weak samples. The R values of the weak samples were significantly higher than those of the negative (P<0.05, n=15; *significant differences compared with A antigen–negative sample; #significant differences compared with B antigen–negative sample). (D) CV analysis of the QD fluorescence assay. The CVs were less than 10%, indicating that the assay was reproducible (n=20). Abbreviations: QFA, quantum dot fluorescence assay; QD, quantum dot; RBC, red blood cell; CV, coefficient of variation.
Figure 5
Figure 5
R values of 791 clinical samples obtained by QFA. (A) R value distribution of A antigen–positive and –negative samples. The R value of A antigen was between 1.044 and 4.528. (B) R value distribution of B antigen–positive and –negative samples. The R value of B antigen ranged from 1.014 to 4.350. Abbreviation: QFA, quantum dot fluorescence assay.

Similar articles

Cited by

  • Blood Group Testing.
    Li HY, Guo K. Li HY, et al. Front Med (Lausanne). 2022 Feb 11;9:827619. doi: 10.3389/fmed.2022.827619. eCollection 2022. Front Med (Lausanne). 2022. PMID: 35223922 Free PMC article. Review.

References

    1. Figueras-Aloy J, Rodríguez-Miguélez JM, Iriondo-Sanz M, Salvia-Roiges MD, Botet-Mussons F, Carbonell-Estrany X. Intravenous immunoglobulin and necrotizing enterocolitis in newborns with hemolytic disease. Pediatrics. 2010;125(1):139–144. - PubMed
    1. Zuppa AA, Cardiello V, Lai M, Cataldi L, D’Andrea V, Romagnoli C. ABO hemolytic disease of the fetus and newborn: an iatrogenic complication of heterologous assisted reproductive technology-induced pregnancy. Transfusion. 2010;50(10):2102–2104. - PubMed
    1. Bhat RY, Kumar PC. Sixth hour transcutaneous bilirubin predicting significant hyperbilirubinemia in ABO incompatible neonates. World J Pediatr. 2014;10(2):182–185. - PubMed
    1. Doyle B, Quigley J, Lambert M, et al. A correlation between severe haemolytic disease of the fetus and newborn and maternal ABO blood group. Transfus Med. 2014;24(4):239–243. - PubMed
    1. Yogev-Lifshitz M, Leibovitch L, Schushan-Eisen I, Taran C, Strauss T, Maayan-Metzger A. Indication of mild hemolytic reaction among preterm infants with ABO incompatibility. Pediatr Blood Cancer. 2016;63(6):1050–1053. - PubMed

MeSH terms

Substances