

Shared and Differential Retinal Responses against Optic Nerve Injury and Ocular Hypertension
- PMID: 28491019
- PMCID: PMC5405145
- DOI: 10.3389/fnins.2017.00235
Shared and Differential Retinal Responses against Optic Nerve Injury and Ocular Hypertension
Abstract
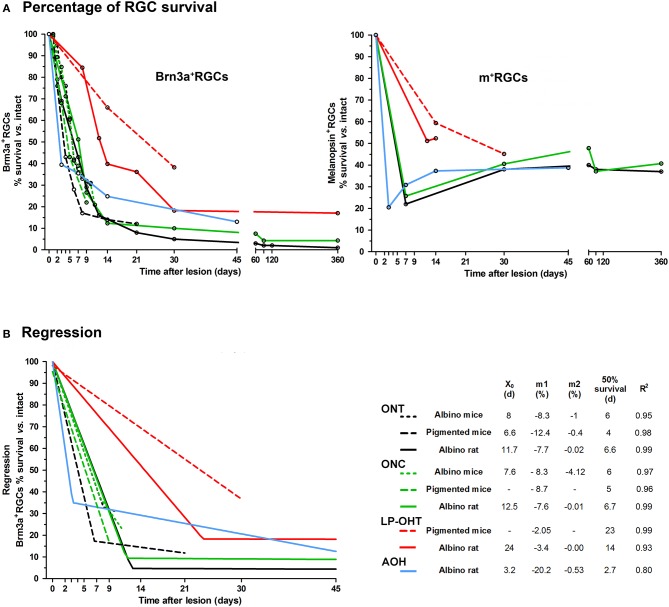
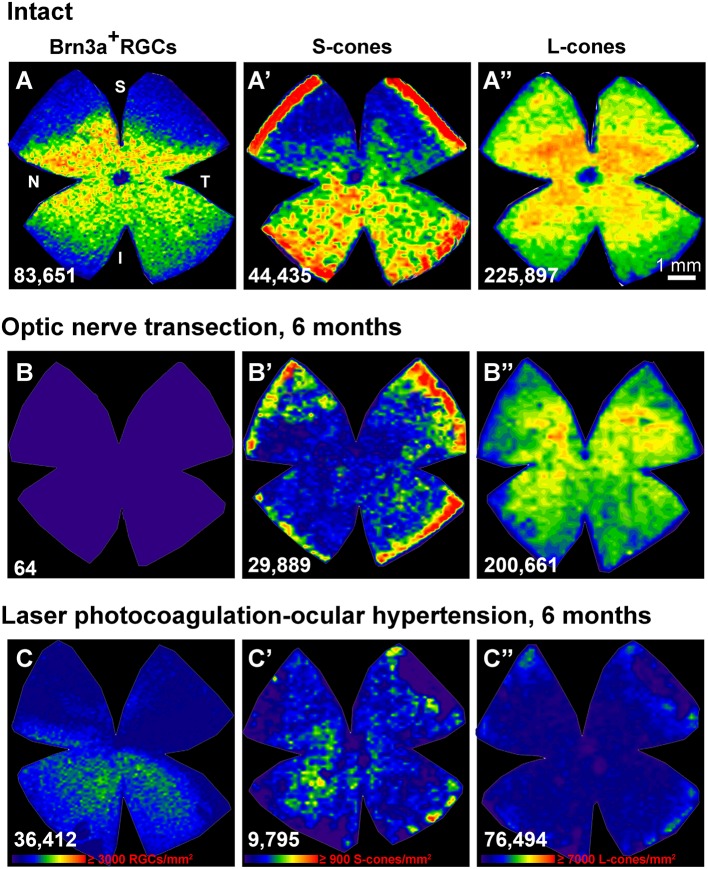
Glaucoma, one of the leading causes of blindness worldwide, affects primarily retinal ganglion cells (RGCs) and their axons. The pathophysiology of glaucoma is not fully understood, but it is currently believed that damage to RGC axons at the optic nerve head plays a major role. Rodent models to study glaucoma include those that mimic either ocular hypertension or optic nerve injury. Here we review the anatomical loss of the general population of RGCs (that express Brn3a; Brn3a+RGCs) and of the intrinsically photosensitive RGCs (that express melanopsin; m+RGCs) after chronic (LP-OHT) or acute (A-OHT) ocular hypertension and after complete intraorbital optic nerve transection (ONT) or crush (ONC). Our studies show that all of these insults trigger RGC death. Compared to Brn3a+RGCs, m+RGCs are more resilient to ONT, ONC, and A-OHT but not to LP-OHT. There are differences in the course of RGC loss both between these RGC types and among injuries. An important difference between the damage caused by ocular hypertension or optic nerve injury appears in the outer retina. Both axotomy and LP-OHT induce selective loss of RGCs but LP-OHT also induces a protracted loss of cone photoreceptors. This review outlines our current understanding of the anatomical changes occurring in rodent models of glaucoma and discusses the advantages of each one and their translational value.
Keywords: Brn3a retinal ganglion cells; acute ocular hypertension; axotomy; chronic ocular hypertension; cone photoreceptors; glaucoma; melanopsin retinal ganglion cells; retinal nerve fiber layer.
Figures

Similar articles
-
Ocular hypertension impairs optic nerve axonal transport leading to progressive retinal ganglion cell degeneration.Exp Eye Res. 2010 Jan;90(1):168-83. doi: 10.1016/j.exer.2009.10.003. Epub 2009 Oct 14. Exp Eye Res. 2010. PMID: 19835874
-
Survival of melanopsin expressing retinal ganglion cells long term after optic nerve trauma in mice.Exp Eye Res. 2018 Sep;174:93-97. doi: 10.1016/j.exer.2018.05.029. Epub 2018 May 29. Exp Eye Res. 2018. PMID: 29856984
-
BDNF Rescues RGCs But Not Intrinsically Photosensitive RGCs in Ocular Hypertensive Albino Rat Retinas.Invest Ophthalmol Vis Sci. 2015 Feb 26;56(3):1924-36. doi: 10.1167/iovs.15-16454. Invest Ophthalmol Vis Sci. 2015. PMID: 25722208
-
Retinal neurodegeneration in experimental glaucoma.Prog Brain Res. 2015;220:1-35. doi: 10.1016/bs.pbr.2015.04.008. Epub 2015 Jul 2. Prog Brain Res. 2015. PMID: 26497783 Review.
-
Understanding glaucomatous damage: anatomical and functional data from ocular hypertensive rodent retinas.Prog Retin Eye Res. 2012 Jan;31(1):1-27. doi: 10.1016/j.preteyeres.2011.08.001. Epub 2011 Sep 21. Prog Retin Eye Res. 2012. PMID: 21946033 Review.
Cited by
-
Mechanisms implicated in the contralateral effect in the central nervous system after unilateral injury: focus on the visual system.Neural Regen Res. 2021 Nov;16(11):2125-2131. doi: 10.4103/1673-5374.310670. Neural Regen Res. 2021. PMID: 33818483 Free PMC article. Review.
-
Mouse model of ocular hypertension with retinal ganglion cell degeneration.PLoS One. 2019 Jan 14;14(1):e0208713. doi: 10.1371/journal.pone.0208713. eCollection 2019. PLoS One. 2019. PMID: 30640920 Free PMC article.
-
Differential response of injured and healthy retinas to syngeneic and allogeneic transplantation of a clonal cell line of immortalized olfactory ensheathing glia: a double-edged sword.Neural Regen Res. 2025 Aug 1;20(8):2395-2407. doi: 10.4103/NRR.NRR-D-23-01631. Epub 2024 May 13. Neural Regen Res. 2025. PMID: 39359096 Free PMC article.
-
Intraocular Delivery of a Collagen Mimetic Peptide Repairs Retinal Ganglion Cell Axons in Chronic and Acute Injury Models.Int J Mol Sci. 2022 Mar 8;23(6):2911. doi: 10.3390/ijms23062911. Int J Mol Sci. 2022. PMID: 35328332 Free PMC article.
-
Nfe2l3 promotes neuroprotection and long-distance axon regeneration after injury in vivo.Exp Neurol. 2024 May;375:114741. doi: 10.1016/j.expneurol.2024.114741. Epub 2024 Feb 21. Exp Neurol. 2024. PMID: 38395216 Free PMC article.
References
-
- Abbott C. J., Choe T. E., Lusardi T. A., Burgoyne C. F., Wang L., Fortune B. (2014). Evaluation of retinal nerve fiber layer thickness and axonal transport 1 and 2 weeks after 8 hours of acute intraocular pressure elevation in rats. Invest. Ophthalmol. Vis. Sci. 55, 674–687. 10.1167/iovs.13-12811 - DOI - PMC - PubMed
-
- Agudo M., Pérez-Marín M. C., Sobrado-Calvo P., Lönngren U., Salinas-Navarro M., Cánovas I., et al. . (2009). Immediate upregulation of proteins belonging to different branches of the apoptotic cascade in the retina after optic nerve transection and optic nerve crush. Invest. Ophthalmol. Vis. Sci. 50, 424–431. 10.1167/iovs.08-2404 - DOI - PubMed
Publication types
LinkOut - more resources
Full Text Sources
Other Literature Sources