. 2017 Apr 26:10:122.
doi: 10.3389/fnmol.2017.00122. eCollection 2017.

Characterization of the Transcriptomes of Lgr5+ Hair Cell Progenitors and Lgr5- Supporting Cells in the Mouse Cochlea

Affiliations

Characterization of the Transcriptomes of Lgr5+ Hair Cell Progenitors and Lgr5- Supporting Cells in the Mouse Cochlea

Cheng Cheng et al. Front Mol Neurosci. .

Abstract

Cochlear supporting cells (SCs) have been shown to be a promising resource for hair cell (HC) regeneration in the neonatal mouse cochlea. Previous studies have reported that Lgr5+ SCs can regenerate HCs both in vitro and in vivo and thus are considered to be inner ear progenitor cells. Lgr5+ progenitors are able to regenerate more HCs than Lgr5- SCs, and it is important to understand the mechanism behind the proliferation and HC regeneration of these progenitors. Here, we isolated Lgr5+ progenitors and Lgr5- SCs from Lgr5-EGFP-CreERT2/Sox2-CreERT2/Rosa26-tdTomato mice via flow cytometry. As expected, we found that Lgr5+ progenitors had significantly higher proliferation and HC regeneration ability than Lgr5- SCs. Next, we performed RNA-Seq to determine the gene expression profiles of Lgr5+ progenitors and Lgr5- SCs. We analyzed the genes that were enriched and differentially expressed in Lgr5+ progenitors and Lgr5- SCs, and we found 8 cell cycle genes, 9 transcription factors, and 24 cell signaling pathway genes that were uniquely expressed in one population but not the other. Last, we made a protein-protein interaction network to further analyze the role of these differentially expressed genes. In conclusion, we present a set of genes that might regulate the proliferation and HC regeneration ability of Lgr5+ progenitors, and these might serve as potential new therapeutic targets for HC regeneration.

Keywords: RNA-Seq; differentiation; gene expression; proliferation; regeneration; sphere.


Figures
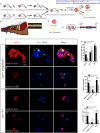
FIGURE 1
FIGURE 1
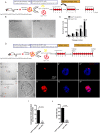
Lgr5+ HC progenitors generate more HCs compared to Lgr5- SCs in vitro. (A) We crossed the Lgr5-EGFP-CreERT2/Rosa26-tdTomato mice with Sox2-CreERT2/Rosa26-tdTomato mice to get the Lgr5-EGFP-CreERT2/Sox2-CreERT2/Rosa26-tdTomato triple-positive mice. We used the tdTomato channel to sort out all of the Sox2+ SCs, and then we used the FITC channel to separate the tdTomato/EGFP double-positive Lgr5+ progenitors from the other tdTomato+ but EGFP- SCs. Because Lgr5+ progenitors expressed both EGFP and tdTomato, the yellow dots represent the Lgr5+ progenitor cells. (B) Schematic depicting cell types in the P0–P3 cochlea. Lgr5+ progenitor cells were labeled in yellow and the Lgr5- SCs were labeled in red. DC, Deiters’ cells; PC, inner pillar cells; IPC, inner phalangeal cells; GER, the lateral greater epithelial ridge; BC, Boettcher cells; CC, Claudius cells; HEC, Hensen’s cells; SGN, spiral ganglion neuron. (C) We cultured the sorted EGFP+ cells at 50 cells/μl and added EdU from day 4 to 7. The total culture time was 10 days. (D) Lgr5+ progenitors generated a large number of Myo7a+ cells on the inside of the colony, and some of them were co-labeled with EdU. (E) Lgr5+ progenitors also generated some Myo7a+ cells outside of the colony. (F,G) Lgr5- SCs generated fewer Myo7a+ cells inside of the colony and outside of the colony, and few of them were co-labeled with EdU. (H) The number of colonies in each well per 5,000 cells. The Lgr5+ progenitors formed around 24 Myo7a+ colonies and 30 Myo7a- colonies, while the Lgr5- SCs formed around 11 Myo7a+ colonies and 40 Myo7a- colonies. (I) Both inside and outside of the colony, Lgr5+ progenitors formed more Myo7a+ cells compared with Lgr5- SCs. (J) In Lgr5+ progenitors, some of the Myo7a+ cells were co-labeled with EdU inside of the colony and outside of the colony (p < 0.05, ∗∗p < 0.01, ∗∗∗p < 0.001, n = 3. Scale bars are 20 μm in D–G).
FIGURE 2
FIGURE 2
Lgr5+ progenitors have greater sphere-forming ability than Lgr5- SCs. (A) Tamoxifen was injected at P3, and the mice were harvested at P5. FACS was used to isolate the Lgr5+ progenitors and Lgr5- SCs, and these cells were cultured for 5 days and passaged to the next generation. (B) Lgr5+ progenitors generated significantly more spheres than Lgr5- SCs. (C) Lgr5+ progenitors had a significantly higher rate of expansion than Lgr5- SCs. (D) The cultured cells in the first generation were used for the differentiation assay. (E,E’) The Differential Interference Contrast microscope configuration (DIC) pictures show the low magnification (E) and high magnification (E’) images of the spheres formed by Lgr5- SCs. (G,G’) The DIC pictures show the low magnification (G) and high magnification (G’) images of the spheres formed by Lgr5+ progenitors. (F,F”) An Lgr5- sphere stained with the HC marker Myo7a. (F’) Represents the sphere stained with DAPI, (F”) represents merged image. (H,H”) An Lgr5+ sphere stained with the HC marker Myo7a. (H’) Represents the sphere stained with DAPI and (H”) shows the merged image. (I) The average number of HCs generated by each sphere. (J) The total number of hair cells generated by 200 Lgr5+ progenitors or Lgr5- SCs. p < 0.05, ∗∗p < 0.01, ∗∗∗p < 0.001, n = 3. Scale bars are 20 μm in (E,F).
FIGURE 3
FIGURE 3
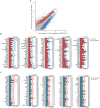
Top 200 genes highly expressed in Lgr5+ progenitors and Lgr5- SCs. (A) Sample clustering analysis for all replicates of Lgr5+ progenitors and Lgr5- SCs. (B) Venn diagram showing genes expressed in Lgr5+ progenitors and Lgr5- SCs. (C) The top 200 genes that are highly expressed in Lgr5- SCs ranked in descending order. The number in blue on the right side of each panel represents the same gene ranking in Lgr5+ progenitors. (D) The top 200 genes highly expressed in Lgr5+ progenitors ranked in descending order. The number in red on the right side of each panel represents the same gene ranking in Lgr5- SCs.
FIGURE 4
FIGURE 4
The differentially expressed genes in Lgr5+ progenitors and Lgr5- SCs. (A) All expressed transcripts in Lgr5- SCs and Lgr5+ progenitors. The blue dots represent the highly differentially expressed genes in Lgr5+ progenitors, the red dots represent the highly differentially expressed genes in Lgr5- SCs, and the gray dots represent the genes that are highly expressed in both Lgr5- SCs and Lgr5+ progenitors. (B) The top 150 highly differentially expressed genes in Lgr5+ progenitors ranked in descending order. The number on the right of each panel represents the fold difference in expression for Lgr5+ progenitors versus Lgr5- SCs. (C) The top 150 highly differentially expressed genes in Lgr5- SCs ranked in descending order. The number on the right of each panel represents the fold difference in expression for Lgr5- SCs versus Lgr5+ progenitors.
FIGURE 5
FIGURE 5
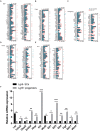
Cell cycle genes and transcription factors in Lgr5- SCs and Lgr5+ progenitors. (A) The expression of 80 genes involved in the cell cycle in Lgr5- SCs and Lgr5+ progenitors. (B) The expression of 83 transcription factor genes in Lgr5- SCs and Lgr5+ progenitors. In (A,B), the gene names in red on the left of each panel represent the genes that are uniquely detected in Lgr5- SCs, and the blue names represent the genes that are uniquely detected in Lgr5+ progenitors. The number in red on the right of each panel represents the fold difference in expression for Lgr5- SCs versus Lgr5+ progenitors, and the blue number on the right of each panel represents the fold difference in expression for Lgr5+ progenitors versus Lgr5- SCs. (C) q-PCR analysis of the cell cycle genes. (D) q-PCR analysis of the transcription factors. p < 0.05, ∗∗p < 0.01, ∗∗∗p < 0.001, n = 3.
FIGURE 6
FIGURE 6
Signaling pathway genes in Lgr5- SCs and Lgr5+ progenitors. The differentially expressed genes in Lgr5- SCs and Lgr5+ progenitors that are involved in (A) EGF, (B) Hippo, (C) Hedgehog, (D) Notch, and (E) Wnt signaling pathways. The gene names in red on the left of each panel represent the genes uniquely detected in Lgr5- SCs, and the names in blue represent the genes uniquely detected in Lgr5+ progenitors. The number in red on the right of each panel represents the fold difference in expression for Lgr5- SCs versus Lgr5+ progenitors, and the number in blue on the right of each panel represents the fold difference in expression for Lgr5+ progenitors versus Lgr5- SCs. (F) q-PCR analysis of the EGF, Hippo, Hedgehog, Notch, and Wnt signaling pathway genes. p < 0.05, ∗∗p < 0.01, ∗∗∗p < 0.001, n = 3.
FIGURE 7
FIGURE 7
Gene ontology and network analysis of the genes differentially expressed in Lgr5+ progenitors and Lgr5- SCs and the PCA analysis. (A) The functions of genes upregulated in Lgr5- SCs. (B) The function of genes upregulated in Lgr5+ progenitors. (C) The STRING protein–protein interaction analysis of genes that are differentially expressed in Lgr5+ progenitors (blue) and Lgr5- SCs (red).

Similar articles

Cited by

References

    1. Ahmed Z. M., Frolenkov G. I., Riazuddin S. (2013). Usher proteins in inner ear structure and function. Physiol. Genomics 45 987–989. 10.1152/physiolgenomics.00135.2013 - DOI - PMC - PubMed
    1. Alvarado D. M., Hawkins R. D., Bashiardes S., Veile R. A., Ku Y. C., Powder K. E., et al. (2011). An RNA interference-based screen of transcription factor genes identifies pathways necessary for sensory regeneration in the avian inner ear. J. Neurosci. 31 4535–4543. 10.1523/JNEUROSCI.5456-10.2011 - DOI - PMC - PubMed
    1. Andreeva A., Lee J., Lohia M., Wu X., Macara I. G., Lu X. (2014). PTK7-Src signaling at epithelial cell contacts mediates spatial organization of actomyosin and planar cell polarity. Dev. Cell 29 20–33. 10.1016/j.devcel.2014.02.008 - DOI - PMC - PubMed
    1. Balak K. J., Corwin J. T., Jones J. E. (1990). Regenerated hair cells can originate from supporting cell progeny: evidence from phototoxicity and laser ablation experiments in the lateral line system. J. Neurosci. 10 2502–2512. - PMC - PubMed
    1. Barker N., van Es J. H., Kuipers J., Kujala P., van den Born M., Cozijnsen M., et al. (2007). Identification of stem cells in small intestine and colon by marker gene Lgr5. Nature 449 1003–1007. 10.1038/nature06196 - DOI - PubMed