. 2017 Apr 26:11:62.
doi: 10.3389/fnbeh.2017.00062. eCollection 2017.

Change of Rin1 and Stathmin in the Animal Model of Traumatic Stresses

Affiliations

Change of Rin1 and Stathmin in the Animal Model of Traumatic Stresses

Fang Han et al. Front Behav Neurosci. .

Abstract

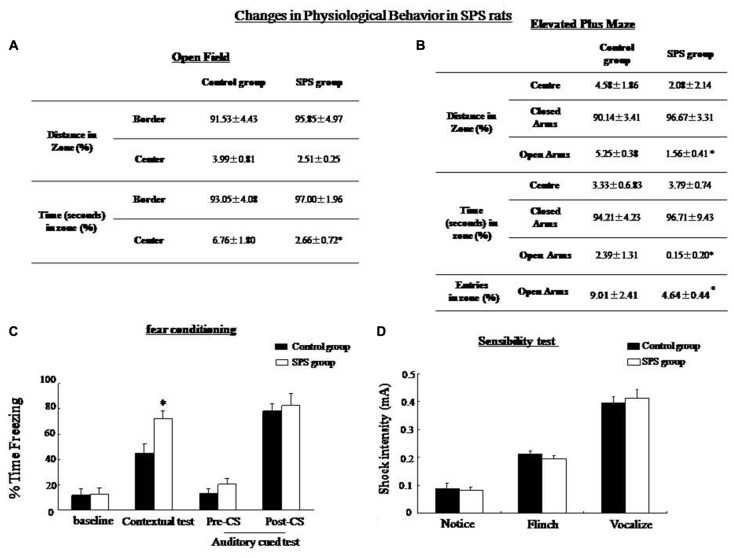
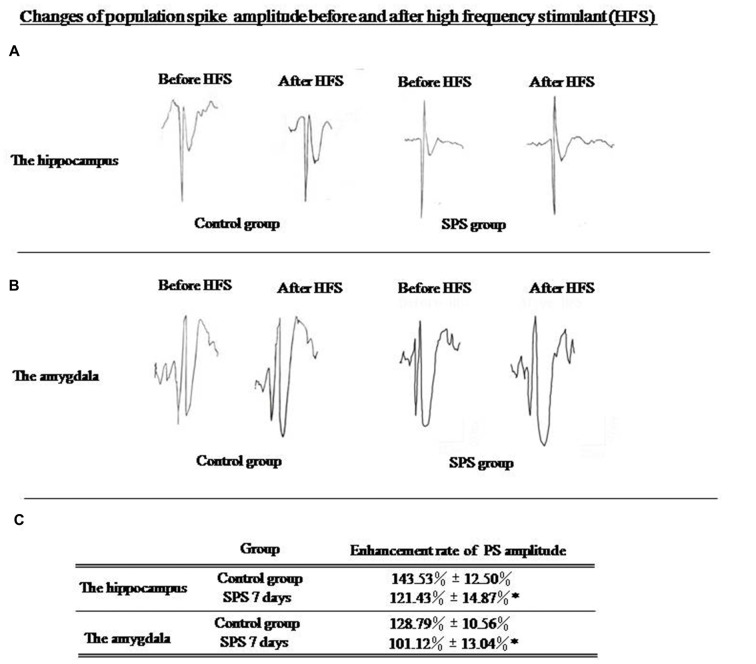
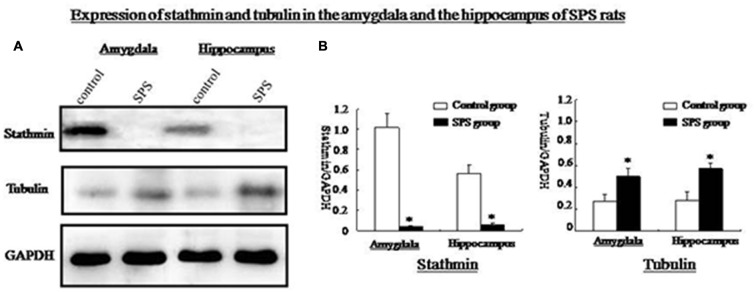
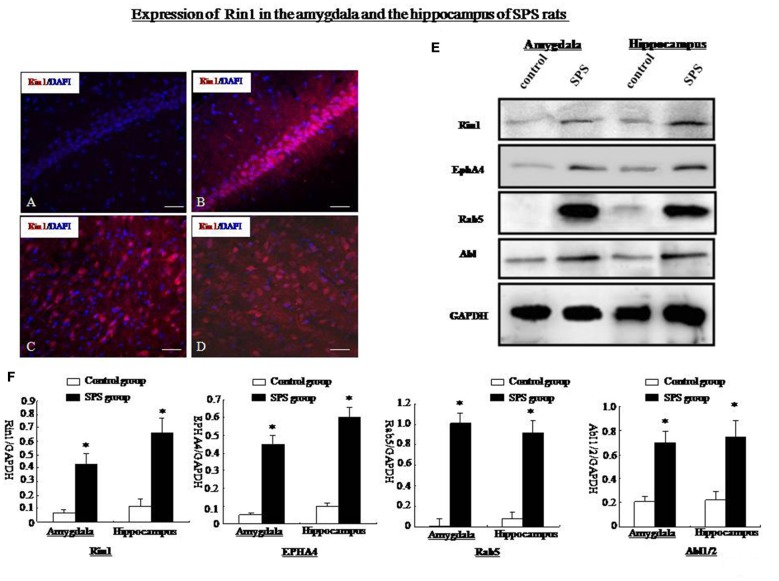
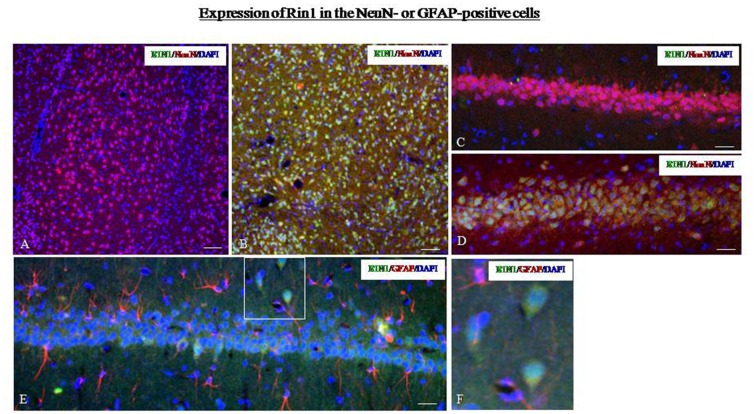
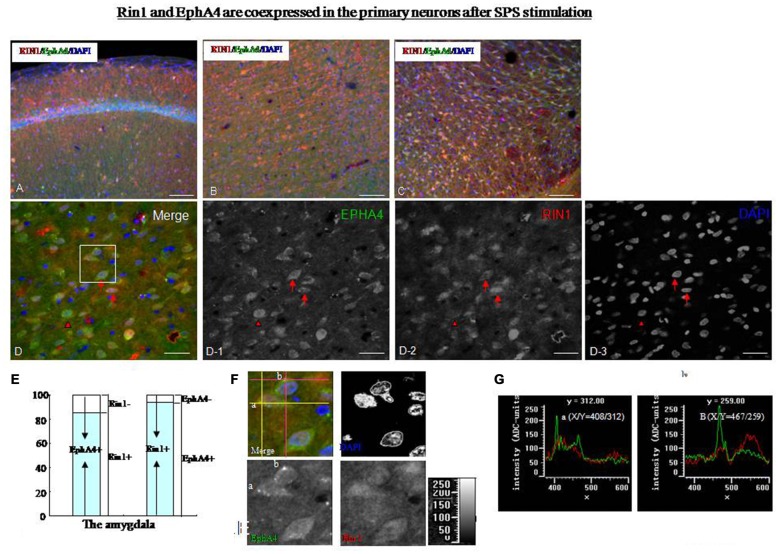
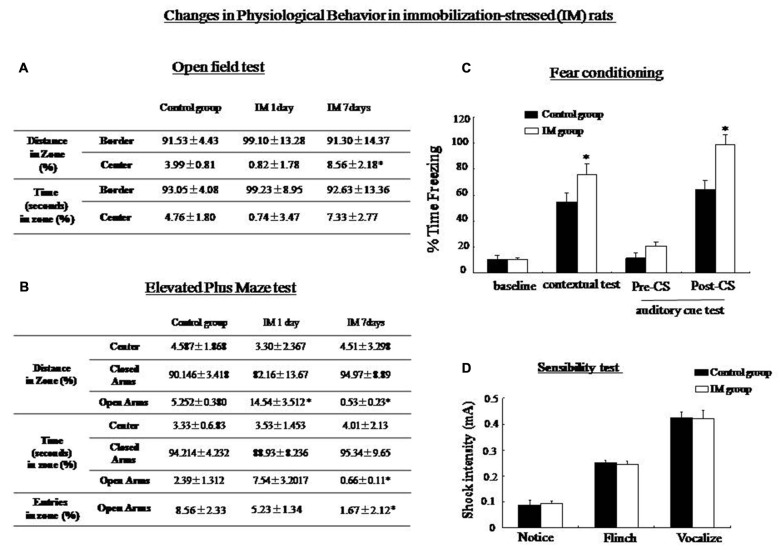
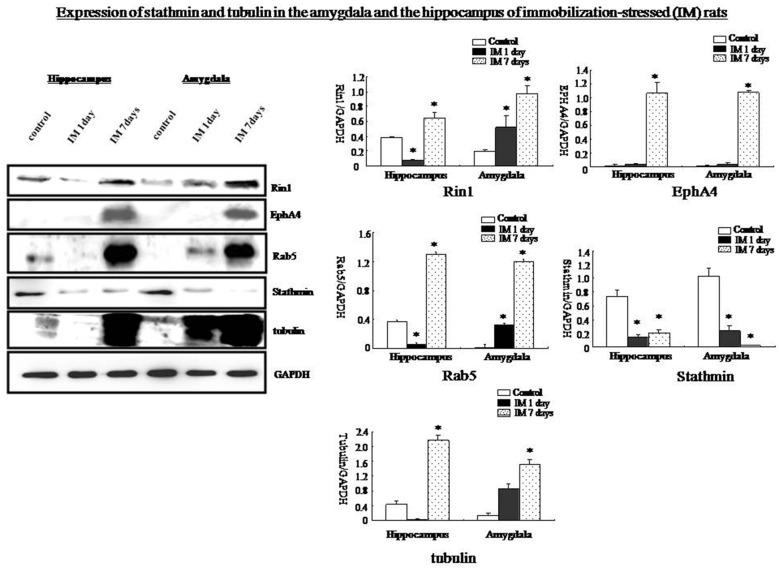
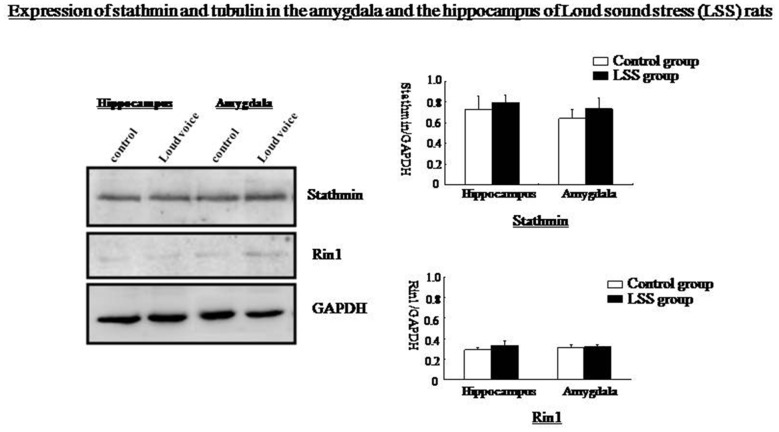
The molecular mechanism of fear memory is poorly understood. Therefore, the pathogenesis of post-traumatic stress disorder (PTSD), whose symptom presentation can enhance fear memory, remains largely unclear. Recent studies with knockout animals have reported that Rin1 and stathmin regulate fear memory. Rin1 inhibits acquisition and promotes memory extinction, whereas stathmin regulates innate and basal fear. The aim of our study was to examine changes in the expression of Rin1 and stathmin in different animal models of stress, particluarly traumatic stress. We used three animal traumatic stresses: single prolonged stress (SPS, which is a rodent model of PTSD), an immobilization-stress (IM) and a Loud sound stress (LSS), to examine the change and uniqueness in Rin1/stathmin expression. Behavioral tests of SPS rats demonstrated increased anxiety and contextual fear-conditioning. They showed decreased long-term potentiation (LTP), as well as decreased stathmin and increased Rin1 expression in the hippocampus and the amygdala. Expression of the stathmin effector, tubulin, and downstream molecules Rin1, Rab5, and Abl, appeared to increase. Rin1 and EphA4 were endogenously coexpressed in primary neurons after SPS stimulation. IM rats exhibited increased anxiety behavior and enhanced fear-conditioning to contextual and auditory stimuli. Similar changes in expression of Rin1/stathmin were observed in IM rats whereas no changes were observed in rats exposed to a loud sound. These data suggest that changes in expression of the Rin1 and stathmin genes may be involved in rodents with SPS and IM stresses, which provide valuable insight into fear memories under abnormal conditions, particularly in PTSD.

Keywords: Rin1; fear memory; post-traumatic disorder; single prolonged stress; stathmin; traumatic stress.


Figures

Figure 1
Figure 1
Single prolonged stress (SPS) rats showed decreased exploratory behavior in an open field (OF) test and an elevated plus maze. (A) OF test: SPS rats (n = 10) spent less time in the center zone and showed less rearing compared with the control group (n = 10). (B) Elevated plus maze: SPS rats spend shorter distances and spent less number/time in the open arms compared with control rats. (C) Conditioning test: the percentage of time spent freezing in contextual fear conditioning was significantly higher in the SPS rats than in the control rats (*P < 0.05 vs. the control group), but no difference in auditory cue memory between control and SPS groups. (D) Sensibility test to the foot-shock, no significant difference in minimum current strength which induced notice, flinch and vocalize was found between control and SPS rats.
Figure 2
Figure 2
(A) Evoked population spike (PS) wave formed before and after high frequency stimulation (HFS) in hippocampus; (B) Evoked PS wave formed before and after high frequency stimulation (HFS) in amygdala. (C) SPS rats showed significantly decreased enhancement of evoked PS amplitude in hippocampus and amygdala compared with control rats (*P < 0.05 vs. the control group).
Figure 3
Figure 3
(A) Western blot analysis of stathmin and tubulin in amygdala and hippocampus from control and SPS groups. (B) Quantification of western blots showed that, stathmin was significantly decreased while tubulin was remarkably increased in both brain regions of SPS rats compared with control rats (*P < 0.05 vs. the control group).
Figure 4
Figure 4
Expression of stathmin and tubulin in the hippocampus. (A) Dual-immunofluorescence image showing stathmin-ir and glial fibrillary acid protein (GFAP)-ir in the hippocampus of the control group. (B) A higher magnification image showing colocalization of stathmin-ir and GFAP-ir in the hippocampus of the control group. (C) Dual-immunofluorescence image showing stathmin-ir and NeuN-ir in the amygdala of the control group. (D) Dual-immunofluorescence image showing stathmin-ir and NeuN-ir in the cingulate cortex of the control group. (E) A higher magnification image showing colocalization of stathmin-ir and NeuN-ir in the amygdala of the control group. (F) A higher magnification image showing decreased stathmin in the amygdala of the SPS group. (G,H) Expression of tubulin in the amygdala of the control group (G) and the SPS group (H). (I,J) Colocalization of stathmin- and tubulin-ir in the hippocampal CA1 region of control (I) and SPS group (J). The magnification image of colocalzation of stahtmin- and tubulin-ir were showed in the I-a (merge), I-b (stathmin), I-c (tubulin0 and I-d (DAPI; *P < 0.05 vs. the control group; Bar in (B,D–F,I,J: 100 μm; Bar in A,C,G,H: 20 μm).
Figure 5
Figure 5
(A) Rin1-ir in the hippocampus of the control group. (B) Rin1-ir in the hippocampus of the SPS group. (C) Rin1-ir in the amygdala of the SPS group. (D) Rin1-ir in the cingulate cortex of the SPS group. (E) Western blots showing expression of Rin1, EphA4, Rab5, and Abl in the amygdala and hippocampus of both groups. (F) Quantification of western blots showing higher expression of Rin1, EphA4, Rab5, and Abl in the amygdala and hippocampus of the SPS group compared with the control group (*P < 0.05 vs. the control group; Bar: 20 μm).
Figure 6
Figure 6
(A,B) Dual-immunofluorescence images for Rin1-ir and NeuN-ir in the amygdala of the control (A) and SPS (B) groups. (C,D) Dual-immunofluorescence images for Rin1-ir and NeuN-ir in the hippocampus of the control (C) and SPS (D) groups. (E) Rin1-ir in GFAP-positive cells in the hippocampus of SPS rats. (F) A higher magnification image of the area in the white box in panel (E) (Bar in A,B: 100 μm; Bar in C–E: 50 μm).
Figure 7
Figure 7
(A–C) Dual-immunofluorescence images showing that Rin1-ir and EphA4-ir were colocalized in the hippocampus (A), cingulate cortex (B), and thalamus (C) of SPS rats. (D) Higher magnification image of the amygdala shows colocalization of Rin1/EphA4 (arrow) and EphA4- or Rin1- positive cells (arrowhead). EPHA4: D-1; RIN1: D-2; DAPI: D-3. (E) Statistical analysis indicated that about 88% of EphA4-positive cells were Rin1-positive, and 93% of Rin1-positive cells were EphA4-positive in the amygdala. (F) Higher magnification images of the area in the white box in panel (D). Some bright clusters were detected (merge). Two clusters (a and b) were selected by positioning the coordinates (a: intersection of two yellow lines; b: intersection of two pink lines). (G) Intensity of points a and b. The green line shows the intensity of EphA4, and the red line shows the intensity of Rin1. EphA4 was expressed at peak intensity at points a (X/Y = 408/312) and b (X/Y = 467/259; *P < 0.05 vs. the control group; Bar in A–C: 100 μm; Bar in D: 20 μm).
Figure 8
Figure 8
(A) Open-field test: The immobilization (IM)-stressed rats showed a greater percentage of distance in the border zone compared with control rats. (B) Elevated plus maze: IM-stressed rats showed shorter distance, less time and less entry number in the open arm compared with control rats. (C) Conditioning test: The percentage of time spent freezing in contextual and auditory cue fear conditioning (post-CS) were significantly higher in the IM rats than in the control rats (*P < 0.05 vs. the control group). No significant difference was observed in baseline and pre-CS of the auditory cue fear conditioning between control and IM rats. (D) sensibility test to the foot-shock, no significant difference in minimum current strength which induced notice, flinch and vocalize was found between control and IM rats.
Figure 9
Figure 9
Western blots showing that Rin1, EphA4, Abl, Rab5, and tubulin expression increased significantly in the amygdala and hippocampus 7 days after the IM-stress stimulation compared with the control rats; in contrast, stathmin expression decreased. Quantification of western blots showing lower expression of Rin1, EphA4, Rab5, and tubulin in the amygdala and hippocampus of the IM 1 day group and higher expression in the IM 7 days group compared with the control group except stathmin (*P < 0.05 vs. the control group).
Figure 10
Figure 10
Western blots showing no changes in stathmin or Rin1 expression after the loud sound stimulus.

Similar articles

Cited by

References

    1. Achesona D. T., Gresackb J. E., Risbrough V. B. (2012). Hippocampal dysfunction effects on context memory: possible etiology for posttraumatic stress disorder. Neuropharmacology 62, 674–685. 10.1016/j.neuropharm.2011.04.029 - DOI - PMC - PubMed
    1. Adami P., König P., Vetter Z., Hausmann A., Conca A. (2006). Posttraumatic stress disorder and amygdala-hippocampetomy. Acta Psychiatr. Scand. 113, 360–363; discussion 363–364. 10.1111/j.1600-0447.2005.00737.x - DOI - PubMed
    1. American Psychiatric Association (2013). The Diagnostic and Statistical Manual of Mental Disorders (DSM-5). 5th Edn. Arlington, VA: American Psychiatric Association.
    1. Belmont L. D., Mitchison T. J. (1996). Identification of a protein that interacts with tubulin dimers and increases the catastrophe rate of microtubules. Cell 84, 623–631. 10.1016/s0092-8674(00)81037-5 - DOI - PubMed
    1. Biaoxue R., Hua L., Wenlong G., Shuanying Y. (2016). Overexpression of stathmin promotes metastasis and growth of malignant solid tumors: a systemic review and meta-analysis. Oncotarget 29, 78994–79007. 10.18632/oncotarget.12982 - DOI - PMC - PubMed

LinkOut - more resources