

Case Reports
doi: 10.1016/j.hrcr.2015.12.001.
eCollection 2016 May.
Correlation between functional and ultrastructural substrate in Brugada syndrome
Affiliations
- PMID: 28491672
- PMCID: PMC5419737
- DOI: 10.1016/j.hrcr.2015.12.001
Item in Clipboard
Case Reports
Correlation between functional and ultrastructural substrate in Brugada syndrome
HeartRhythm Case Rep.
.
No abstract available
Keywords: Biopsy; Brugada syndrome; Electrocardiography; Electrophysiology study; Radiofrequency catheter ablation; Right ventricular outflow tract.
Figures
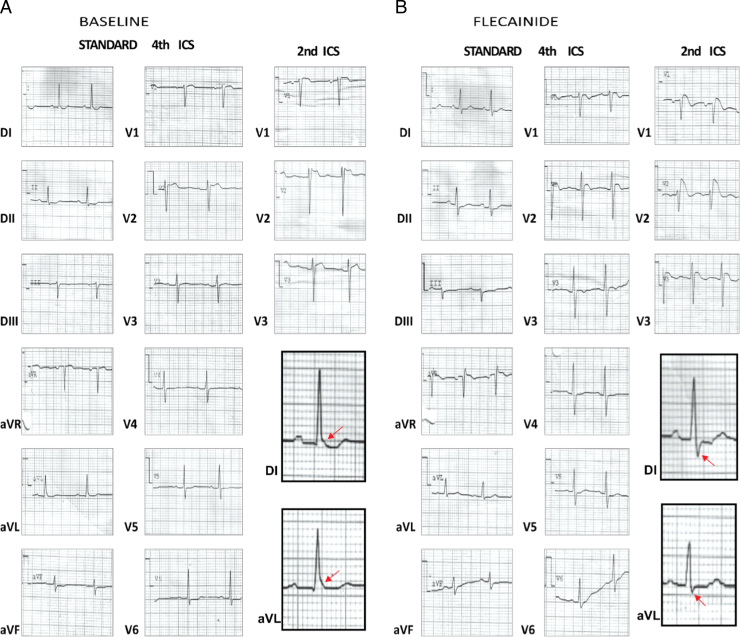
A: Twelve-lead electrocardiogram (ECG) tracings baseline: patent type 2 ECG (not diagnostic) displaying a PR interval of 200 milliseconds, QRS axis of 0°, QRS duration in V2 [fourth intercostal space (ICS)] of 120 milliseconds, QT/QTc of 360/383 milliseconds, the presence of an end-QRS slur with a descending ST segment in DI and horizontal in aVL, and saddleback-type ST-segment elevation observed in V2 (second ICS). Shift of right precordial leads in second higher ICSs does not reveal a type 1 patent ECG, but an increased saddleback-type ST-segment elevation is observed in V2. Note the presence of the end-QRS slur in DI and aVL, with a J-point peak ≥0.2 mV and descending ST segment in DI and horizontal in aVL (red arrows). B: Twelve-lead ECGs after oral administration of 400 mg of flecainide: In the third hour, the type 2 ECG is converted to the diagnostic type 1 patent ECG, which consists of a coved-type ST-segment elevation, observed in V2 of the standard 12-lead ECG (fourth ICS) and in V1, V2, and V3 recorded from the second ICS. Depolarization abnormalities are present as a prolonged PR interval of 210 milliseconds, QRS axis +8°, prolonged QRS duration in V2 of 150 milliseconds, and a high final R wave in aVR of 3 mm, consistent with right end conduction delay. Repolarization disorder can also be seen, with a prolonged QT/QTc interval of 420/481 milliseconds. Note the disappearance of the end-QRS slur in DI and aVL and the appearance of S waves and leveling ST segment (red arrows).
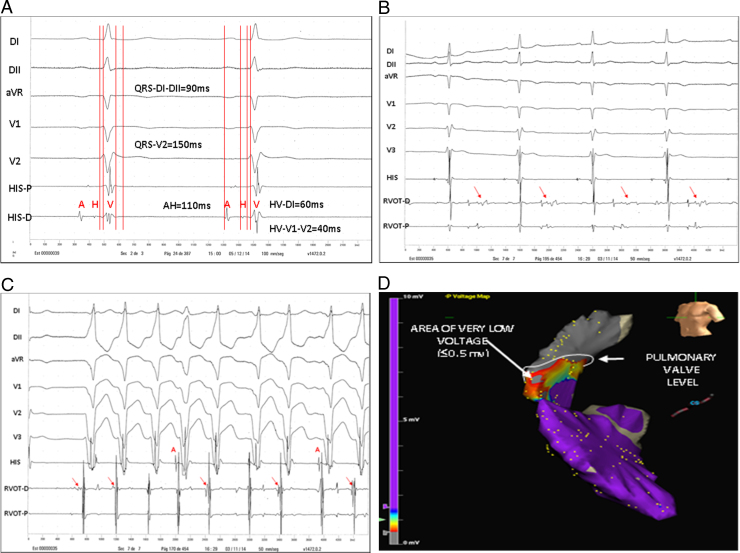
A: Baseline AH interval of 110 milliseconds, HV-DI of 60 milliseconds, and HV-V2 of 40 milliseconds; QRS duration in DII of 90 milliseconds and QRS duration in V2 of 150 milliseconds, indicating slow conduction in the right ventricular outflow tract (RVOT). B: Note the presence of middiastolic electrograms (EGMs) during sinus rhythm (red arrows). We identified areas that contained low-amplitude late potentials, corresponding to the anterior area of the high RVOT on the voltage map, where a systolic low-voltage EGM can also be seen in the proximal ablator. C: Spontaneous ventricular tachycardia from the RVOT and diastolic EGMs preceding the onset of the QRS complex can be seen (red arrows), which correspond to presystolic Purkinje-type potentials of low amplitude and high frequency preceding the QRS for 20 or 30 milliseconds. D. Voltage and electroanatomical maps, and the 3 areas of different voltage. HV-DI = HV interval measured DI; HV-V2 = HV interval measured V2; RVOT-D = distal right ventricular outflow tract; RVOT-P = proximal right ventricular outflow tract.
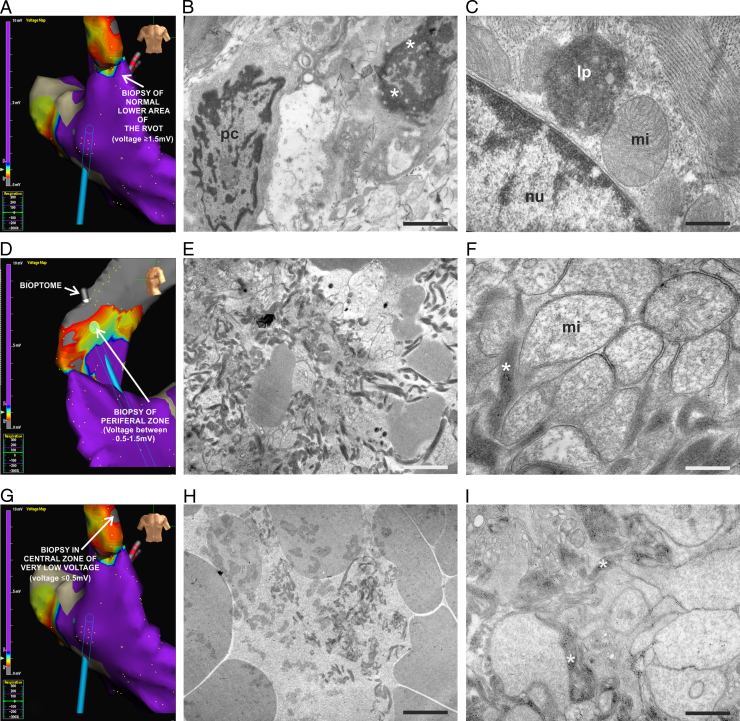
Endocardial biopsy by transmission electron microscopy. Voltage and electroanatomical map of A: normal lower area of the right ventricular outflow tract (voltage ≥ 1.5 mv), and B: Purkinje cell with abundant secretory vesicles in the normal lower area. Note that when approaching the pathological area, cytoplasmic disorganization, vacuolization (*) and myofibrillar remains in the adjacent cells were evident. C: Mitochondria showing normal crest, lipofuscin deposits near the myocyte nucleus and myofibrils with classic characteristics in normal lower area. D: Voltage and electroanatomical map of peripheral area (voltage between 0.5 and 1.5 mv). E: Myofibrillar and cellular remains in the peripheral area. F: Note the disappearance of the mitochondrial crests, mitochondrial swelling, and myofibrillar disorganization (*) in the same area. G: Voltage and electroanatomical map of central area (voltage ≤ 0.5 mv). Note the bioptome connected to the navigation system. H: Strong vacuolization and cell destruction in the central area. I: Intense cytoplasmic disorganization, vacuolization, and remains of myocardial fibers (*) in the central area. lp = lipofuscin deposits; mi = mitochondria; mf = myofibrils; nu = nucleus; pc = Purkinje cell. Scale bar: B 2.2 μm; C, F, I: 1.42 μm; E, H: 3.33 μm.
Similar articles
-
Brugada Syndrome Phenotype Elimination by Epicardial Substrate Ablation.Circ Arrhythm Electrophysiol. 2015 Dec;8(6):1373-81. doi: 10.1161/CIRCEP.115.003220. Epub 2015 Aug 19. Circ Arrhythm Electrophysiol. 2015. PMID: 26291334
-
Catheter ablation for electrical storm in Brugada syndrome: Results of substrate based ablation.Indian Heart J. 2018 Mar-Apr;70(2):296-302. doi: 10.1016/j.ihj.2017.07.019. Epub 2017 Aug 1. Indian Heart J. 2018. PMID: 29716710 Free PMC article.
-
Ablation of the epicardial substrate in the right ventricular outflow tract in a patient with Brugada syndrome refusing implantable cardioverter defibrillator therapy.Can J Cardiol. 2014 Oct;30(10):1249.e9-1249.e11. doi: 10.1016/j.cjca.2014.05.019. Epub 2014 Jun 2. Can J Cardiol. 2014. PMID: 25262866
-
Ablation for the treatment of Brugada syndrome: current status and future prospects.Expert Rev Med Devices. 2020 Feb;17(2):123-130. doi: 10.1080/17434440.2020.1719831. Epub 2020 Jan 27. Expert Rev Med Devices. 2020. PMID: 31986921 Review.
-
Management of outflow tract ventricular arrhythmias.Curr Opin Cardiol. 2015 Jan;30(1):50-7. doi: 10.1097/HCO.0000000000000122. Curr Opin Cardiol. 2015. PMID: 25389648 Review.
Cited by
-
Efficacy and safety of catheter ablation for Brugada syndrome: an updated systematic review.Clin Res Cardiol. 2023 Dec;112(12):1715-1726. doi: 10.1007/s00392-022-02020-3. Epub 2022 Apr 22. Clin Res Cardiol. 2023. PMID: 35451610 Free PMC article.
-
Catheter Ablation in Arrhythmic Cardiac Diseases: Endocardial and Epicardial Ablation.Rev Cardiovasc Med. 2022 Sep 19;23(9):324. doi: 10.31083/j.rcm2309324. eCollection 2022 Sep. Rev Cardiovasc Med. 2022. PMID: 39077706 Free PMC article. Review.
-
Morphological phenotype of right ventricular outflow tract is associated with cardiovascular outcomes and premature death.Sci Rep. 2024 Oct 24;14(1):25128. doi: 10.1038/s41598-024-77023-3. Sci Rep. 2024. PMID: 39448696 Free PMC article.
References
-
- Brugada P., Brugada J. Right bundle branch block, persistent ST segment elevation and sudden cardiac death: A distinct clinical and electrocardiographic syndrome: A multicenter report. J Am Coll Cardiol. 1992;20(6):1391–1396. - PubMed
-
- Bayés De Luna A., Brugada, Baranchuk A., Borggrefe M. Current electrocardiographic criteria for diagnosis of Brugada pattern: A consensus report [published correction appears in J Electrocardiol 2013;46(1):76] J Electrocardiol. 2012;45(5):433–442. - PubMed
-
- Frustaci A., Priori S.G., Pieroni M., Chimenti C., Napolitano C., Rivolta I., Sanna T., Bellocci F., Russo M.A. Cardiac histological substrate in patients with clinical phenotype of Brugada syndrome. Circulation. 2005;112(24):3680–3687. - PubMed
-
- Sánchez S.S., Genta S.B., Aybar M.J., Honoré S.M., Villecco E.I., Sánchez Riera A.N. Changes in the expression of small intestine extracellular matrix proteins in streptozotocin-induced diabetic rats. Cell Biol Int. 2000;24(12):881–888. - PubMed
Publication types
LinkOut - more resources
Full Text Sources
Other Literature Sources
