Review
. 2017 Apr 26:5:43.
doi: 10.3389/fcell.2017.00043. eCollection 2017.

Metabolic Reprogramming in Glioma

Affiliations
Review

Metabolic Reprogramming in Glioma

Marie Strickland et al. Front Cell Dev Biol. .

Abstract

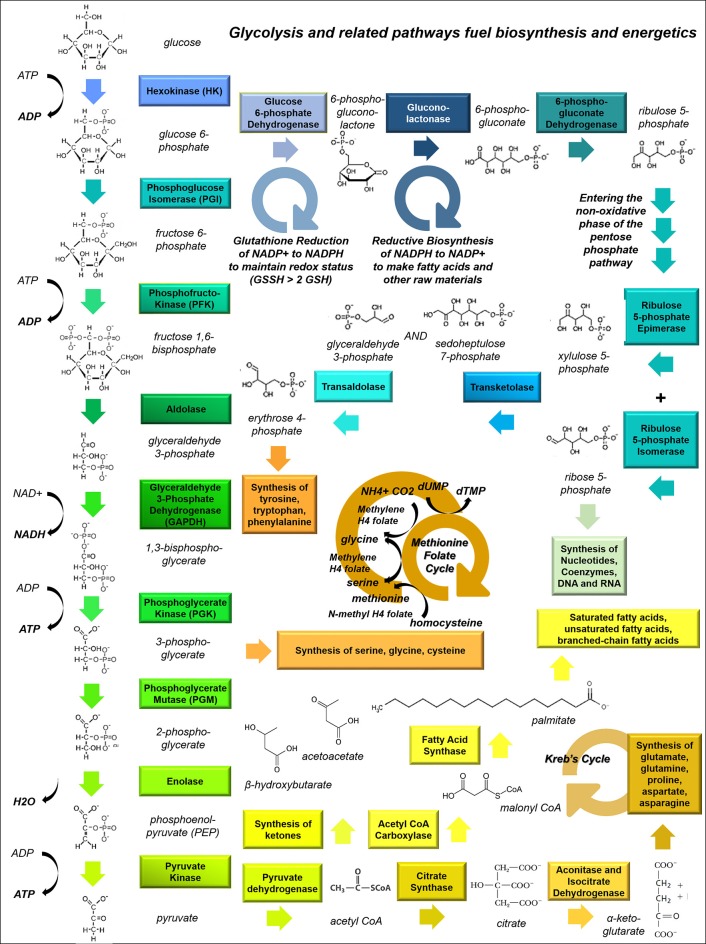
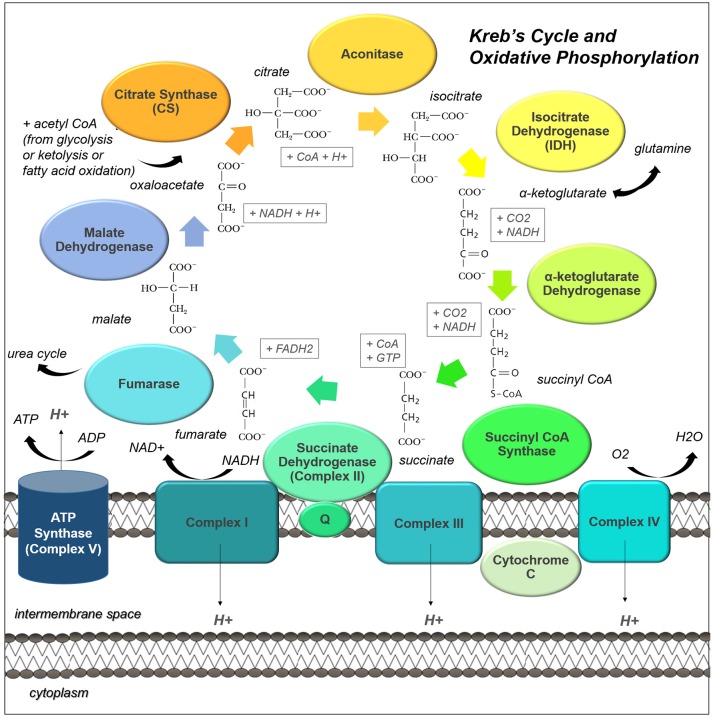
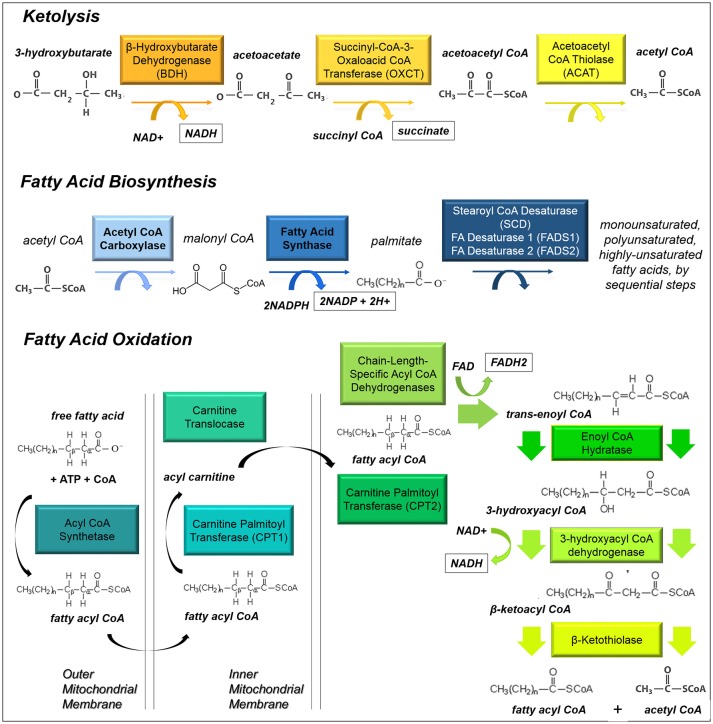
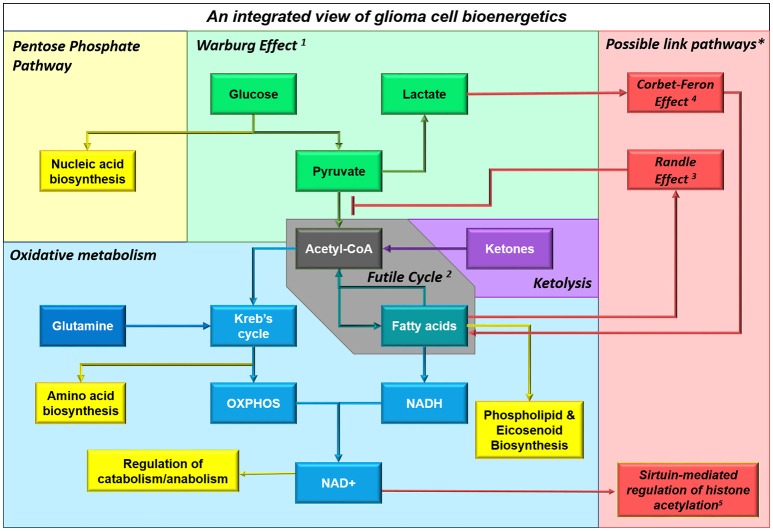
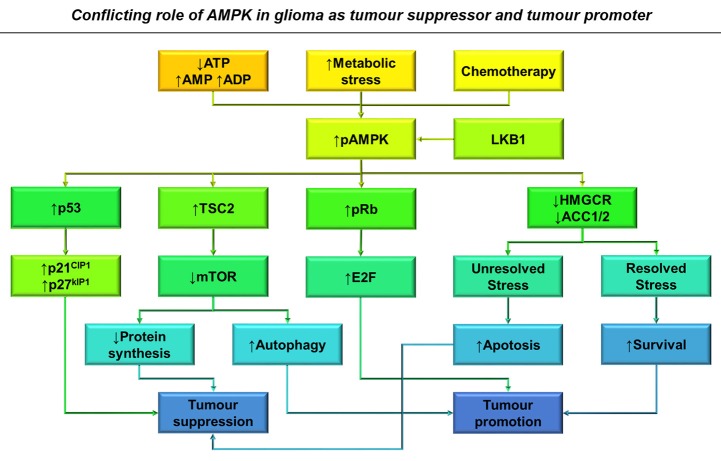
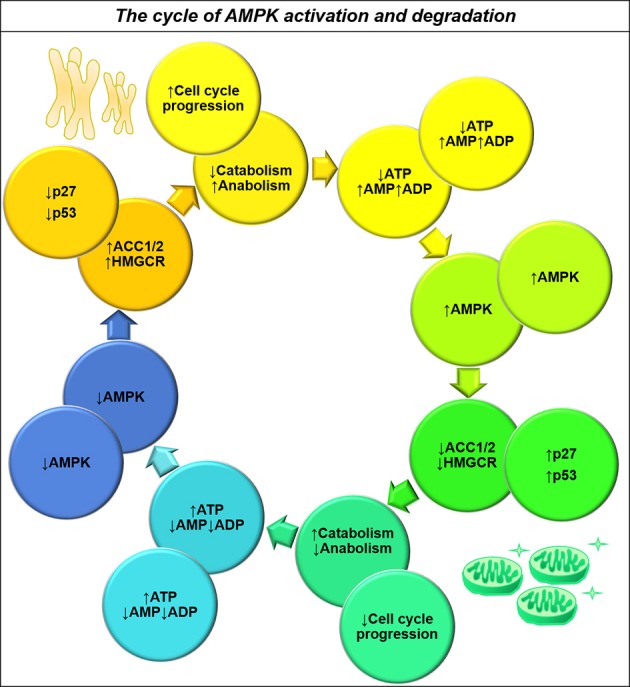
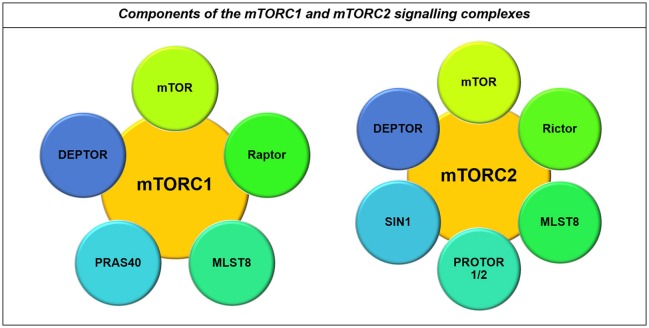
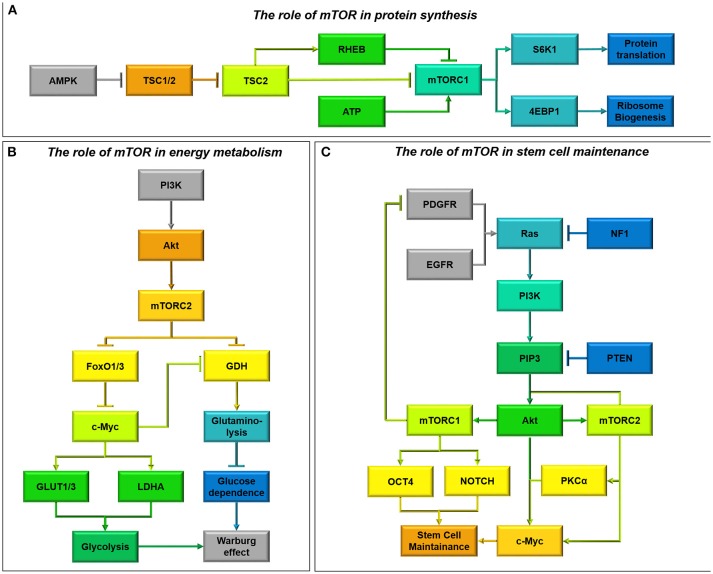
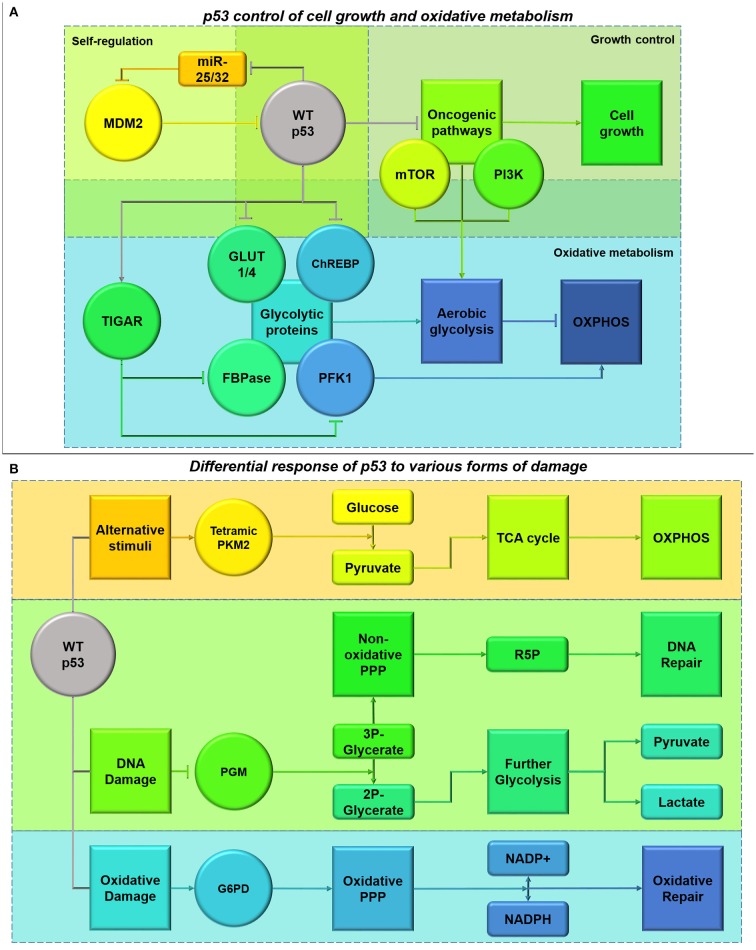
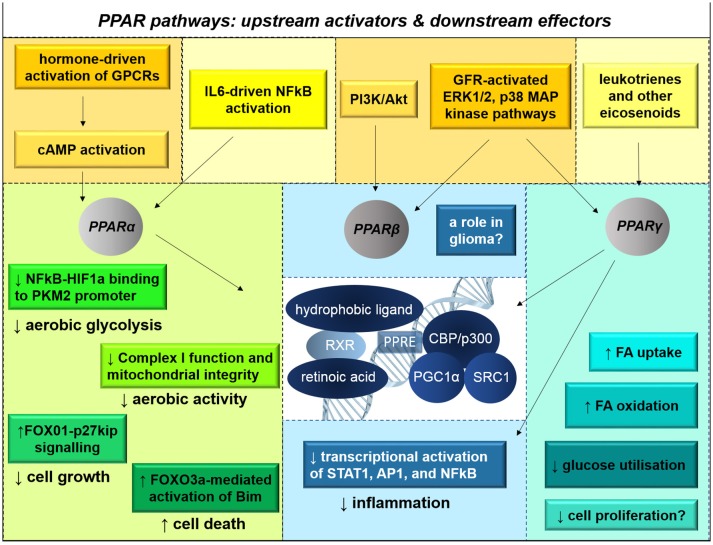
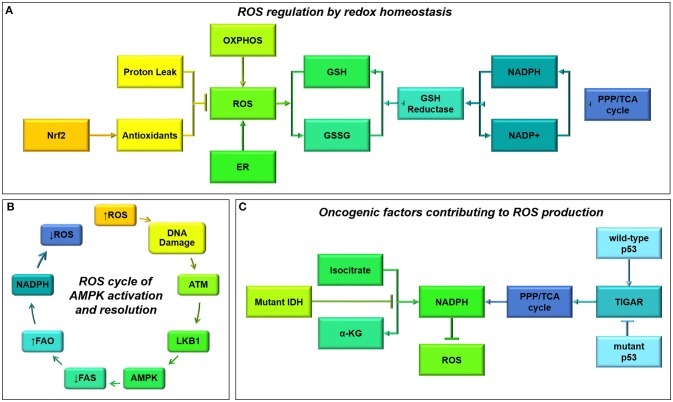
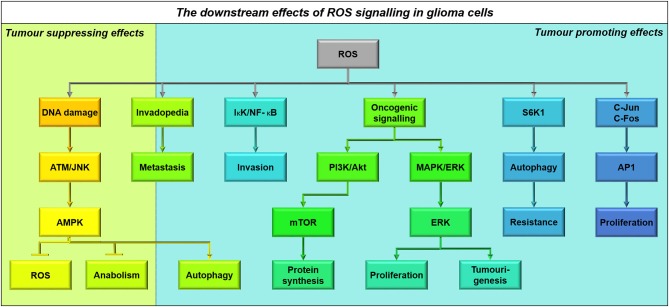
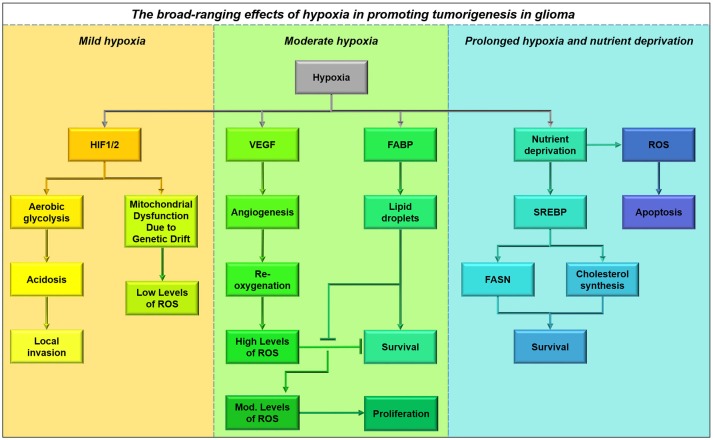
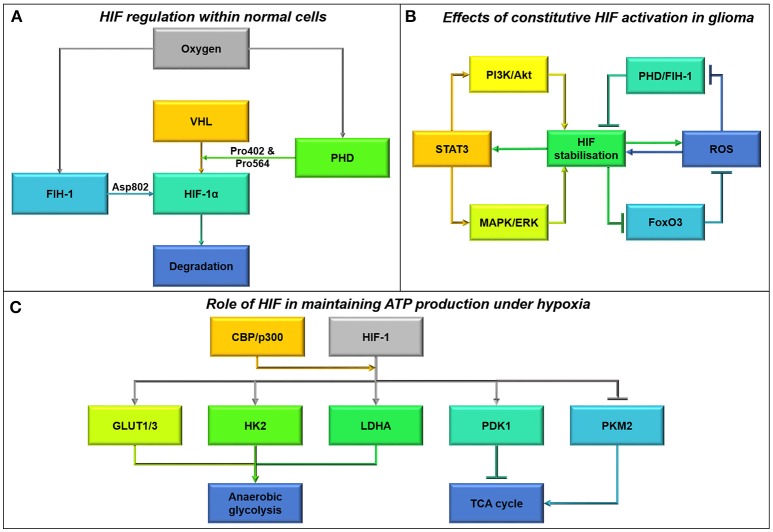
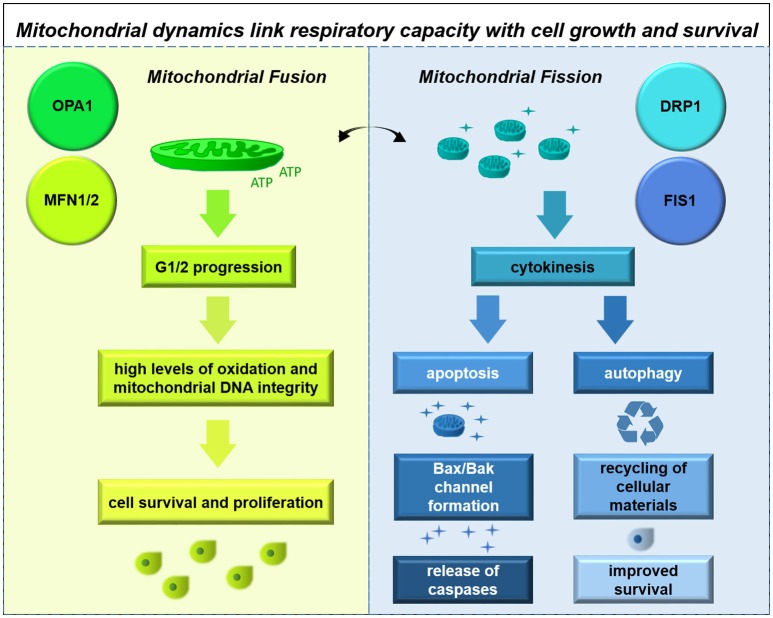
Many cancers have long been thought to primarily metabolize glucose for energy production-a phenomenon known as the Warburg Effect, after the classic studies of Otto Warburg in the early twentieth century. Yet cancer cells also utilize other substrates, such as amino acids and fatty acids, to produce raw materials for cellular maintenance and energetic currency to accomplish cellular tasks. The contribution of these substrates is increasingly appreciated in the context of glioma, the most common form of malignant brain tumor. Multiple catabolic pathways are used for energy production within glioma cells, and are linked in many ways to anabolic pathways supporting cellular function. For example: glycolysis both supports energy production and provides carbon skeletons for the synthesis of nucleic acids; meanwhile fatty acids are used both as energetic substrates and as raw materials for lipid membranes. Furthermore, bio-energetic pathways are connected to pro-oncogenic signaling within glioma cells. For example: AMPK signaling links catabolism with cell cycle progression; mTOR signaling contributes to metabolic flexibility and cancer cell survival; the electron transport chain produces ATP and reactive oxygen species (ROS) which act as signaling molecules; Hypoxia Inducible Factors (HIFs) mediate interactions with cells and vasculature within the tumor environment. Mutations in the tumor suppressor p53, and the tricarboxylic acid cycle enzymes Isocitrate Dehydrogenase 1 and 2 have been implicated in oncogenic signaling as well as establishing metabolic phenotypes in genetically-defined subsets of malignant glioma. These pathways critically contribute to tumor biology. The aim of this review is two-fold. Firstly, we present the current state of knowledge regarding the metabolic strategies employed by malignant glioma cells, including aerobic glycolysis; the pentose phosphate pathway; one-carbon metabolism; the tricarboxylic acid cycle, which is central to amino acid metabolism; oxidative phosphorylation; and fatty acid metabolism, which significantly contributes to energy production in glioma cells. Secondly, we highlight processes (including the Randle Effect, AMPK signaling, mTOR activation, etc.) which are understood to link bio-energetic pathways with oncogenic signals, thereby allowing the glioma cell to achieve a pro-malignant state.

Keywords: autophagy; biosynthesis; brain tumors; cancer; catabolism; glioma; metabolism; mitochondria.


Figures

Figure 1
Figure 1
Glycolysis and related pathways fuel biosynthesis and energy metabolism in cancer cells. This schematic shows how the glycolytic pathway feeds into other pathways, including the Kreb's Cycle (which fuels amino acid synthesis and provides metabolic intermediates for the electron transport chain), the pentose phosphate pathway (PPP, which is involved in nucleic acid synthesis), and one-carbon metabolism (the folate-methionine cycle).
Figure 2
Figure 2
The Kreb's Cycle and oxidative phosphorylation pathways are central to cell metabolism. Acetyl CoA from many different sources can enter the Kreb's Cycle (also known as the citric acid cycle, or tricarboxylic acid cycle). This pathway not only drives oxidative phosphorylation by regenerating succinate, but it provides many useful intermediates for biosynthesis. The enzyme complexes of the electron transport chain, which support oxidative phosphorylation, are shown embedded in the inner mitochondrial membrane.
Figure 3
Figure 3
Ketolysis, fatty acid biosynthesis and fatty acid oxidation. These pathways provide substrates for glioma cells to make acetyl CoA or utilize it as a building block for lipid-based molecules.
Figure 4
Figure 4
Multiple substrates can contribute to cellular bioenergetics by providing acetyl CoA. This schematic shows an integrated view of glioma cell metabolism, demonstrating that ketones providing acetyl CoA will fuel both energy production and biosynthesis of raw materials (e.g., nucleic acids, amino acids, phospholipids and other molecules). The non-oxidative use of glucose by glioma cells is shown in green; particularly the Warburg Effect1 where cancer cells undergo glycolysis that is not followed by oxidation, instead converting the end product pyruvate into lactate and releasing it into the extracellular space. Aerobic respiratory pathways used by glioma cells are shown in blue; glioma cells appear to engage in a Futile Cycle2 (gray) where fatty acids are continuously synthesized and oxidized in glioma cells (it has been shown that inhibiting either pathway reduces cellular proliferation and slows tumor progression). Ketolysis, shown in violet, and fatty acid oxidation, shown in teal, provides acetyl CoA which fuels the Kreb's Cycle and oxidative phosphorylation; acetyl CoA produced from any source facilitates anapleurosis and biosynthesis of many molecules critical to cellular function. Metabolic intermediates, such as those produced by the Kreb's Cycle and oxidative phosphorylation, impinge on other cellular functions, as shown in yellow. *Interactions between enzymes that link catabolic pathways, which have been identified in other cancers but not yet studied in glioma, are shown in red. These include: the Randle Effect3 where NADH and acetyl CoA produced during fatty acid (FA) oxidation inhibit pyruvate dehydrogenase, thus promoting glucose's alternative fate (release as lactate), the Corbet-Feron Effect4 where lactate-induced acidification of the microenvironment promotes the FA oxidation phenotype via acetylation-mediated activation of mitochondrial proteins, and sirtuin-mediated regulation of histone acetylation5.
Figure 5
Figure 5
The conflicting role of AMPK in glioma as a tumor suppressor and tumor promoter. Increased AMP: ATP and ADP: ATP ratios, metabolic stress and treatment with chemotherapy results in AMPK activation in glioma cells (Hardie and Alessi, 2013). This results in the activation of several downstream pathways that result in both tumor suppression and growth depending on the context of AMPK activation. Primarily AMPK activates p53 transcriptional activity leading to classical cell cycle inhibition, reducing tumor growth through p21CIP1 and p27KIP1 activation (Jones et al., 2005). AMPK activation also downregulates mTOR signaling resulting in decreased protein synthesis and G2 block, whilst also releasing its constraint on autophagy, increasing glioma survival during chemotherapy (Vucicevic et al., ; Misirkic et al., 2012). Unresolved stress over prolonged periods can also result in increased apoptosis and therefore decreased viability. By increasing Rb phosphorylation, AMPK activation is also able to overcome cell cycle inhibition (Ríos et al., 2014).
Figure 6
Figure 6
The dual role of AMPK activity in maintaining energy homeostasis and ensuring nutrient sufficiency for cell cycle progression. Upon activation by decreased ATP availability, AMPK acts to inhibit energy consuming pathways such as cholesterol and fatty acid synthesis (Hardie and Pan, 2002), whilst also increasing the activity of cell cycle inhibitors p27 and p53 (Isakovic et al., 2007). This tumor suppression acts to restore energy homeostasis by inhibiting cell cycle progression, resulting in decreased AMPK activity and a switch from catabolism to anabolism for completion of the cell cycle. AMPK thereby acts to maintain energy homeostasis and ensure nutrient sufficiency for cell cycle progression.
Figure 7
Figure 7
Components of the mTORC1 and mTORC2 signaling complexes. Both the mTORC1 and mTORC2 complexes contain mTOR, MLST8, and DEPTOR. However, their major differences lie in the co-binding of Raptor to the mTORC1 complex and Rictor to the mTORC2 complex, in addition to their other binding partners including PRAS40 and PROTOR1/2 and SIN1 respectively (Laplante and Sabatini, 2012).
Figure 8
Figure 8
(A) The role of mTOR in protein synthesis. AMPK is a well-known regulator of mTOR activity (Vucicevic et al., 2011). Upon activation AMPK destabilizes the Tumor Suppressor 1/2 (TSC1/2) complex, allowing TSC2 to freely bind Ras-homolog enriched in brain (RHEB) and inhibit mTORC1 signaling (Laplante and Sabatini, 2012). This means that energy consuming processes such as protein translation and ribsome biogenesis are inhibited during periods of energy stress. As well as acting through AMPK, ATP has recently also been shown to be able to directly activate mTORC1 signaling (Dennis et al., 2001). (B) The role of mTOR in energy metabolism. mTORC2 metabolic reprogramming downstream of PI3K/Akt is a critical regulator of the Warburg effect and glucose dependence in glioma cells (Masui et al., 2015). By relieving FoxO1/3 constraint on c-Myc signaling, mTORC2 increases Glucose Transproter 1 and 3 expression (GLUT1/3) as well as lactate dehydrogenase activity, encouraging aerobic glycolysis (Masui et al., 2013). Simultaneously, through c-Myc activity mTORC2 also inhibits glutamate dehydrogenase (GDH) activity required for glutaminolysis, regulating a metabolic switch from oxidative phosphorylation fuelled by the Kreb's cycle to aerobic glycolysis (Yang et al., 2009). mTORC2 signaling therefore causes glioma cells to become “addicted” to aerobic glycolysis, making them particularly vulnerable to glucose depletion. (C) The role of mTOR in stem cell maintenance. Oncogenic activity which converges on PI3K can activate mTOR signaling (Sarbassov et al., 2005). mTORC1 and mTORC2 activity results in the activation of several transcription factors, including OCT4 and NOTCH and c-Myc respectively, ensuring stem cell maintainence (Masui et al., 2013). c-Myc can also be activated directly by Akt signaling and PKCα signaling downstream of mTORC2 to induce stem cell transformation (Fan et al., 2009). Additionally, whilst mTORC2 activity forms part of a feed-forward system, phosphorylating Akt, mTORC1 activity downregulates PI3K activity by downregulating PDGFR (Akhavan et al., ; Sarbassov et al., 2005).
Figure 9
Figure 9
(A) Functional p53 control of cell growth and oxidative metabolism. p53 plays a role in its own regulation by diminishing the inhibition of MDM2 which mediates p53 ubiquitination, through a feedback loop involving miR-25 and -32 (Suh et al., 2012). p53 also has a role in inhibiting the activity of oncogenic pathways, including mTOR and PI3K/Akt, halting cell cycle progression whilst DNA is repaired (Budanov and Karin, 2008). This cell cycle blockade can be alleviated by MDM2 (Reifenberger et al., 1993). This also alleviates the glycolytic switch inferred by the pathways. Additionally, p53 also has its own roles in diminishing glycolysis both directly and indirectly through TIGAR transcription (Bensaad et al., 2006). (B) Differential response of p53 to different forms of damage. Activation of p53 due to DNA damage (shown in green), results in the suppression of phosphoglycerate mutase (PGM) causing inhibition of the glycerate reduction. This process allows activation of the non-oxidative arm of the PPP and production of R5P for DNA repair, instead of channeling glycolytic intermediates through the glycolytic pathway (Kondoh et al., ; Deberardinis et al., ; Levine and Puzio-Kuter, 2010). Additionally, activation of p53 by oxidative damage (shown in blue) inhibits the degradation of G6P-dehydrogenase (G6PD), stimulating the oxidative PPP phase and NADPH production to counter-act ROS and oxidation (Jiang et al., 2011). These pathways provide protection from extensive DNA and oxidative damage in cancer cells expressing functional p53. However, under conditions where p53 has been activated in response to other stimuli such as energy deprivation (shown in orange), p53 can inhibit these pathways to free-up glycolytic intermediates for pyruvate formation and Kreb's cycle entry (Boros et al., ; Christofk et al., 2008).
Figure 10
Figure 10
PPAR signaling pathways influence metabolic capacity, growth, and survival. There are three subtypes of peroxisome proliferator-activated receptor proteins (PPARs). PPARs are nuclear hormone receptors that are activated primarily by eicosanoids, unsaturated fatty acids, NSAIDS, and retinoic acid. Their activation status is also influenced by cAMP second messenger cascades and MAP kinase signaling activated by G-protein-coupled receptors (GPCRs) and growth factor receptor (GFR)-activated signaling. Upon heterodimerization with retinoic acid receptors (RXRs) and association with hydrophobic ligands, PPARs translocate to the nucleus. There, the complexes activate transcription of metabolic genes. PPARα agonism disrupts HIF1α-mediated transcriptional activation of PKM2, thereby reducing glycolysis; PPARα has also been implicated in tumor suppression and apoptotic initiation through various signaling pathways. PPARγ enhances mitochondrial biogenesis, fatty acid oxidation, and insulin-mediated glucose transport into cells; PPARγ is also anti-inflammatory, preventing the activation of STAT1, AP1, and NFκB. In many contexts, non-ligand-activation of PPAR induces transcriptional repression. The effects of PPARβ signaling in glioma are not known.
Figure 11
Figure 11
(A) Reactive oxygen species (ROS) maintenance by redox homeostasis. Oxidative phosphorylation and endoplasmic reticulum (ER) activity both result in the formation of ROS (Salazar-Ramiro et al., 2016). These ROS can be neutralized by antioxidants, under the transcriptional control of Nrf2, the master regulator of ROS homeostasis (Cardaci and Ciriolo, 2012). Additionally, proton leak in the mitochondria also helps to neutralize ROS through a self-regulating system (Brookes, 2005). Another system to regulate ROS levels, acts through the glutathione (GSH) system which neutralizes ROS upon conversion into glutathione disulphide (GSSG) (Levine and Puzio-Kuter, 2010). Within cells, GSH levels are maintained by production of NADPH from the PPP and Kreb's cycle which maintain GSH reductase activity (Levine and Puzio-Kuter, 2010). (B) ROS cycle of AMPK activation and resolution. Increased ROS levels result in oxidative DNA damage and the activation of the DNA damage response pathway by ataxia-telangiectasia mutated (ATM) recognition (Alexander and Walker, 2011). This stimulates LKB1 activity, and increased phosphorylation and stimulation of AMPK. As a result AMPK inhibits NADPH consuming pathways such as FAS and activates catabolic NADPH-producing pathways such as FAO, which acts through the GSH/GSSG antioxidant system to neutralize ROS and restrain further oxidative damage (Jeon et al., 2012). (C) Oncogenic factors contributing to ROS production. Two common mutations in secondary gliomas include the mutation of isocitrate dehydrogenase (IDH) and p53 pathways (Cuperlovic-Culf et al., 2012). Through their downstream activities, i.e., IDH reducing isocitrate into α-KG and p53-mediated transcription of TIGAR, these proteins aid in maintaining NADPH levels and subsequent ROS neutralization (Wanka et al., ; Klink et al., 2016). However, upon mutation these pathways are inhibited resulting in a loss of NADPH, increased ROS and a higher rate of oxidative damage within glioma cells.
Figure 12
Figure 12
The downstream effects of ROS signaling in glioma cells. Activation of AMPK as a result of oxidative damage induced by ROS, has both tumor suppressive and promotive effects within glioma cells, through AMPK signaling (Alexander and Walker, 2011). Additionally ROS aids in oncogenic signaling resulting in the activation of pathways involved in metastasis, invasion, proliferation, and resistance (Boonstra and Post, 2004). ROS mediates the formation of invadopedia involved in metastasis and inflammatory signaling through NF-kB to promote matrix degradation and invasion (Zhang et al., 2015). Additionally PI3K/Akt and MAPK/ERK pathways are also augmented resulting in increased proliferation, as well as increasing c-Jun and c-Fos formation of the activator protein-1 (AP-1) transcription factor involved in proliferation (Benhar et al., ; Waris and Ahsan, 2006). Finally, ROS are also involved in S6K1 activation which acts to induce autophagy providing chemotherapeutic resistance (Sarbassov and Sabatini, 2005).
Figure 13
Figure 13
The broad-ranging effects of hypoxia in promoting tumorigenesis in glioma, and protection from immediate ill effects of re-oxygenation. Acute periods of hypoxia result in the up-regulation of many glycolytic genes resulting in the release of lactate and an acidic microenvironment, which is conducive for localized invasion. Hypoxia is also accompanied by mitochondrial dysfunction as a result of this metabolic adaptation, resulting in excess accumulation of ROS and apoptosis. Under conditions of moderate hypoxia, GBM cells downregulate fatty acid, and cholesterol biosynthesis pathways and primarily rely on increased fatty acid uptake to meet their nutrient requirements, through upregulation of fatty acid binding proteins particularly FABP7, resulting in the formation of lipid droplets in a time- and oxygen-dependent manner (Bensaad et al., 2014). Restricted oxygen availability and nutrient deprivation are often accompanied by poor vascularisation, causing extensive increases in apoptosis (Lewis et al., 2015). However, under these conditions some glioma cells have been shown to upregulate sterol regulatory element-binding protein (SREBP) to maintain fatty acid and cholesterol metabolism by disrupting the mevalonate pathway (Lewis et al., 2015). The accumulation of lipids in GBM helps to maintain viability upon re-oxygenation after angiogenesis, providing an alternative source for ATP production and protecting against ROS accumulation (Bensaad et al., 2014).
Figure 14
Figure 14
(A) Hypoxia-inducible factor (HIF) regulation within normal cells. There are two main avenues governing HIF-1α within normal cells, involving the factor-inhibiting hypoxia-1 (FIH-1) and Von Hippel-Lindau (VHL) proteins (Semenza, 2010). The activity of these proteins is regulated by oxygen levels, whereby FIH-1 hydroxylates HIF-1α at Asp802 blocking its transcriptional activity, whereas VHL activity is reliant on prolyl-hydroxylase (PHD) to hydroxylate Pro402 and everPro564 under oxygenated conditions, marking HIF for degradation by VHL (Semenza, 2010). However, when oxygen levels are low HIF is not marked for degradation and is therefore its transcriptional activity is unrestrained. (B) Effects of constitutive HIF activation in glioma. The constitutive activation of HIF under normal oxygen tension is known as pseudo-hypoxia. Oncogenic signaling in cancer cells acts to stabilize HIF under normoxia primarily through the activation of PI3K/Akt and MAPK/ERK pathways (Qiang et al., ; Mimeault and Batra, 2013). In turn, as a result of HIF transcription STAT3 is upregulated resulting in further activation of these oncogenic pathways (Mimeault and Batra, ; Qiang et al., 2012). HIF stabilization often arises in concert with ROS production, which acts to stabilize HIFs by oxidizing the catalytic iron center of PHD and FIH-1, limiting HIF degradation (Chandel et al., ; Semenza, 2010). Reduced FoxO3 activity as a result of oncogenic signaling and HIF transcription also acts to increase ROS production as part of a feed-forward mechanism (Ferber et al., 2012). (C) Role of HIF in maintaining ATP production under hypoxia. Upon stabilization the HIF-1 complex acts in concert with the CREB-binding protein (CBP)/p300 co-activator to alter the transcription of multiple genes involved in metabolism (Semenza, 2010). Through increasing the transcription of GLUT1/3, HK2, PDK1, and LDHA, HIF-1 increases glucose uptake and glycolysis whilst inhibiting the Kreb's cycle and oxidative metabolism (Semenza, ; Kucharzewska et al., 2015). Additionally, HIF-1 transcription also inhibits PKM2 activity to limiting flux through the Kreb's cycle and oxidative metabolism (Kim et al., 2015).
Figure 15
Figure 15
Mitochondrial dynamics are linked with cell cycle, respiratory capacity, and cell survival. Mitochondrial dynamics are regulated in concert with the cell cycle and coordinate metabolic activity; fusion facilitates high rates of oxidation while fission permits initiation of apoptosis or adoption of an autophagy-based survival strategy.

References

    1. Abdelwahab M. G., Fenton K. E., Preul M. C., Rho J. M., Lynch A., Stafford P., et al. . (2012). The ketogenic diet is an effective adjuvant to radiation therapy for the treatment of malignant glioma. PLoS ONE 7:e36197. 10.1371/journal.pone.0036197 - DOI - PMC - PubMed
    1. Adam J., Yang M., Bauerschmidt C., Kitagawa M., O'Flaherty L., Maheswaran P., et al. . (2013). A role for cytosolic fumarate hydratase in urea cycle metabolism and renal neoplasia. Cell Rep. 3, 1440–1448. 10.1016/j.celrep.2013.04.006 - DOI - PMC - PubMed
    1. Ahmad F., Dixit D., Sharma V., Kumar A., Joshi S. D., Sarkar C., et al. . (2016). Nrf2-driven TERT regulates pentose phosphate pathway in glioblastoma. Cell Death Dis. 7:e2213. 10.1038/cddis.2016.117 - DOI - PMC - PubMed
    1. Akhavan D., Cloughesy T. F., Mischel P. S. (2010). mTOR signaling in glioblastoma: lessons learned from bench to bedside. Neuro-oncology 12, 882–889. 10.1093/neuonc/noq052 - DOI - PMC - PubMed
    1. Albert N. L., Weller M., Suchorska B., Galldiks N., Soffietti R., Kim M. M., et al. . (2016). Response assessment in neuro-oncology working group and european association for neuro-oncology recommendations for the clinical use of PET imaging in gliomas. Neuro-oncology 18, 1199–1208. 10.1093/neuonc/now058 - DOI - PMC - PubMed