

Lack of agreement between radiologists: implications for image-based model observers
- PMID: 28491908
- PMCID: PMC5414890
- DOI: 10.1117/1.JMI.4.2.025502
Lack of agreement between radiologists: implications for image-based model observers
Abstract
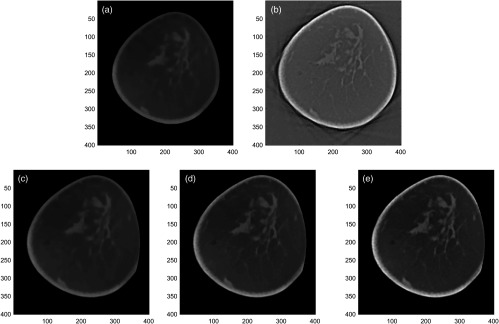
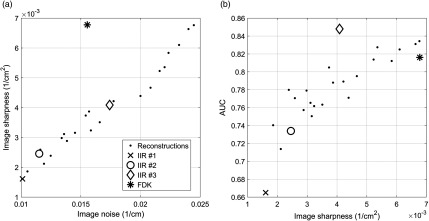
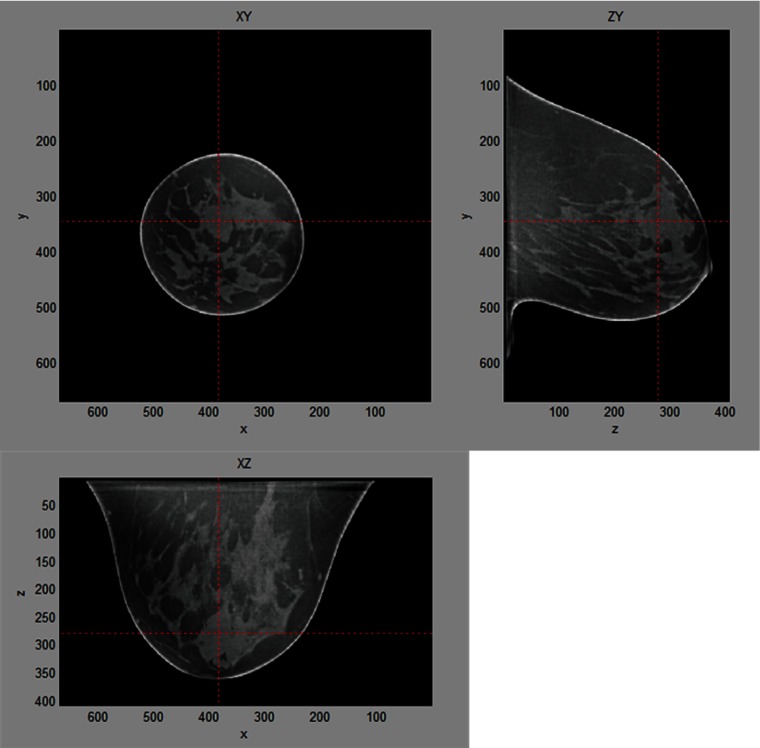
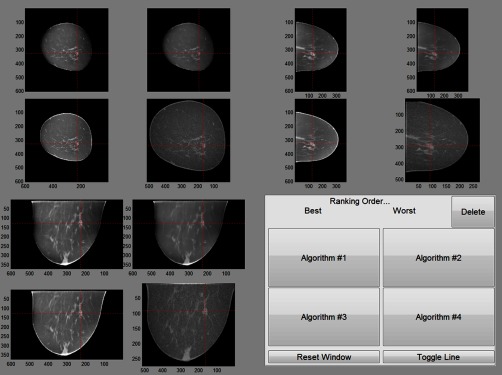
We tested the agreement of radiologists' rankings of different reconstructions of breast computed tomography images based on their diagnostic (classification) performance and on their subjective image quality assessments. We used 102 pathology proven cases (62 malignant, 40 benign), and an iterative image reconstruction (IIR) algorithm to obtain 24 reconstructions per case with different image appearances. Using image feature analysis, we selected 3 IIRs and 1 clinical reconstruction and 50 lesions. The reconstructions produced a range of image quality from smooth/low-noise to sharp/high-noise, which had a range in classifier performance corresponding to AUCs of 0.62 to 0.96. Six experienced Mammography Quality Standards Act (MQSA) radiologists rated the likelihood of malignancy for each lesion. We conducted an additional reader study with the same radiologists and a subset of 30 lesions. Radiologists ranked each reconstruction according to their preference. There was disagreement among the six radiologists on which reconstruction produced images with the highest diagnostic content, but they preferred the midsharp/noise image appearance over the others. However, the reconstruction they preferred most did not match with their performance. Due to these disagreements, it may be difficult to develop a single image-based model observer that is representative of a population of radiologists for this particular imaging task.
Keywords: breast cancer; breast computed tomography; diagnostic performance; model observers; reader study.
Figures
References
-
- Brenner D. J., Hall E. J., “Computed tomography—an increasing source of radiation exposure,” N. Engl. J. Med. 357(22), 2277–2284 (2007).http://dx.doi.org/10.1056/NEJMra072149 - DOI - PubMed
-
- Medicare Payment Authority Commission, A Data Book: Health Care Spending and the Medicare Program, Medicare Payment Advisory Commission; (2015).
-
- Verdun F. R., et al. , “Image quality in CT: from physical measurements to model observers,” Phys. Med. 31(8), 823–843 (2015).http://dx.doi.org/10.1016/j.ejmp.2015.08.007 - DOI - PubMed
-
- Thurston J., “NCRP Report No. 160: ionizing radiation exposure of the population of the United States,” Phys. Med. Biol. 55(20), 6327 (2010).PHMBA7http://dx.doi.org/10.1088/0031-9155/55/20/6327 - DOI
-
- Barrett H. H., et al. , “Model observers for assessment of image quality,” Proc. Natl. Acad. Sci. U. S. A. 90(21), 9758–9765 (1993).https://doi.org/10.1073/pnas.90.21.9758 - DOI - PMC - PubMed
Grants and funding
LinkOut - more resources
Full Text Sources
Other Literature Sources
