. 2017 May 11:8:15333.
doi: 10.1038/ncomms15333.

Dust-wind interactions can intensify aerosol pollution over eastern China

Affiliations

Dust-wind interactions can intensify aerosol pollution over eastern China

Yang Yang et al. Nat Commun. .

Abstract

Eastern China has experienced severe and persistent winter haze episodes in recent years due to intensification of aerosol pollution. In addition to anthropogenic emissions, the winter aerosol pollution over eastern China is associated with unusual meteorological conditions, including weaker wind speeds. Here we show, based on model simulations, that during years with decreased wind speed, large decreases in dust emissions (29%) moderate the wintertime land-sea surface air temperature difference and further decrease winds by -0.06 (±0.05) m s-1 averaged over eastern China. The dust-induced lower winds enhance stagnation of air and account for about 13% of increasing aerosol concentrations over eastern China. Although recent increases in anthropogenic emissions are the main factor causing haze over eastern China, we conclude that natural emissions also exert a significant influence on the increases in wintertime aerosol concentrations, with important implications that need to be taken into account by air quality studies.


Conflict of interest statement

The authors declare no competing financial interests.

Figures

Figure 1
Figure 1. Differences in simulated wind and dust in China at preindustrial conditions.
(a) Composite differences in wind field at 850 hPa (vectors, unit: m s−1) and dust emissions (contours, unit: g m−2 season−1) between weak wind and normal conditions in the standard simulation with interannual variations in dust emissions (IRUN), which are calculated by VWeak, IRUNVNormal, IRUN. V represents variables. (b) Changes in dust column burden (unit: mg m−2) between weak wind and normal conditions due to the interannual variations in dust emissions, which are calculated by (VWeak, IRUNVNormal, IRUN)−(VWeak, DRUNVNormal, DRUN) based on simulations with (IRUN) and without (DRUN) interannual variations in dust emissions. (c) Composite differences in dust column burden (unit: mg m−2) between weak wind and normal conditions in the IRUN simulation. (d) Composite differences in Total Ozone Mapping Spectrometer (TOMS) Aerosol Index between weak wind and normal conditions calculated based on 850 hPa wind speed from NCEP/NCAR meteorological fields for 1979–1993. Changes in shortwave aerosol direct radiative effect (unit: W m−2) (e) at the TOA and (f) the surface, respectively, between weak wind and normal conditions due to the interannual variations in dust emissions. The region boxed in (b) is used to represent eastern China (110–122.5° E, 20–45° N).
Figure 2
Figure 2. Dust-induced changes in vertical profiles of heating rate and winds.
Changes in (a) atmospheric heating rate (unit: K per day) and (b) meridional wind (vectors, unit: m s−1) and vertical velocity (contours, unit: Pa s−1) scaled by a factor of −100 averaged over 110–122.5° E between weak wind and normal conditions due to the interannual variations in dust emissions.
Figure 3
Figure 3. Changes in horizontal winds and dust–wind feedback.
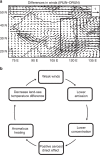
(a) Changes in wind fields (unit: mg m−2) between weak wind and normal conditions due to the interannual variations in dust emissions. (b) The dust–wind feedback over eastern China. The region boxed in (a) is used to represent eastern China (110–122.5° E, 20–45° N).
Figure 4
Figure 4. Regression of wind and PM2.5 in GEOS-Chem model.
(a) Regression coefficient between the 850 hPa wind speed averaged over eastern China (110–122.5° E, 20–45° N) and the simulated surface layer PM2.5 concentrations in winter (unit: μg m−3 (m s−1)−1). The dotted areas indicate statistical significance with 95% confidence. (b) Scatter plot between the area-averaged 850 hPa wind speed and area-averaged surface layer PM2.5 concentrations over eastern China during 1986–2006. Wind speed is derived from GEOS-4 meteorological fields. PM2.5 concentrations are from the GEOS-Chem model simulation. Regression model and correlation coefficient between area-averaged wind speed and PM2.5 concentrations are shown on top right.
Figure 5
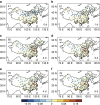
Figure 5. Lagged correlation between observed dust and visibility.
Lagged correlation coefficients between observed daily dust storm events averaged over the Gobi Desert region and atmospheric visibility over 346 meteorological stations in China in DJF for years 1981–2015. Sites with outlines indicate statistical significance with 95% confidence. The lag time for the atmospheric visibility relative to the leading dust storm events are (a) 0, (b) 1, (c) 2, (d) 3, (e) 4 and (f) 5 days, as shown at the bottom right of each panel. The number of stations with statistically significant positive correlations over eastern China is shown at the top left of each panel. Records from a total of 154 stations located in eastern China were used for this analysis.

References

    1. Ding Y. H. & Liu Y. J. Analysis of long-term variations of fog and haze in China in recent 50 years and their relations with atmospheric humidity. Sci. China Earth Sci. 57, 36–46 (2014).
    1. Huang R. et al.. High secondary aerosol contribution to particulate pollution during haze events in China. Nature 514, 218–222 (2014). - PubMed
    1. Zhang R. H., Li Q. & Zhang R. N. Meteorological conditions for the persistent severe fog and haze event over eastern China in January 2013. Sci. China Earth Sci. 57, 26–35 (2014).
    1. Xu P., Chen Y. F. & Ye X. J. Haze, air pollution, and health in China. Lancet 382, 2067 (2013). - PubMed
    1. Qian Y., Kaiser D. P., Leung L. R. & Xu M. More frequent cloud-free sky and less surface solar radiation in China from 1955 to 2000. Geophys. Res. Lett. 33, L01812 (2006).

Publication types