

Size, Composition, and Source Profiles of Inhalable Bioaerosols from Colorado Dairies
- PMID: 28492313
- PMCID: PMC9552963
- DOI: 10.1021/acs.est.7b00882
Size, Composition, and Source Profiles of Inhalable Bioaerosols from Colorado Dairies
Abstract
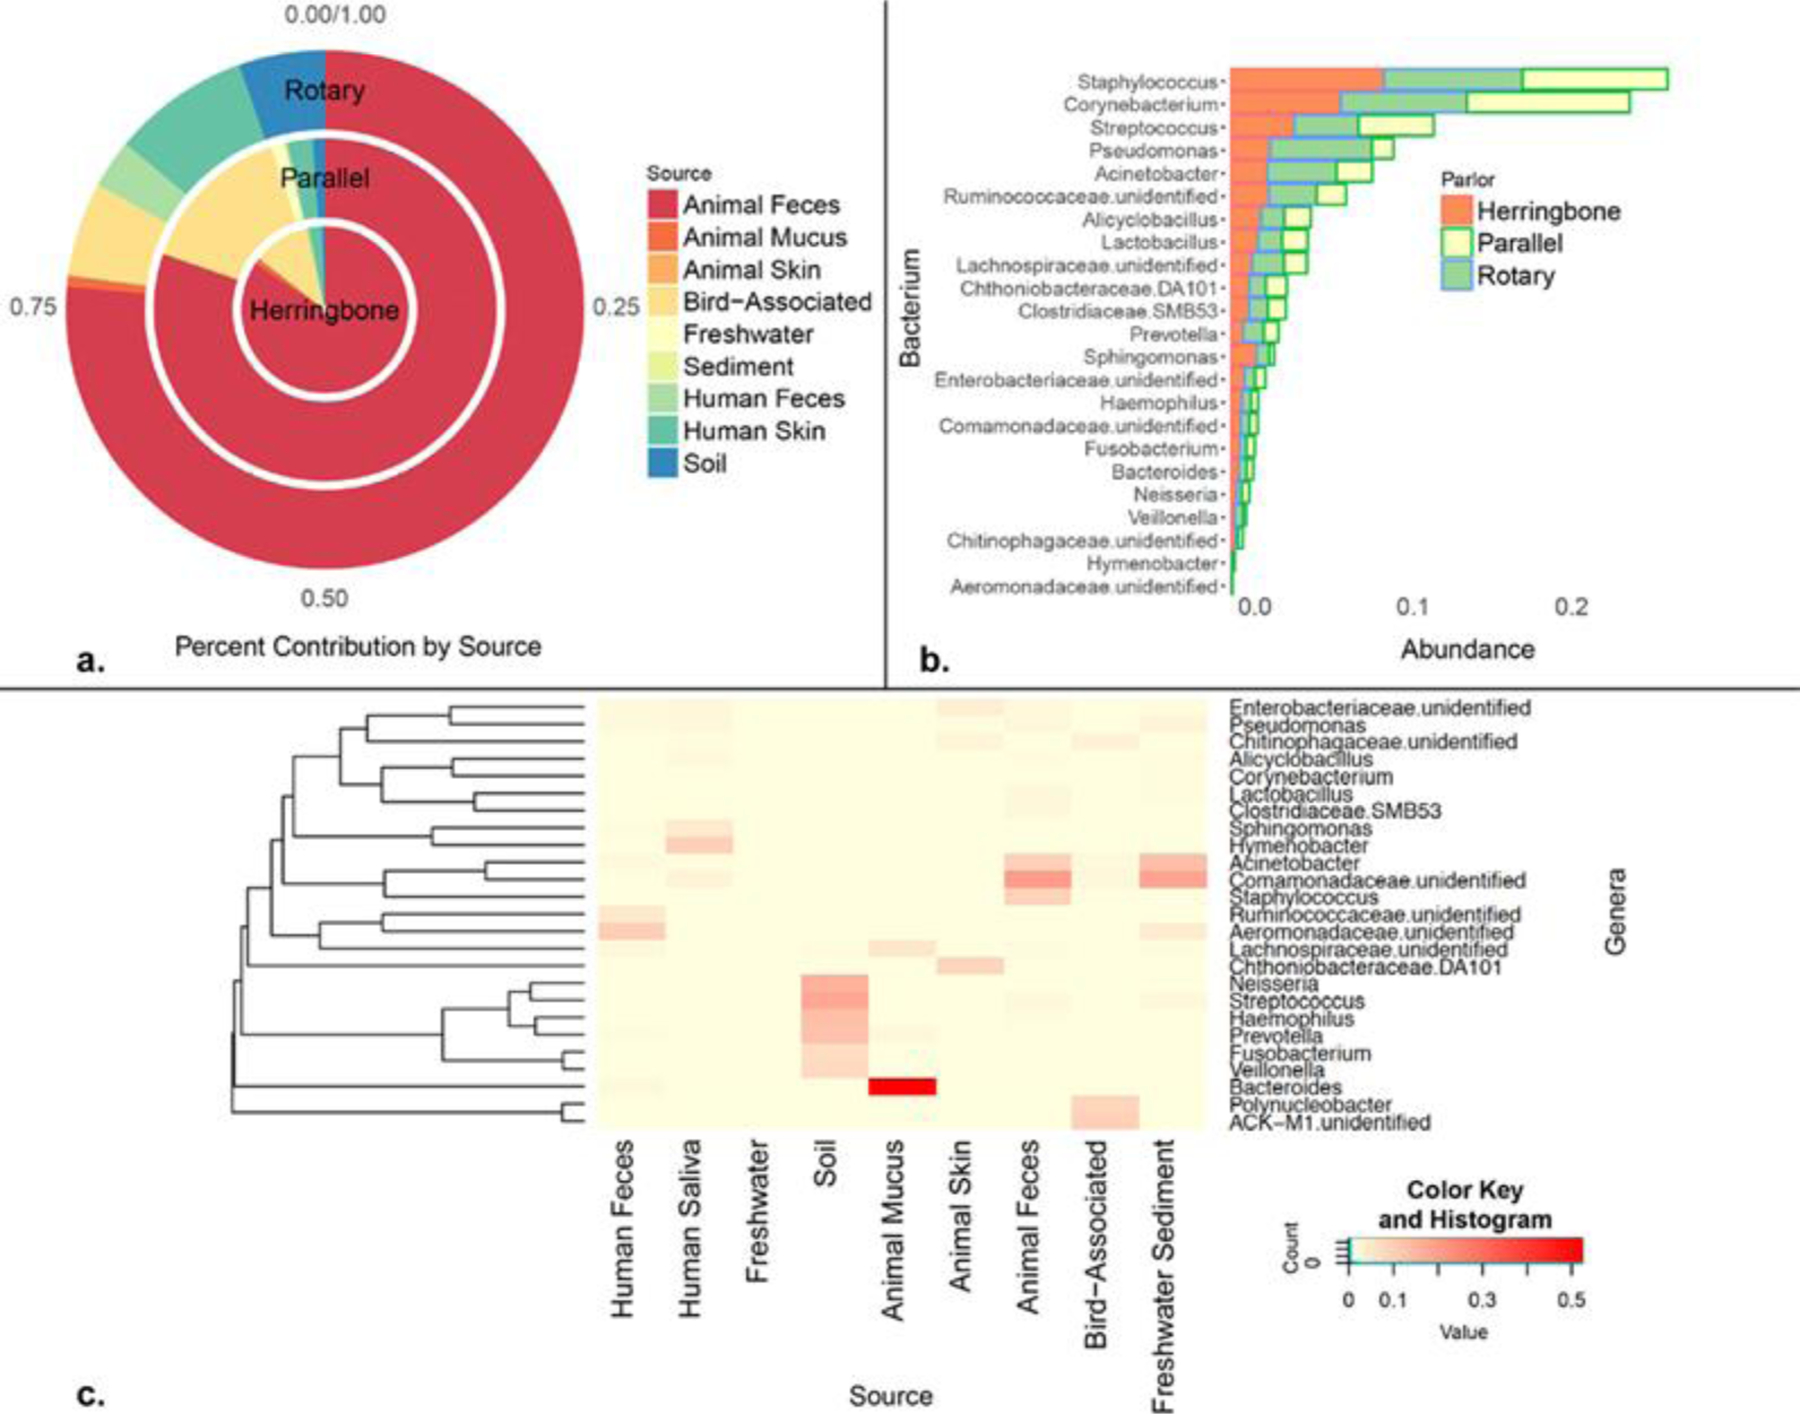
Particulate matter emissions from agricultural livestock operations contain both chemical and biological constituents that represent a potential human health hazard. The size and composition of these dusts, however, have not been well described. We evaluated the full size distribution (from 0 to 100 μm in aerodynamic diameter) and chemical/biological composition of inhalable dusts inside several Colorado dairy parlors. Four aerodynamic size fractions (<3, 3-10, 10-30, and >30 μm) were collected and analyzed using a combination of physiochemical techniques to understand the structure of bacterial communities and chemical constituents. Airborne particulate mass followed a bimodal size distribution (one mode at 3 μm and a second above 30 μm), which also correlated with the relative concentrations of the following microbiological markers: bacterial endotoxin, 3-hydroxy fatty acids, and muramic acid. Sequencing of the 16S-rRNA components of this aerosol revealed a microbiome derived predominantly from animal sources. Bacterial genera included Staphlyococcus, Pseudomonas, and Streptococcus, all of which have proinflammatory and pathogenic capacity. Our results suggest that the size distribution of bioaerosols emitted by dairy operations extends well above 10 μm in diameter and contains a diverse mixture of potentially hazardous constituents and opportunistic pathogens. These findings should inform the development of more effective emissions control strategies.
Figures


Similar articles
-
Personal exposure of dairy workers to dust, endotoxin, muramic acid, ergosterol, and ammonia on large-scale dairies in the high plains Western United States.J Occup Environ Hyg. 2018 Mar;15(3):182-193. doi: 10.1080/15459624.2017.1403610. J Occup Environ Hyg. 2018. PMID: 29157144 Free PMC article.
-
Distribution characteristics of bioaerosols inside pig houses and the respiratory tract of pigs.Ecotoxicol Environ Saf. 2021 Apr 1;212:112006. doi: 10.1016/j.ecoenv.2021.112006. Epub 2021 Feb 5. Ecotoxicol Environ Saf. 2021. PMID: 33556810
-
Exposure to Inhalable Dust, Endotoxin, and Total Volatile Organic Carbons on Dairy Farms Using Manual and Automated Feeding Systems.Ann Work Expo Health. 2017 Apr 1;61(3):344-355. doi: 10.1093/annweh/wxw023. Ann Work Expo Health. 2017. PMID: 28355415
-
Particulate matter and airborne endotoxin concentration in calf barns and their association with lung consolidation, inflammation, and infection.J Dairy Sci. 2021 May;104(5):5932-5947. doi: 10.3168/jds.2020-18981. Epub 2021 Feb 19. J Dairy Sci. 2021. PMID: 33612235
-
Use of mass spectrometry for characterising microbial communities in bioaerosols.Ann Agric Environ Med. 2001;8(2):111-7. Ann Agric Environ Med. 2001. PMID: 11748866 Review.
Cited by
-
Applying an environmental public health lens to the industrialization of food animal production in ten low- and middle-income countries.Global Health. 2019 Jun 13;15(1):40. doi: 10.1186/s12992-019-0479-5. Global Health. 2019. PMID: 31196114 Free PMC article.
-
Lessons from Dairy Farmers for Occupational Allergy and Respiratory Disease.Curr Allergy Asthma Rep. 2023 Jun;23(6):325-339. doi: 10.1007/s11882-023-01081-2. Epub 2023 May 16. Curr Allergy Asthma Rep. 2023. PMID: 37191901 Free PMC article. Review.
-
Preliminary investigation of a hypertonic saline nasal rinse as a hygienic intervention in dairy workers.J Occup Environ Hyg. 2023 Jan;20(1):14-22. doi: 10.1080/15459624.2022.2137297. Epub 2022 Nov 29. J Occup Environ Hyg. 2023. PMID: 36260509 Free PMC article.
-
Associations Between Bioaerosol Exposures and Lung Function Changes Among Dairy Workers in Colorado.J Occup Environ Med. 2020 Jun;62(6):424-430. doi: 10.1097/JOM.0000000000001856. J Occup Environ Med. 2020. PMID: 32221115 Free PMC article.
-
Insights into Livestock-Related Microbial Concentrations in Air at Residential Level in a Livestock Dense Area.Environ Sci Technol. 2019 Jul 2;53(13):7746-7758. doi: 10.1021/acs.est.8b07029. Epub 2019 May 13. Environ Sci Technol. 2019. PMID: 31081619 Free PMC article.
References
-
- Douphrate DI; Hagevoort GR; Nonnenmann MW; Lunner Kolstrup C; Reynolds SJ; Jakob M; Kinsel M The Dairy Industry: A Brief Description of Production Practices, Trends, and Farm Characteristics around the World. Journal of Agromedicine 2013, 18 (3), 187–197. - PubMed
-
- Pruden A; Pei R; Storteboom H; Carlson KH Antibiotic Resistance Genes as Emerging Contaminants: Studies in Northern Colorado. Environ. Sci. Technol 2006, 40 (23), 7445–50. - PubMed
-
- Merchant J; Coussens C; Gilbert D In Rebuilding the Unity of Health and the Environment in Rural America; Workshop Summary, The National Academies Press: Washington, DC, 2006; DOI: 10.17226/11596. Environmental Science & Technology Article DOI:10.1021/acs.est.7b00882 Environ. Sci. Technol. 2017, 51, 6430–6440 - DOI - DOI - PubMed
-
- Mitloehner FM; Schenker MB Environmental Exposure and Health Effects from Concentrated Animal Feeding Operations. Epidemiology 2007, 18 (3), 309–11. - PubMed
MeSH terms
Substances
Grants and funding
LinkOut - more resources
Full Text Sources
Other Literature Sources
