

Trend and Outcomes of Video Laryngoscope Use Across PICUs
- PMID: 28492404
- PMCID: PMC6317345
- DOI: 10.1097/PCC.0000000000001175
Trend and Outcomes of Video Laryngoscope Use Across PICUs
Abstract
Objective: Video (indirect) laryngoscopy is used as a primary tracheal intubation device for difficult airways in emergency departments and in adult ICUs. The use and outcomes of video laryngoscopy compared with direct laryngoscopy has not been quantified in PICUs or cardiac ICUs.
Design: Retrospective review of prospectively collected observational data from a multicenter tracheal intubation database (National Emergency Airway Registry for Children) from July 2010 to June 2015.
Setting: Thirty-six PICUs/cardiac ICUs across the United States, Canada, Japan, New Zealand, and Singapore.
Patients: Any patient admitted to a PICU or a pediatric cardiac ICU and undergoing tracheal intubation.
Interventions: Use of direct laryngoscopy versus video laryngoscopy for tracheal intubation.
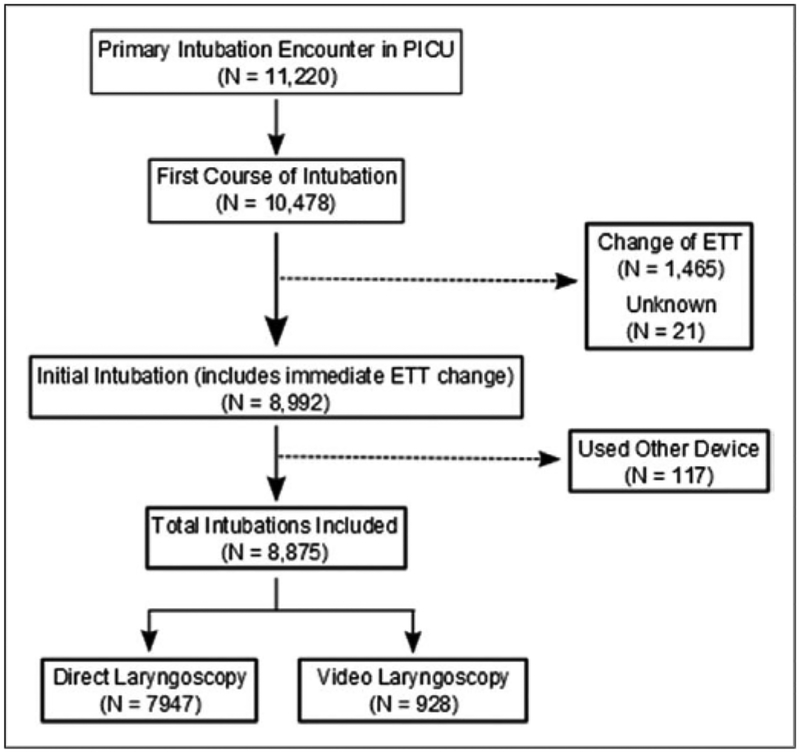
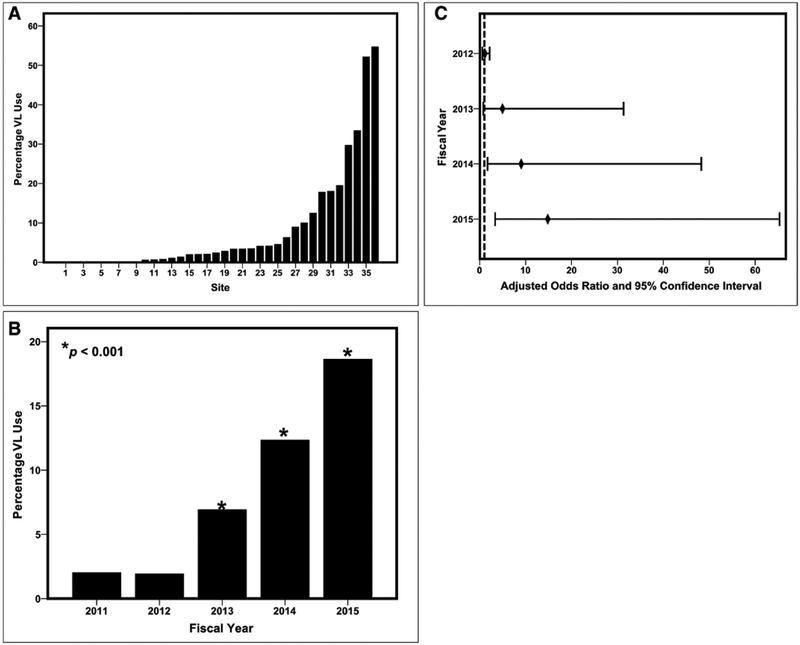
Measurements and main results: There were 8,875 tracheal intubations reported in the National Emergency Airway Registry for Children database, including 7,947 (89.5%) tracheal intubations performed using direct laryngoscopy and 928 (10.5%) tracheal intubations performed using video laryngoscopy. Wide variability in video laryngoscopy use exists across PICUs (median, 2.6%; range, 0-55%). Video laryngoscopy was more often used in older children (p < 0.001), in children with history of a difficult airway (p = 0.01), in children intubated for ventilatory failure (p < 0.001), and to facilitate the completion of an elective procedure (p = 0.048). After adjusting for patient-level covariates, a secular trend, and site-level variance, the use of video laryngoscopy significantly increased over a 5-year period compared with fiscal year 2011 (odds ratio, 6.7; 95% CI, 1.7-26.8 for fiscal year 2014 and odds ratio, 11.2; 95% CI, 3.2-38.9 for fiscal year 2015). The use of video laryngoscopy was independently associated with a lower occurrence of tracheal intubation adverse events (adjusted odds ratio, 0.57; 95% CI, 0.42-0.77; p < 0.001) but not with a lower occurrence of severe tracheal intubation adverse events (adjusted odds ratio, 0.86; 95% CI, 0.56-1.32; p = 0.49) or fewer multiple attempts at endotracheal intubation (adjusted odds ratio, 0.93; 95% CI, 0.71-1.22; p = 0.59).
Conclusions: Using National Emergency Airway Registry for Children data, we described patient-centered adverse outcomes associated with video laryngoscopy compared with direct laryngoscopy for tracheal intubation in the largest reported international cohort of children to date. Data from this study may be used to design sufficiently powered prospective studies comparing patient-centered outcomes for video laryngoscopy versus direct laryngoscopy during endotracheal intubation.
Figures
Comment in
-
Tracheal Intubation: Developing a View on Video Laryngoscopy.Pediatr Crit Care Med. 2017 Aug;18(8):801-803. doi: 10.1097/PCC.0000000000001210. Pediatr Crit Care Med. 2017. PMID: 28796704 No abstract available.
-
A Review of Current Literature of Interest to the Office-Based Anesthesiologist.Anesth Prog. 2017 Fall;64(3):188-191. doi: 10.2344/0003-3006-64.3.188. Anesth Prog. 2017. PMID: 28858555 Free PMC article. No abstract available.
References
-
- Li S, Rehder KJ, Giuliano JS Jr, et al.: Development of a quality improvement bundle to reduce tracheal intubation-associated events in pediatric ICUs. Am J Med Qual 2016; 31 :47–55 - PubMed
-
- Nett S, Emeriaud G, Jarvis JD, et al.; NEAR4KIDS Investigators and Pediatric Acute Lung Injury and Sepsis Investigators (PALISI) Network: Site-level variance for adverse tracheal intubation-associated events across 15 North American PICUs: A report from the national emergency airway registry for children. Pediatr Crit Care Med 2014; 15:306–313 - PubMed
-
- Nishisaki A, Turner DA, Brown CAIII, et al.; National Emergency Airway Registry for Children (NEAR4KIDS); Pediatric Acute Lung Injury and Sepsis Investigators (PALISI) Network: A National Emergency Airway Registry for children: Landscape of tracheal intubation in 15 PICUs. Crit Care Med 2013; 41 :874–885 - PubMed
-
- De Jong A, Molinari N, Conseil M, et al.: Video laryngoscopy versus direct laryngoscopy for orotracheal intubation in the intensive care unit: A systematic review and meta-analysis. Intensive Care Med 2014. ;40 :629–639 - PubMed
-
- Jones BM, Agrawal A, Schulte TE: Assessing the efficacy of video versus direct laryngoscopy through retrospective comparison of 436 emergency intubation cases. J Anesth 2013; 27:927–930 - PubMed
Publication types
MeSH terms
Grants and funding
LinkOut - more resources
Full Text Sources
Other Literature Sources
Medical
