

Inequalities in Life Expectancy Among US Counties, 1980 to 2014: Temporal Trends and Key Drivers
- PMID: 28492829
- PMCID: PMC5543324
- DOI: 10.1001/jamainternmed.2017.0918
Inequalities in Life Expectancy Among US Counties, 1980 to 2014: Temporal Trends and Key Drivers
Abstract
Importance: Examining life expectancy by county allows for tracking geographic disparities over time and assessing factors related to these disparities. This information is potentially useful for policy makers, clinicians, and researchers seeking to reduce disparities and increase longevity.
Objective: To estimate annual life tables by county from 1980 to 2014; describe trends in geographic inequalities in life expectancy and age-specific risk of death; and assess the proportion of variation in life expectancy explained by variation in socioeconomic and race/ethnicity factors, behavioral and metabolic risk factors, and health care factors.
Design, setting, and participants: Annual county-level life tables were constructed using small area estimation methods from deidentified death records from the National Center for Health Statistics (NCHS), and population counts from the US Census Bureau, NCHS, and the Human Mortality Database. Measures of geographic inequality in life expectancy and age-specific mortality risk were calculated. Principal component analysis and ordinary least squares regression were used to examine the county-level association between life expectancy and socioeconomic and race/ethnicity factors, behavioral and metabolic risk factors, and health care factors.
Exposures: County of residence.
Main outcomes and measures: Life expectancy at birth and age-specific mortality risk.
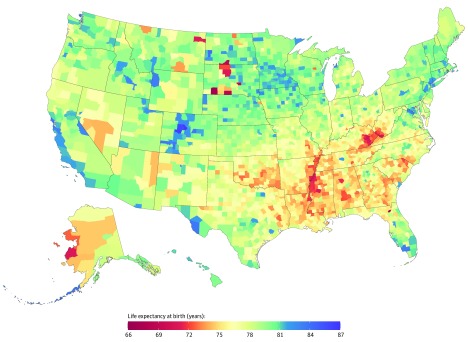
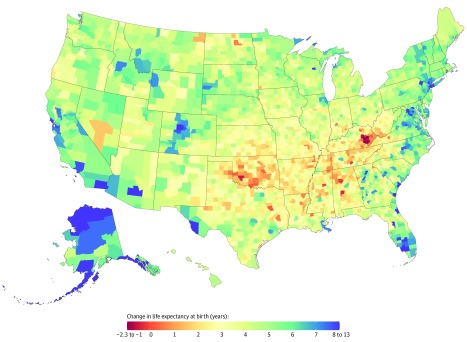
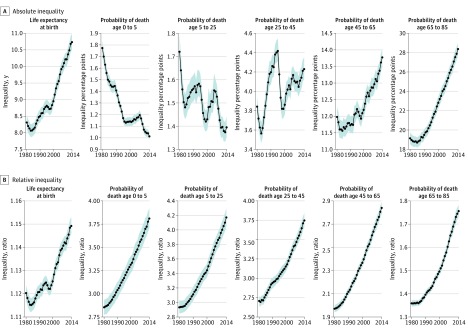
Results: Counties were combined as needed to create stable units of analysis over the period 1980 to 2014, reducing the number of areas analyzed from 3142 to 3110. In 2014, life expectancy at birth for both sexes combined was 79.1 (95% uncertainty interval [UI], 79.0-79.1) years overall, but differed by 20.1 (95% UI, 19.1-21.3) years between the counties with the lowest and highest life expectancy. Absolute geographic inequality in life expectancy increased between 1980 and 2014. Over the same period, absolute geographic inequality in the risk of death decreased among children and adolescents, but increased among older adults. Socioeconomic and race/ethnicity factors, behavioral and metabolic risk factors, and health care factors explained 60%, 74%, and 27% of county-level variation in life expectancy, respectively. Combined, these factors explained 74% of this variation. Most of the association between socioeconomic and race/ethnicity factors and life expectancy was mediated through behavioral and metabolic risk factors.
Conclusions and relevance: Geographic disparities in life expectancy among US counties are large and increasing. Much of the variation in life expectancy among counties can be explained by a combination of socioeconomic and race/ethnicity factors, behavioral and metabolic risk factors, and health care factors. Policy action targeting socioeconomic factors and behavioral and metabolic risk factors may help reverse the trend of increasing disparities in life expectancy in the United States.
Conflict of interest statement
Figures
Comment in
-
Considerations for County-Level Inequalities in Life Expectancy.JAMA Intern Med. 2017 Nov 1;177(11):1697-1698. doi: 10.1001/jamainternmed.2017.5830. JAMA Intern Med. 2017. PMID: 29114791 No abstract available.
-
Considerations for County-Level Inequalities in Life Expectancy-Reply.JAMA Intern Med. 2017 Nov 1;177(11):1698. doi: 10.1001/jamainternmed.2017.5858. JAMA Intern Med. 2017. PMID: 29114800 No abstract available.
References
-
- Wei R, Anderson RN, Curtin LR, Arias E. U.S. decennial life tables for 1999-2001: state life tables. Natl Vital Stat Rep. 2012;60(9):1-66. - PubMed
-
- US Department of Health and Human Services Healthy People 2020 Framework. https://www.healthypeople.gov/sites/default/files/HP2020Framework.pdf. Accessed July 13, 2016.
Publication types
MeSH terms
Grants and funding
LinkOut - more resources
Full Text Sources
Other Literature Sources
Medical
