

Magnetic resonance elastography measured shear stiffness as a biomarker of fibrosis in pediatric nonalcoholic fatty liver disease
- PMID: 28493388
- PMCID: PMC5650504
- DOI: 10.1002/hep.29241
Magnetic resonance elastography measured shear stiffness as a biomarker of fibrosis in pediatric nonalcoholic fatty liver disease
Abstract
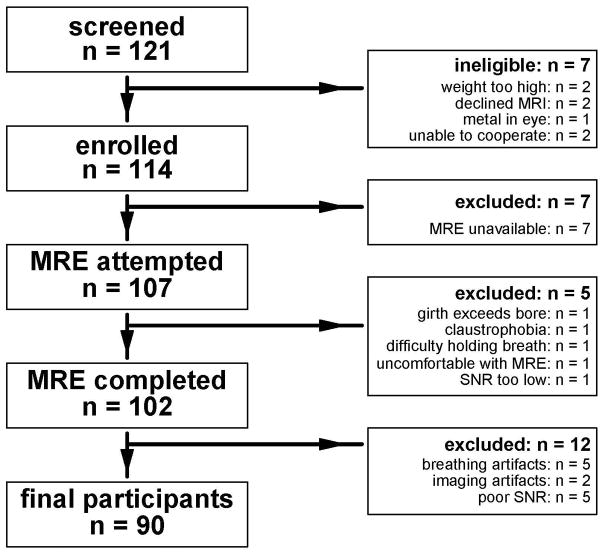
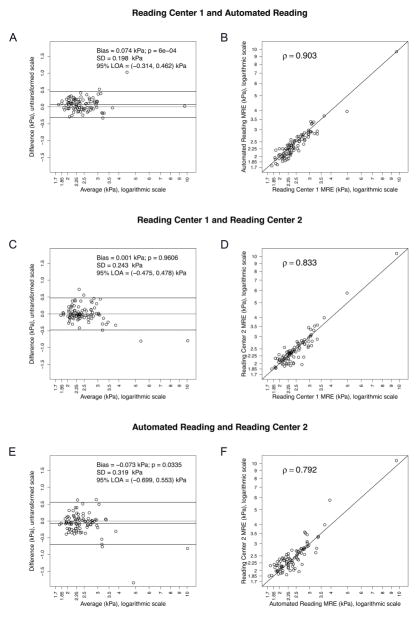
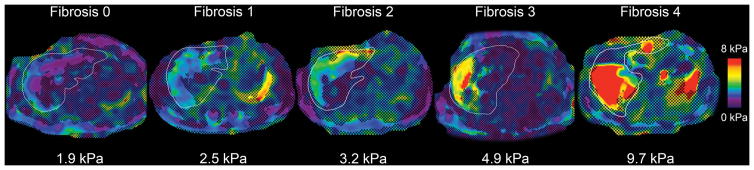
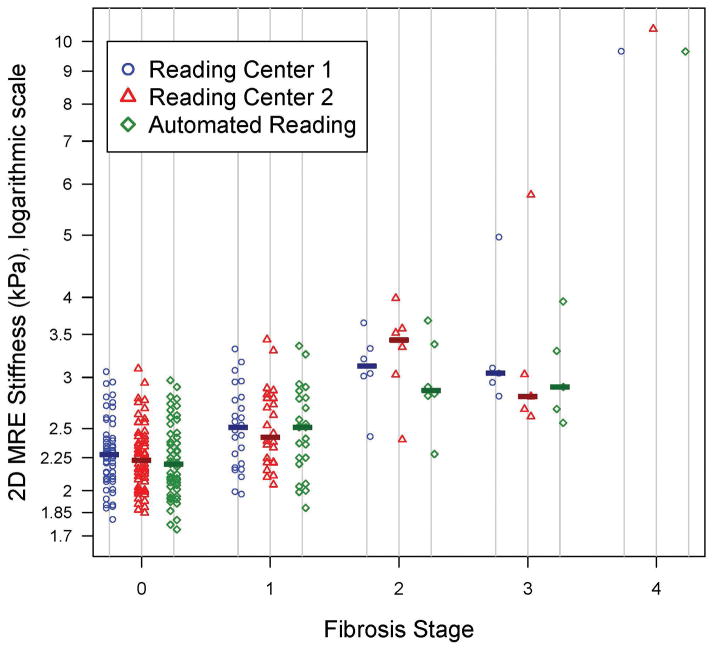
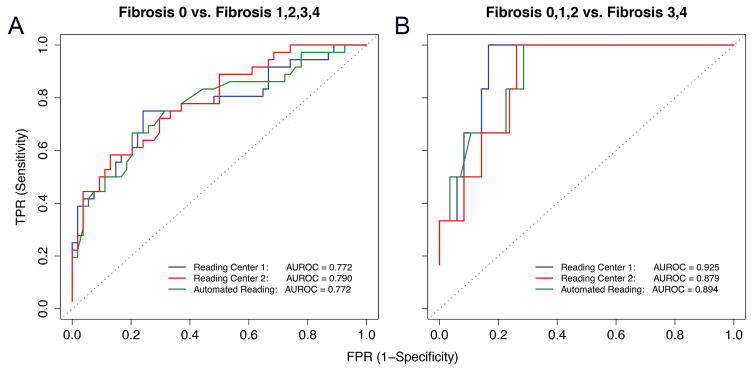
Magnetic resonance elastography (MRE) is a promising technique for noninvasive assessment of fibrosis, a major determinant of outcome in nonalcoholic fatty liver disease (NAFLD). However, data in children are limited. The purpose of this study was to determine the accuracy of MRE for the detection of fibrosis and advanced fibrosis in children with NAFLD and to assess agreement between manual and novel automated reading methods. We performed a prospective, multicenter study of two-dimensional (2D) MRE in children with NAFLD. MR elastograms were analyzed manually at two reading centers, and using a new automated technique. Analysis using each approach was done independently. Correlations were determined between MRE analysis methods and fibrosis stage. Thresholds for classifying the presence of fibrosis and of advanced fibrosis were computed and cross-validated. In 90 children with a mean age of 13.1 ± 2.4 years, median hepatic stiffness was 2.35 kPa. Stiffness values derived by each reading center were strongly correlated with each other (r = 0.83). All three analyses were significantly correlated with fibrosis stage (center 1, ρ = 0.53; center 2, ρ = 0.55; and automated analysis, ρ = 0.52; P < 0.001). Overall cross-validated accuracy for detecting any fibrosis was 72.2% for all methods (95% confidence interval [CI], 61.8%-81.1%). Overall cross-validated accuracy for assessing advanced fibrosis was 88.9% (95% CI, 80.5%-94.5%) for center 1, 90.0% (95% CI, 81.9%-95.3%) for center 2, and 86.7% (95% CI, 77.9%-92.9%) for automated analysis.
Conclusion: 2D MRE can estimate hepatic stiffness in children with NAFLD. Further refinement and validation of automated analysis techniques will be an important step in standardizing MRE. How to best integrate MRE into clinical protocols for the assessment of NAFLD in children will require prospective evaluation. (Hepatology 2017;66:1474-1485).
© 2017 by the American Association for the Study of Liver Diseases.
Figures
Comment in
-
Magnetic resonance elastography assessment of fibrosis in children with NAFLD: Promising but not perfect.Hepatology. 2017 Nov;66(5):1373-1376. doi: 10.1002/hep.29393. Epub 2017 Sep 29. Hepatology. 2017. PMID: 28741294 Free PMC article. No abstract available.
References
-
- Schwimmer JB, Deutsch R, Kahen T, Lavine JE, Stanley C, Behling C. Prevalence of fatty liver in children and adolescents. Pediatrics. 2006;118:1388–1393. - PubMed
-
- Lindback SM, Gabbert C, Johnson BL, Smorodinsky E, Sirlin CB, Garcia N, Pardee PE, et al. Pediatric nonalcoholic fatty liver disease: a comprehensive review. Adv Pediatr. 2010;57:85–140. - PubMed
-
- Rubinstein E, Lavine JE, Schwimmer JB. Hepatic, cardiovascular, and endocrine outcomes of the histological subphenotypes of nonalcoholic fatty liver disease. Semin Liver Dis. 2008;28:380–385. - PubMed
-
- Schwimmer JB, Behling C, Newbury R, Deutsch R, Nievergelt C, Schork NJ, Lavine JE. Histopathology of pediatric nonalcoholic fatty liver disease. Hepatology. 2005;42:641–649. - PubMed
Publication types
MeSH terms
Substances
Grants and funding
- U01 DK061737/DK/NIDDK NIH HHS/United States
- U01 DK061713/DK/NIDDK NIH HHS/United States
- U01 DK061732/DK/NIDDK NIH HHS/United States
- R37 EB001981/EB/NIBIB NIH HHS/United States
- UL1 TR001442/TR/NCATS NIH HHS/United States
- R01 DK088925/DK/NIDDK NIH HHS/United States
- U01 DK061730/DK/NIDDK NIH HHS/United States
- R56 DK090350/DK/NIDDK NIH HHS/United States
- R01 EB001981/EB/NIBIB NIH HHS/United States
- U01 DK061734/DK/NIDDK NIH HHS/United States
- UL1 RR031980/RR/NCRR NIH HHS/United States
- UL1 TR000100/TR/NCATS NIH HHS/United States
LinkOut - more resources
Full Text Sources
Other Literature Sources
Medical
