

Review of methods for measuring β-cell function: Design considerations from the Restoring Insulin Secretion (RISE) Consortium
- PMID: 28493515
- PMCID: PMC6095472
- DOI: 10.1111/dom.13005
Review of methods for measuring β-cell function: Design considerations from the Restoring Insulin Secretion (RISE) Consortium
Abstract
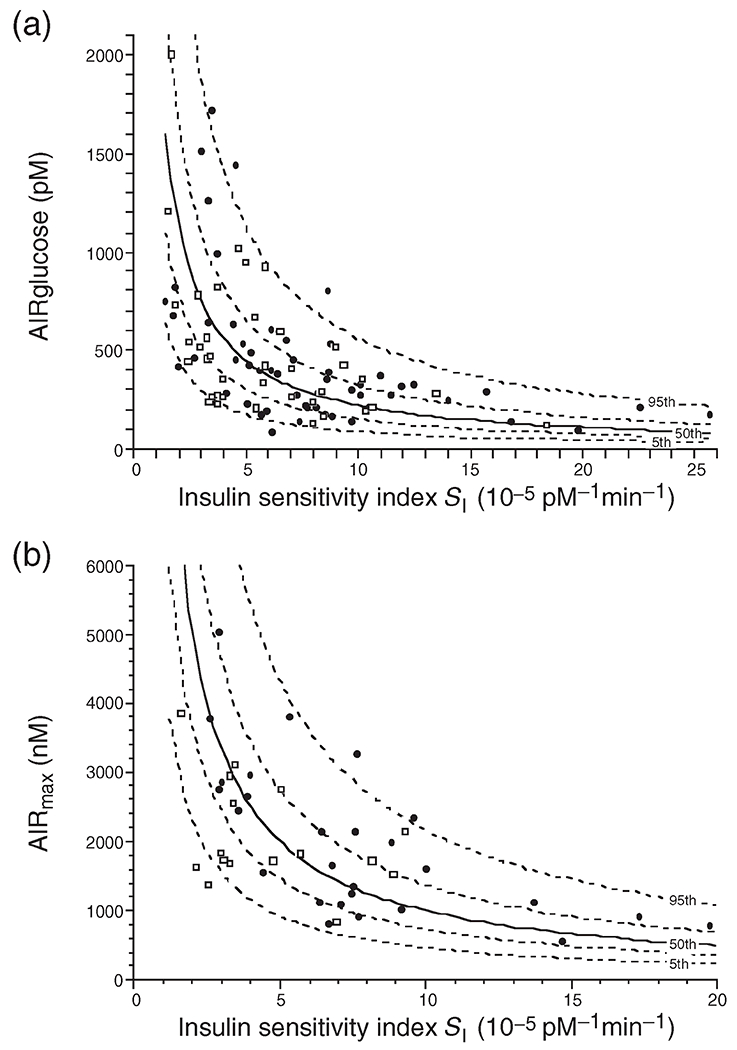
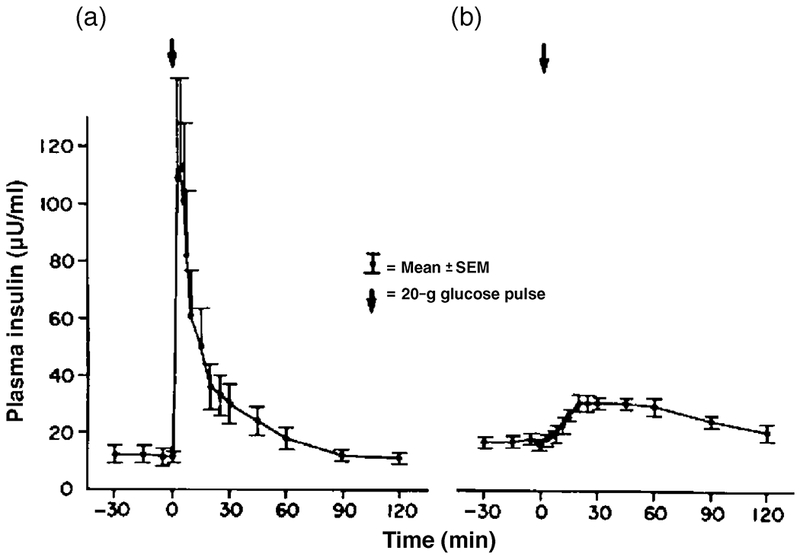
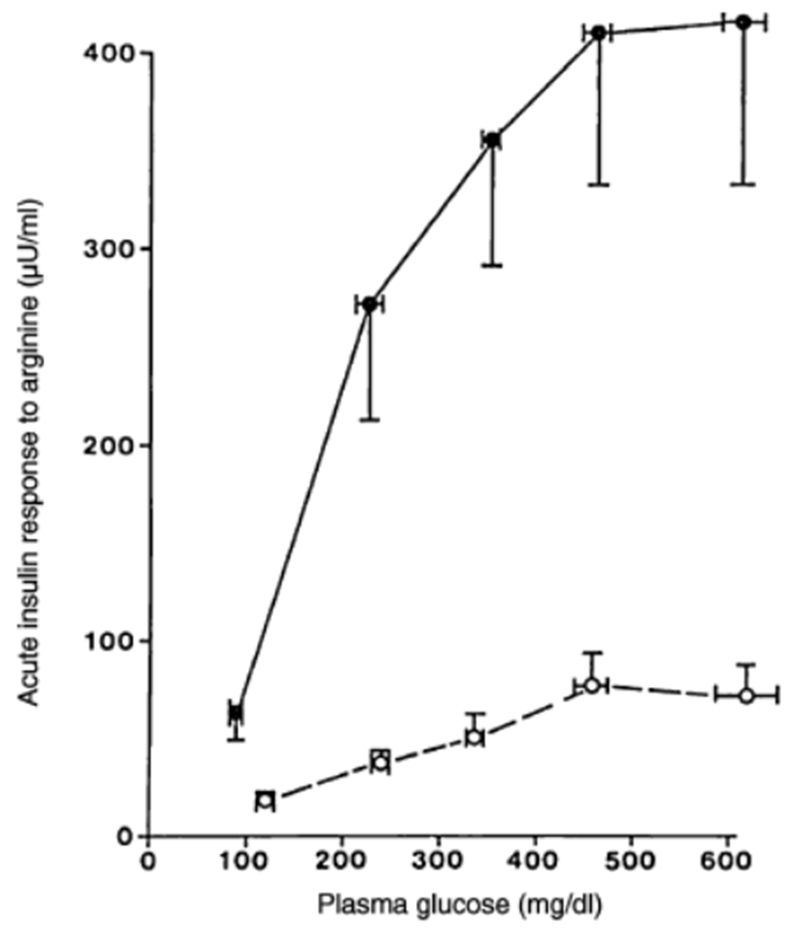
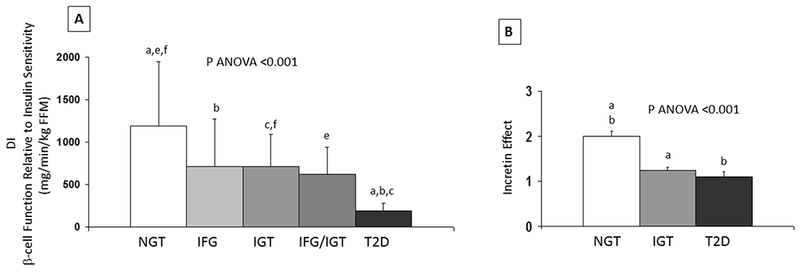
The Restoring Insulin Secretion (RISE) study was initiated to evaluate interventions to slow or reverse the progression of β-cell failure in type 2 diabetes (T2D). To design the RISE study, we undertook an evaluation of methods for measurement of β-cell function and changes in β-cell function in response to interventions. In the present paper, we review approaches for measurement of β-cell function, focusing on methodologic and feasibility considerations. Methodologic considerations included: (1) the utility of each technique for evaluating key aspects of β-cell function (first- and second-phase insulin secretion, maximum insulin secretion, glucose sensitivity, incretin effects) and (2) tactics for incorporating a measurement of insulin sensitivity in order to adjust insulin secretion measures for insulin sensitivity appropriately. Of particular concern were the capacity to measure β-cell function accurately in those with poor function, as is seen in established T2D, and the capacity of each method for demonstrating treatment-induced changes in β-cell function. Feasibility considerations included: staff burden, including time and required methodological expertise; participant burden, including time and number of study visits; and ease of standardizing methods across a multicentre consortium. After this evaluation, we selected a 2-day measurement procedure, combining a 3-hour 75-g oral glucose tolerance test and a 2-stage hyperglycaemic clamp procedure, augmented with arginine.
Trial registration: ClinicalTrials.gov NCT01779362 NCT01779375 NCT01763346.
Keywords: glucose metabolism; insulin resistance; insulin secretion; type 2 diabetes; β cell.
© 2017 John Wiley & Sons Ltd.
Figures
References
-
- Kahn SE. The importance of the beta-cell in the pathogenesis of type 2 diabetes mellitus. The American journal of medicine. 2000; 108 Suppl 6a: 2S–8S - PubMed
-
- Abdul-Ghani MA, Jenkinson CP, Richardson DK, Tripathy D, DeFronzo RA. Insulin secretion and action in subjects with impaired fasting glucose and impaired glucose tolerance: results from the Veterans Administration Genetic Epidemiology Study. Diabetes. 2006; 55: 1430–1435 - PubMed
-
- Weiss R, Caprio S, Trombetta M, Taksali SE, Tamborlane WV, Bonadonna R. Beta-cell function across the spectrum of glucose tolerance in obese youth. Diabetes. 2005; 54: 1735–1743 - PubMed
-
- Elder DA, Prigeon RL, Wadwa RP, Dolan LM, D’Alessio DA. Beta-cell function, insulin sensitivity, and glucose tolerance in obese diabetic and nondiabetic adolescents and young adults. The Journal of clinical endocrinology and metabolism. 2006; 91: 185–191 - PubMed
Publication types
MeSH terms
Substances
Associated data
Grants and funding
LinkOut - more resources
Full Text Sources
Other Literature Sources
Medical
